Blog

The Network and the Update

SQL Server
17 Comments

We work with SQL Server every day, happily sending and receiving millions of packets of data across the network. Have you stopped to think about what happens when something goes wrong?

The Situation

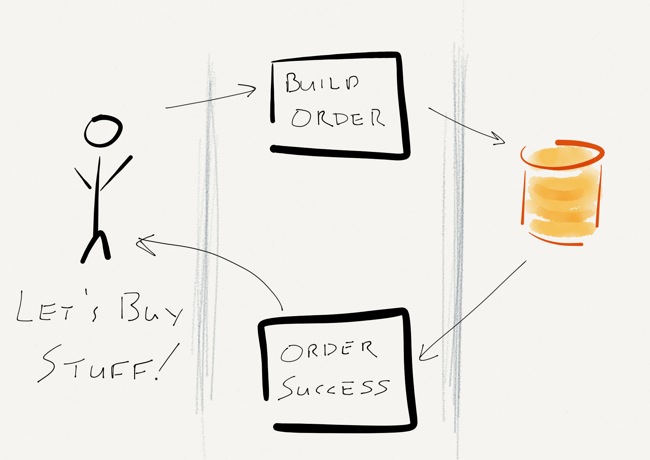
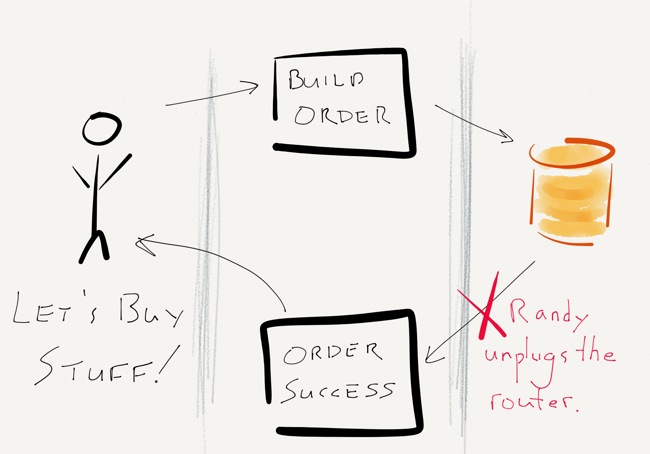
It’s a regular Tuesday afternoon. Users are happily submitting orders into the shopping cart. After browsing around the website for a while, the users decide that it’s time to buy something. After clicking “Check out now”, the user goes through the check out process, enters their payment information, and then clicks “Buy some stuff!” A few milliseconds later, they get a message that their order was successful and everything is zipping over to their house.

It’s something that we do every day, right? Heck, it’s simple enough that I drew a little diagram:

The state of the application... when it's working.
The state of the application… when it’s working.

The Problem

What happens when something goes wrong?

There are a lot of places where things could go wrong – a browser bug could prevent form submission, the shopping cart application could go down, the ordering system could be down for maintenance, or SQL Server might even crash (but you’ve configured a solid HA system, so that ain’t gonna happen).

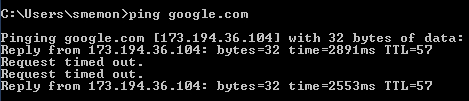
What’s left to fail? The network.

Everything works as it should – the user clicks “Buy some stuff!” and a message is sent to the application servers. The application servers do their magic, approve the credit card, build an order, and save the order in SQL Server. Immediately after SQL Server acknowledges the write and commits the transaction, but before any confirmation is sent to the user, the top of the rack switch power cycles. Randy, the operations intern, accidentally unplugged the power cord before plugging it back in.

There goes the network neighborhood.

Now What?

This is the part that’s up to you. Sound off in the comments:

  • Did the user’s write succeed or fail?
    • What does SQL Server think?
    • What does the application think?
    • Did SQL Server do the right thing?
  • What can you do about this sort of thing?
  • How can your application handle failures like this?

Missed Connection: Employer Seeking Employee

Company News, SQL Server
28 Comments

You were helping a sysadmin understand the details of a request for a new virtual server. You whiteboarded a diagram to show how SQL Server uses memory. You got so excited when the sysadmin asked a hard question that you spilled coffee everywhere.

We were tuning queries on a video conference with developers from That Software Company next door. They said they wished you worked with them, because you ask such great questions at the coffee maker.

We’re looking for someone just like you.

We are: a small team of loving SQL commando medics. We parachute in when our clients need help. We diagnose what’s causing their problems and build a plan to solve their biggest pain points. We’re growing, and we’re hiring a full time SQL Server consultant.

Team Meetings
Team Meetings

The Job: What You’ll Do

As Employee #2, you’ll help clients make their SQL Servers faster and more reliable.

Your missions will usually be short term consulting projects. You will diagnose bottlenecks in storage, problems in Windows and SQL Server configuration, and figure out when queries are killing a server. You’ll help clients understand the root causes of their problem, and you’ll prescribe a custom action plan that solves their issues in the short, medium, and long term.

Although you’ll work from home most of the time, you’ll be an integral part of our team. You’ll adopt our SQL Critical Care® toolkit and processes, but you’ll also get inspired, and suggest and build improvements for the whole team to use. You’ll work closely with me, Brent, Jeremiah, and Jes during the days: we use chat, email, and hangouts to ask questions and solve problems as a group.

You’ll contribute to our online video training. You’ll challenge yourself and learn something every week.

What We’ll Do for You

We work hard, and we take time off seriously. Our benefits include:

  • 6 weeks paid vacation per year
  • 1 paid conference, plus 1 week of learning (on projects to be announced soon) — each year. You don’t have to speak at the conference, and it doesn’t count as vacation time.
  • Health insurance
  • Full time telecommuting with a max of 1 week of travel per 2 months
  • Paid certification attempts (whether you pass or fail)
  • Home internet/VOIP/cell phone expenses paid
  • $3,000 hardware/software budget every 2 years to pick your own tools (we like Apple gear, but you can pick whatever you want – you’re your own IT department)
  • If you’re a Microsoft MVP, we pay for your travel and time for the MVP Summit each year.
  • We’ve started a tradition of awesome company trips, and we have one booked for February 2014. You and your significant other will be invited along. (You just need a passport.)

To Apply, Send Us Two Things

First, we need to know where you’ve spoken recently and what you talked about. This can include all sorts of public speaking– it doesn’t have to be technical.

Next, tell us how you give back to a technical community. (It doesn’t have to be the SQL Server community.)

Email the details (be specific!) on both of these things to help@BrentOzar.com along with your name, and you’re in the running! 

If you’ve only got the good intentions to start speaking soon, don’t apply. Get out there and do it, and tell us about it next time.

Don’t send us your resume. We only want the two items listed above right now.

Our work is never boring.

It may take us some time to decide. We lucked out last time and found Jes pretty quickly after we posted our ad. A year and a half later, we know we couldn’t have hired a better Employee #1.

Life’s not always that easy. It’s probably going to take a while to find the right person this time– and we’re willing to wait as long as we need to. But you never know, so drop us a line fast!


You Can’t Kill Transactional Replication

Replication
183 Comments
Roach-Top-View
Repli-Roach

If SQL Server’s Transactional Replication was an animal, it would be a cockroach. It’s not pretty, but it’s resourceful and strong. Once you get even a small amount of replication in your environment it starts spreading everywhere. And if it gets out of control– well, in that case you’ve got no choice but to pretty much bomb everything, clear the fumes as quickly as possible, and reinitialize.

But unlike a cockroach, you can’t always just get rid of Transactional Replication. The bad news is, it’s here to stay.

In this post you’ll get a whirlwind introduction to Transactional Replication. I’ll explain why newer features like Change Tracking, Change Data Capture, and Availability Groups have failed at exterminating Transactional Replication. You’ll also learn what it takes to support replication in a mission critical environment.

SQL Server Transactional Replication basics

SQL-Server-Transactional-Replication-Publisher

Transactional Replication lets you publish and filter individual database objects.

1) Publications define replicated articles. Transactional Replication lets you select individual tables to publish (called “articles”), allowing you to just publish a fraction of a very large database. It also lets you:

2) A fleet of SQL Server Agent jobs does magic. I just learned this: a group of cockroaches is called “an intrusion of cockroaches.” That seems like it probably applies to a whole lot of SQL Server Agent jobs, too.

Exactly how many jobs? So many jobs that you’ll lose count. Replication is complicated. It’s got a SQL Server Agent job to read the transaction log of where you’ve defined your publications (Log Reader Agent). There’s another job that helps run Snapshots (it helps you initialize or re-initialize the replication). Another helps apply the snapshot and move transactions around (the Distribution Agent).

There are also jobs for cleaning things up, refreshing monitoring, and all the general scuttling around that replication does.

SQL-Server-Transactional-Replication-Distributor

3) The distribution database collects commands. Replication doesn’t send transactions directly to your subscribers. The Log Reader Agent snoops in your transaction log and figures out what changes have been made to the articles you’ve defined in your publications. When it finds changes, it sends them over to the distribution database.

You can configure distribution on the publishing server, or you can scale it out to an independent server. The important thing to know is that each change you make in your publisher gets translated into independent commands (insert, update, and delete), and these commands get inserted into the distribution database before it moves onward. No matter what you do, that process takes some time: replication isn’t instantaneous.

4) Commands get applied to subscribers. You may set up many subscriptions to a single publication. This is part of what’s cool about replication– a single publication can publish a narrow group of tables to be read by many subscribers (perhaps in different datacenters around the world).

You can elect to configure pull subscriptions or push subscriptions. In the “pull” model, each subscriber runs jobs that poll in data periodically. In the “push” model, the changes are more constantly pushed out to the subscribers from the distributor.

5) Old commands get cleaned up. Hopefully. Lots of commands may collect up in the distribution database. That can be a good thing– maybe a subscriber is offline for a few hours, wouldn’t it be sad if it couldn’t catch up?

But you don’t want to hoard too many commands, or your distribution database will bloat up like crazy. There are jobs that delete out old commands. In an active environment, balancing out cleanup, new activity, and pushing SQL-Server-Transactional-Replication-Subscriberdata to subscribers can be… challenging.

6) Then you learn a million factoids. We’ve barely scratched the surface. I haven’t shown you Replication Monitor, a tool whose GUI is so confusing that you don’t dare take your eyes off it. (It’s hard to avoid it, but do use it with care– I’ve had it cause blocking when run by multiple people concurrently in a couple versions of SQL Server.) I haven’t talked about tweaking Replication Agent Profile Settings or the limitations of tracer tokens. We haven’t debated when you might want to initialize from backup.

Transactional Replication is a complicated monster. It’s not something you can book-learn, it’s just got far too many configuration options and moving parts. Replication something you learn by trying it, having problems, fixing it, and then repeating the process.


Transactional Replication vs. Change Tracking

Two new replication-ish features were introduced in SQL Server 2008: Change Tracking and Change Data Capture. These two technologies are both completely separate from replication, and from each other.

Change Tracking, like transactional replication, is available in Standard Edition. That’s a good thing, but if you’re comparing the two features, people still pick replication.

Change tracking just answers a very basic question: has a row changed? It doesn’t capture the “old data” or send the “new data” anywhere– it just updates a marker letting you know that a row has changed since your application last polled it.

It’s up to the user to write an application to regularly poll the tables (and know what version it last tracked).

It’s also recommended for the user to enable snapshot isolation on the database using change tracking and explicitly use it when querying Change Tracking tables to make sure that you don’t miss data or cause blocking with Change Tracking cleanup processes. Snapshot isolation is great, but turning it on and managing it are not at all trivial.

Change Tracking also has some additional overhead. For each row modified in a tracked table, a row is added to a change table. For each transaction that commits, a row is inserted into an internal transaction table, also. (It doesn’t keep the previous values in those tables, so they’re small inserts, but on super active tables that’s extra writes hitting the transaction log of your database– and extra writes when those tables get cleaned up.)

Verdict: Replication is complicated, but Change Tracking ain’t simpler. Due to having much less custom code to write, more freedom with isolation levels, and no extra inserts in internal tables, most people decide that Transactional Replication beats Change Tracking.


Transactional Replication vs. Change Data Capture

How about Change Tracking’s distant cousin, Change Data Capture? This is an Enterprise Edition feature– it must surely perform better than the Standard Edition friendly Transactional Replication, right? Well, sorry, not necessarily.

I love the concept behind Change Data Capture. Imagine that you’re a database administrator managing a transactional replication publication. You have a table that holds advertising campaign keywords.

  • Each row in the table contains a CampaignID column, a keyword column, and a BidPrice column
  • Some campaigns have hundreds of thousands of keywords
  • Tools let advertisers set up campaigns quickly with LOADS of keywords– and the keyword BidPrice
No magical creature here

It’s the day before a big holiday. One of the big advertisers goes in, and sets up a huge campaign– 200K rows of changes roll into the table. They realize they messed up and deactivate it right away. 200K more changes roll in. Then they set up a new one. Then the tweak the BidPrice.

Suddenly replication is churning trying to get all these changes into the distribution database, not to mention handle what’s happening in any other replicated tables you have. Replicated commands start backing up.

You’re left saying, “But all I want is the most recent change they made!”

This is the scenario where Change Data Capture sounds like a great idea. The concept with “CDC” is that you write your own polling. If you poll every hour, you just pick up the latest version of the row (or whatever history you want), and take that with you. You don’t have to take every command, so it’s super light-weight.

But CDC isn’t all unicorns and magic, either.

When you enable Change Data Capture for a table, SQL Server starts tracking inserts, updates, and deletes in the transaction log (similarly to replication). But when you make changes, they’re read from the log and then inserted into “change tables” associated with the tracked tables. The change tables are automatically created in the same database as the tracked tables– and inserts into them are also logged operations. So for every modification you do on a change tracked table, you’re also doing an insert (and logging it) into a tracking table.

Data in the tracking tables needs to be cleaned up periodically, of course– and that also gets logged. You need to write your own polling mechanism to pull changes, and there’s limitations to how you can change schema of a table.

While our test scenario seemed like perhaps it would help us out, after checking out a whitepaper on tuning CDC, things don’t look so hot: the whitepaper recommends avoiding scenarios where rows can be updated immediately after insert, and also avoiding scenarios where large update scenarios can occur. Also, our dream of only pulling the latest, or “net” change if a row has been changed multiple times has a cost– that requires an additional index on each tracking table, and the whitepaper points out that this can have a noticeable performance hit. This isn’t seeming like such a great fit anymore– and worse, it sounds like if it doesn’t go well, it’s going to slow down our whole publishing database.

This comparison highlights that although transactional replication commands can get backed up in the distributor, the fact that replication allows distribution to be offloaded to its own server independent from the publisher is a real strength.

Verdict: Due to extra logging caused by internal change tables (and cleanup), plus the need to write custom code, plus limitations on schema changes, most people decide that Transactional Replication beats Change Data Capture.


Transactional Replication vs. Availability Groups

Now here’s a real competitor, right? SQL Server 2012 AlwaysOn Availability Groups allow you to scale out reads across multiple SQL Server instances. You can set up readable secondary copies of a database which have their own independent storage, memory, and server resources. The secondaries can be in either a synchronous or asynchronous mode. You can even offload backups to secondaries.

If anything can render Transactional Replication completely outdated and useless, this is the feature.

It’s absolutely true that Availability Groups are better than transactional replication for high availability. But that’s not surprising– Transactional Replication is terrible for high availability! Even in Standard Edition, a simple two node failover cluster beats Transactional Replication when it comes to HA. So, yes, Availability Groups wins here, but replication doesn’t even make second place. (By a long shot.)

But when it comes to scaling out reads, Availability Groups still aren’t perfect. SQL Server 2012 did introduce a cool new feature where temporary statistics are created for read only databases that helps this feature out, but it doesn’t quite do everything. Availability Group readable secondaries still have some limitations:

  • You can’t create indexes on the secondaries– all indexes must be created on the primary
  • The more indexes you create on the primary, the heavier your IO load and potential for data churn in maintenance– which makes it harder for secondaries to keep up
  • The whole database goes in the availability group. You can’t just include a couple of tables.

Verdict: Using Availability Groups for scale out reads works in some scenarios, but it does not replace Transactional Replication.


Transactional Replication doesn’t solve your HA or DR pains

If you remember one thing from this article, make it this fact: Transactional Replication is not a good way to save your bacon if a server fails or a database gets corrupted. This isn’t a feature for high availability and disaster recovery– it’s much more of a programmability feature to distribute data from a few critical tables from one instance out to many subscribers.

Transactional Replication does NOT support any of the following:

  • Failover (or fail-back)
  • Connection string enhancements
  • Load balancing
  • Automatic page repair from corruption
  • Protection of the replicated data (it can be updated, made incorrect, etc)

For high availability and disaster recovery, you want to look primarily at other features in SQL Server.


What if you need to write to multiple masters?

If you’ve got a datacenter in China, a datacenter in Europe, and a datacenter in the United States, you probably don’t want to send all of your writes to just one datacenter. You probably want to send writes to the closest local datacenter and have changes synchronize between databases in all of them.

There’s only one feature in SQL Server that helps with this: peer to peer replication. It’s an Enterprise Edition feature which is like two-way transactional replication. Peer to peer replication requires that you handle conflict resolution, and isn’t compatible with all newer features (example: Availability Groups).

Transactional replication has a feature called Updatable Subscriptions that allows changes at a subscriber to be sent back around to the publisher, but the feature has been deprecated in SQL Server 2012. You’re recommended to look to Peer to Peer replication instead.


Requirements for supporting replication

I have a confession to make: I like Transactional Replication. There’s something about it which I admire– its flexibility, its tenacity, its ability to endlessly survive and propagate itself through more and more versions of SQL Server while other features continuously try and fail to exterminate it.

Roachlipication-Database
Transactional replication: a force of nature

I don’t often recommend that clients use Transactional Replication. Frequently, there are other ways to solve a problem without taking on the burden of supporting Transactional Replication. It’s just not that easy to support.

If you do think you need Transactional Replication, make sure you have the right staff in place. For mission critical data, you need to have multiple, dedicated SQL Server DBAs, an established on-call rotation, a good incident response system, root cause analysis, a pre-production environment, good Change Management processes, and the ability and desire to refine and extend production monitoring.

That may sound like a lot, but trust me, the first time someone asks, “why is the data on the subscriber so old?”, you’re going to realize why I listed a lot of things. One thing you can count on with replication is that there’s sure to be interesting times along the way.


What Server Should You Buy?

Licensing, SQL Server
1 Comment

When you get a new laptop, you don’t just pick Small, Medium, or Large. You look at all kinds of specs – screen resolution and size, memory size, storage, weight, and of course, price. Eventually you pick the one that’s perfect for you, and then you shake your fist at the skies because you can’t actually afford it, and then you go back through the list again. (What, is that just me?)

When you buy a server, you face the same choices. In the old days, we just picked 1 socket, 2 sockets, 4 sockets, or 8 sockets, and we were done.

Today, if I head over to Dell and try to shuffle through the 2-socket servers, I’ve got a bewildering array of choices:

Eeny, meeny, miny, mo

Do I want flexible IO, data-intensive, or state-of-the-art flexibility? What do these terms even mean? Can I get a 50-50 and eliminate half of the choices?

Step 1: Make a list of the software features you’re going to use.

Are you building a cluster or using virtualization? That means accessing shared storage.

If you’re implementing SQL Server 2012 in a cluster, you might want to use the new capability to put TempDB on local SSDs. If you’re considering SQL Server 2014, you might want even more space for Buffer Pool Extensions, the ability to cache frequently used tables locally on SSD. If you’re sticking with old faithful SQL Server 2008 in a cluster, amp up that storage throughput – all of your data, including TempDB, is going to live on the SAN.

If you’re implementing SQL Server Enterprise Edition, you’ll want lots of memory – it’s dirt cheap compared to the software licensing costs. On the other hand, if you’re sticking with SQL Server Standard Edition, which is capped at just 64GB of memory, then you don’t need a box that can take a terabyte or more of memory. 

Step 2: Plan the lifespan of your server.

Servers need expiration dates. Sure, we all think we’re going to be around forever, and nobody wants to talk about old age. If we don’t plan for it, though, we end up alone and cold, shivering in the alley, trying to bum a cigarette off a passing NoSQL “admin” who was able to keep up with the changes in – 

Wait, I got off track there. Servers. But the NoSQL guys have a real point – they deploy commodity hardware in packs, knowing that as new faster stuff comes out, they can smoothly swap out boxes without taking the entire cluster down. Virtualization sysadmins can do the same thing. Heck, even us lowly Microsoft SQL Server guys can do it as long as we plan well enough, and to do that, we have to ask the business tough questions about how long this server is supposed to last.

If the business wants to deploy a server and then never touch it again for the life of the application, we can totally do that – but we have to know that going in, and it affects the kind of server we buy.

Step 3: map your feature and lifespan list to server strengths.

Do your features need fast local storage? If you decided to use local TempDB or Buffer Pool Extensions, you’ve got a decision to make. PCI Express drives like Fusion-IO and Intel 910s produce smokin’ fast results, but you’ll need to have enough fast PCI Express slots available for those drives. If you’d rather go with 2.5″ drives like the Dell PowerEdge R720 I tested recently, you’ll want enough local drive bays, plus possibly 2 RAID controllers for maximum bandwidth.

Do you have fast shared storage? It’s easy to plug any server into a SAN with just one or two connections, but if you want to step up to more bandwidth, things change. You’ll need 4 or more Host Bus Adapters (HBAs) to saturate a dozen cores or more, and that means lots of free PCI Express slots.

Do you need lots of network speed for virtualization? The latest round of hypervisors have all kinds of cool storage migration and replication features built in, but they do their magic over the network. You’re going to need a couple of 10Gb ports built in.

Step 4: Map up your strengths to server options.

The server market is changing constantly. What would have been unthinkable just a couple of years ago – like running a large data warehouse on less than $20k of solid state drives – is suddenly not just possible, but commonplace.

At the same time, I see customers running with scissors, like trying to virtualize multi-terabyte data warehouses with no recognition of the storage throughput required, or putting all of their SQL Servers on virtual hosts by themselves.

We need to talk.

We need to talk before your next server decision. Dell and Microsoft have set up a one-hour free Twitter chat focused on picking the right hardware. On September 25th at noon Central time, I’m working with them to talk about your server options, virtualization, solid state, and the future of the server market.

It doesn’t even cost you anything! Dell and Microsoft are sponsoring the whole thing, including paying me for my time. (I have to disclose that I’m getting paid to blog and tweet this stuff, but rest assured that all advice given during the chat and here on the post is 100% good old honest Brent.)

Register now.


What Does the #SQLPASS Board of Directors Do?

#SQLPass, SQL Server
2 Comments

The PASS Board of Directors election is coming up, so I sat down with Allen Kinsel (Blog@AllenKinsel) to get some insight. Allen knows first-hand.

Brent: The PASS Board of Directors election is coming. What exactly do Board members do?

allen-kinselAllen: Board Members set the direction and future vision for the organization. In a more perfect world they might solely be responsible for the strategic direction of the organization much as a typical corporate board of directors is but, because of the unique nature of the organization if a particular director has a passion for how a certain area of PASS should be different they can become quite tactical and put in the actual work to accomplish their goals.

Is it a full time job? How much commitment is involved?

Since it’s an unpaid position, thankfully it is not a full time job. The commitment level is what each director makes of it. If a director has a real passion for something and wants to get it done, they can invest literally as much time as they have to give In order to further their agenda. Otherwise the commitments are typically a few hours a week on average.

How many people are on the Board, and what kinds of backgrounds do they come from?

There are 14 members of the board though only 6 are directly elected by the membership. There are 4 additional board members placed from the founding partners (CA/Microsoft) and an additional 4 on the executive that are elected by the board every other year. The backgrounds of board members change after every election cycle but, typically about the only thing they all have in common is a love of SQL Server. Otherwise board members come from all backgrounds: technical, management, DBA’s, developers, Full time employees, consultants etc…

You’ve been on the Board – what was your favorite part?

My favorite part was certainly my final year of my term where I was able to make significant changes to the way PASS supports chapters and their leaders. Laying out a vision for enabling chapters to have a toolset that rivaled the tools we currently give SQL Saturday leaders and then executing on that vision and seeing how much easier it made new chapter leaders jobs was quite rewarding. I believe that given the support and another year the tools would have fully delivered their initial promise of being everything chapter leaders needed to run a chapter efficiently.

What do you think makes a good Board member?

Many things can add up to make a good Board member but if I had to put one thing on the list, it would be passion. For a person to be truly successful and get things done on the board they need passion. Passion fuels all the other needed aspects of the job. If I could add a second thing to that list it would be experience. As with all things, experience matters. Since experience on a board level is not the easiest thing to find on a resume, the first year serving for most board members can be quite daunting while attempting to find their way.

If you’re a community member looking at a ballot, how do you pick names? Most readers aren’t lucky enough to know people on the ballot personally.

If it is feasible voters should educate themselves on which candidates share their ideals through http://sqlpass.org/elections.aspx prior to voting. If that’s not feasible I would suggest a second good option is relying on the nominations committee’s vetting process to guide how your cast votes. Prior to being put on the ballot the candidates are vetted by a community led group (the nominations committee). Based on their rankings the candidates are listed on the ballot in the order of who they believe will be best for the position.

If somebody wanted to run for the Board a few years from now, what would you recommend they do to start building experience for it?

I’d recommend that they volunteer, get involved and participate in the #sqlfamily any way that they can. In order to truly understand the needs of the community you have to have the pulse of the community and a very effective way to do that is through participation.


IOPS Are A Scam

SQL Server
50 Comments

Storage vendors brag about the IOPS that their hardware can provide. Cloud providers have offered guaranteed IOPS for a while now. It seems that no matter where we turn, we can’t get away from IOPS.

What Are You Measuring?

When someone says IOPS, what are they referring to? IOPS is an acronym for Input/Output Operations Per Second. It’s a measure of how many physical read/write operations a device can perform in one second.

IOPS are relied upon as an arbiter of storage performance. After all, if something has 7,000 IOPS, it’s gotta be faster than something with only 300 IOPS, right?

The answer, as it turns out, is a resounding “maybe.”

Most storage vendors perform their IOPS measurements using a 4k block size, which is irrelevant for SQL Server workloads; remember that SQL Server reads data 64k at a time (mostly). Are you slowly getting the feeling that the shiny thing you bought is a piece of wood covered in aluminum foil?

Those 50,000 IOPS SSDs are really only going to give you 3,125 64KiB IOPS. And that 7,000 IOPS number that Amazon promised you? That’s in 16KiB IOPS. When you scale those numbers to 64KiB IOPS it works out to 1,750 64KiB IOPS for SQL Server RDS.

Latency as illustrated by ping

Latency vs IOPS

What about latency? Where does that fit in?

Latency is a measure of the duration between issuing a request and receiving a response. If you’ve ever played Counter-Strike, or just run ping, you know about latency. Latency is what we blame when we have unpredictable response times, can’t get to google, or when I can’t manage to get a headshot because I’m terrible at shooters.

Why does latency matter for disks?

It takes time to spin a disk platter and it takes time to move the read/write head of a disk into position. This introduces latency into rotational hard drives. Rotational HDDs have great sequential read/write numbers, but terrible random read/write numbers for the simple reason that the laws of physics get in the way.

Even SSDs have latency, though. Within an SSD, a controller is responsible for a finite number of chips. Some SSDs have multiple controllers, some have only one. Either way, a controller can only pull data off of the device so fast. As requests queue up, latency can be introduced.

On busy systems, the PCI-Express bus can even become a bottleneck. The PCI-E bus is shared among I/O controllers, network controllers, and other expansion cards. If several of those devices are in use at the same time, it’s possible to see latency just from access to the PCI-E bus.

What could trigger PCI-E bottlenecks? A pair of high end PCI-E SSDs (TempDB) can theoretically produce more data than the PCI-E bus can transfer. When you use both PCI-E SSDs and Fibre Channel HBAs, it’s easy to run into situations that can introduce random latency into PCI-E performance.

What About Throughput?

Throughput is often measured as IOPS * operation size in bytes. So when you see that a disk is able to perform X IOPS or Y MB/s, you know what that number means – it’s a measure of capability, but not necessarily timeliness. You could get 4,000 MB/s delivered after a 500 millisecond delay.

Although throughput is a good indication of what you can actually expect from a disk under perfect lab test conditions, it’s still no good for measuring performance.

Amazon’s SQL Server RDS promise of 7,000 IOPS sounds great until you put it into perspective. 7,000 IOPS * 16KiB = 112,000 KiB per second – that’s roughly 100MBps. Or, as you or I might call it, 1 gigabit ethernet.

What Does Good Storage Look Like?

Measuring storage performance is tricky. IOPS and throughput are a measurement of activity, but there’s no measure of timeliness involved. Latency is a measure of timeliness, but it’s devoid of speed.

Combining IOPS, throughput, and latency numbers is a step in the right direction. It lets us combine activity (IOPS), throughput (MB/s), and performance (latency) to examine system performance. 

Predictable latency is incredibly important for disk drives. If we have no idea how the disks will perform, we can’t predict application performance and have acceptable SLAs.

In their Systematic Look at EC2 I/O, Scalyr demonstrate that drive latency varies widely in EC2. While these numbers will vary across storage providers, keep in mind that latency is a very real thing and it can cause problems for shared storage and dedicated disks alike.

What Can We Do About IOPS and Latency?

The first step is to make sure we know what the numbers mean. Don’t hesitate to convert the vendor’s numbers into something relevant for your scenario. It’s easy enough to turn 4k IOPS into 64k IOPS or to convert IOPS into MB/s measurements. Once we’ve converted to an understandable metric, we can verify performance using SQLIO and compare the advertised numbers with real world numbers.

But to get the most out of our hardware, we need to make sure that we’re following best practices for SQL Server set up. Once we know that SQL Server is set up well, it’s also important to consider adding memory, carefully tuning indexes, and avoiding query anti-patterns.

Even though we can’t make storage faster, we can make storage do less work. In the end, making the storage do less gets the same results as making the storage faster.


Excuses for Slow Databases That Don’t Hold Up

SQL Server
8 Comments

You’re making excuses.

The database application is slow, and you’re throwing something under the bus, but we’ve got bad news. Changing it probably isn’t going to make your server faster. Here’s some of our favorite excuses.

kendra-little-215

Kendra SAYS, “Your Problem Isn’t GUIDs.”

Unique identifiers may or may not be globally unique, but they are one thing: the universal scapegoat for people who aren’t really sure what’s causing their performance problems.

I’ve met a lot of GUID blamers. I’ve had people introduce myself to me and immediately say, “My application is soooo terrible. There are GUIDs everywhere!” 

I’ve got news: GUIDs aren’t evil, and using them isn’t a sign of pure incompetence. The same thing is true of natural keys— using them doesn’t necessarily mean your database is going to perform terribly. If your application is slow, then yeah, you should consider schema design and key choices as part of the landscape, but being dogmatic about “good” and “bad” types isn’t going to help you figure out what the most effective changes are to improve your performance.

I’d just love to get back the three days of my life I once spent deploying a key change to “get rid of the problem GUIDs” in a schema. Especially since afterwards performance wasn’t noticeably any different.

Brent-Ozar-243

Brent SAYS, “Your Problem Isn’t the SAN.”

You’ve been measuring Perfmon metrics like Average Disk Queue Length and Disk Seconds/Read, and you’ve been comparing the results to the SQLCAT list of OLTP problems. You keep waving the results at the SAN admin, and he keeps shrugging, saying that everything looks okay on his end.

That’s because it probably is.

You’ve gotta stop thinking that your SAN is going to hand-deliver every byte to you within a millisecond of the request. It’s not gonna happen. It takes millions of dollars to build a fast SAN, but it takes one heck of a lot less to build a server with a buttload of memory. If you’re doing online processing, the answer isn’t faster disks, because even the fastest drives can’t hold a candle to memory. If you can’t cache it in memory, users are going to call it slow. Full stop.

kendra-little-215

Kendra SAYS, “Stop saying nobody listens to you”

When you say: “Nobody listens to me!” People hear something else. They hear you say: “I’m not a leader.” They hear you say: “I don’t know how to communicate.”

The more you say this, the less and less people want to listen to you. And the less you expect anyone to listen, either. 

You can fix this. Take a step back. List out three recent changes that you’ve recommended that you haven’t been able to get traction on. For each of your examples, consider:

1) Is communication the problem? If you’re relying on emails, that’s usually not going to get the job done. Develop a strategy to communicate more effectively: and yes, this means talking to people face-to-face at times and listening to what others have to say, too.

2) Do you lack technical credibility? This is an area where training can help. Students come to our classes to ask questions about how to effectively approach real world problems.

3) Do you need an independent opinion? Sometimes different teams get into fingerpointing standoffs, and nobody’s sure where they stand with anyone else. We get brought in as consultants to take an independent look at bottlenecks, defuse any blame fires, and set people on a path to solve their pain points as a team.

Leadership isn’t something that you’re entitled to because of your job title. Leadership is something we each must earn– and we’ve gotta work to keep on earning it. You can become influential and you can lead people! You’ve just got to build your skills to do it.

Brent-Ozar-243

Brent SAYS, “Your Problem Isn’t the DEVELOPERS, EITHER.”

Brent says: I know, it’s trendy to complain about how the developers do stupid stuff. I make jokes about this all the time on DBAreactions.

Thing is, though, they’re shipping stuff.

Useful stuff. Valuable stuff. Stuff the end users actually want. You think they’re being sloppy because they don’t know any better, but the truth is that they don’t get unlimited time to build everything perfectly. Your management wants to ship features out the door and keep moving forward.

When was the last time you, the DBA, shipped something that end users asked for? Did you build it absolutely flawlessly, or did you duct tape it together to get it out the door?

I bet you could take the diamond-in-the-rough from the developers, put some work into tuning the server and the indexes, and make it fly. And if you can’t, if you’re only willing to work with flawless code, I’ve got bad news for you. I’ve worked with those kinds of developers, like the ones at StackOverflow.com, and they don’t need you. (In fact, Stack doesn’t have a full time DBA, and they’re one of the 200 biggest sites on the web. Think about that for a second.)


Rebuild or Reorganize: SQL Server Index Maintenance

Defragmenting compacts as well as changes physical order
Index maintenance compacts a structure *and* changes physical order– both can be important!

Editors Note: this post was updated in June 2014 to link to an online index rebuild bug that can cause corruption.

Once up on a time, there was a database server with 500GB of data and a heavy read workload of dynamic queries. Data was updated frequently throughout the day and index tuning was a serious challenge. At the best of times, performance was dicey.

Then things went bad

Application performance plummeted. Lots of code changes had been released recently, data was growing rapidly, and the hardware wasn’t the absolute freshest. There was no single smoking gun– there were 20 smoking guns!

A team was formed of developers and IT staff to tackle the performance issue. Early in the process they reviewed maintenance on the database server. Someone asked about index fragmentation. The DBA manager said, “Of course we’re handling fragmentation!” But a few queries were run and some large, seriously fragmented indexes were discovered in production.

The DBA explained that fragmentation wasn’t the problem. She didn’t have automated index maintenance set up, but she periodically manually defragmented indexes that were more than 75% fragmented.

Bad, meet ugly

At this point the whole performance team flipped out. Trust disappeared. Managers squirmed. More managers were called in. The DBA tried to change the subject, but it was just too late. More than a week was wasted over Fragmentation-Gate. It was a huge, embarrassing distraction, and it solved nothing.

Here’s the deal– the DBA was right. Fragmentation wasn’t the root cause of the performance problem. The DBA was a super smart person and very talented at performance tuning, too! (And no, I’m not secretly talking about myself here– this is not the “royal she”.) But she made a strategic miscalculation: she should have set up occasional automated index maintenance to align with her team’s normal practices and standards.

Why you need automated index maintenance

When performance gets bad, one of the very first things people look at is whether systems involved are configured according to best practices. If you’re not following a best practice, you need to have a really good reason for it.

Regular index maintenance still has a lot of merit: even in Shangri-La, where your data all fits into memory and your storage system is a rockstar with random IO, index maintenance can help make sure that you don’t have a lot of empty space wasting loads of memory.

It’s still a good idea to automate index maintenance. Absolutely don’t go too crazy with it– monitor the runtime and IO use and run it only at low volume times to make sure it helps more than it hurts. Be careful, but don’t skip it.

How much downtime can you spare?

Before you implement index maintenance, find out how much time tables can be offline in each of your databases. Then, figure out what operations you want to use.

To Rebuild or Reorganize: That is the Question

First off: ‘Reorganize’ and ‘Rebuild’ are two different operations that each reduce fragmentation in an index. They work differently toward the same end. You don’t need to run both against the same index. (I sometimes find that people are doing both against every index in a maintenance plan. That’s just double the work and NOT double the fun.)

Rebuild: An index ‘rebuild’ creates a fresh, sparkling new structure for the index. If the index is disabled, rebuilding brings it back to life. You can apply a new fillfactor when you rebuild an index. If you cancel a rebuild operation midway, it must roll back (and if it’s being done offline, that can take a while).

Reorganize: This option is more lightweight. It runs through the leaf level of the index, and as it goes it fixes physical ordering of pages and also compacts pages to apply any previously set fillfactor settings. This operation is always online, and if you cancel it then it’s able to just stop where it is (it doesn’t have a giant operation to rollback).

Factors to consider:

  • Standard Edition rebuilds ain’t awesome. If you’ve got SQL Server Standard Edition, index rebuilds are always an offline operation. Bad news: they’re also single-threaded. (Ouch!)
  • Enterprise Edition rebuilds have gotchas. With SQL Server Enterprise Edition, you can specify an online rebuild — unless the index contains large object types. (This restriction is relaxed somewhat in SQL Server 2012). You can also use parallelism when creating or rebuilding an index— and that can save a whole lot of time. Even with an online rebuild, a schema modification lock (SCH-M) is needed at the time the fresh new index is put in place. This is an exclusive lock and in highly concurrent environments, getting it can be a big (blocking) problem.
  • There’s a bug in SQL Server 2012 Enterprise Edition Rebuilds that can cause corruption. If you’re running SQL Server 2012 SP1 – SP2, parallel online index rebuilds can cause corruption. Read about your options here.
  • Rebuilding partitioned tables is especially tricky. You can rebuild an entire partitioned index online– but nobody really wants to do that because they’re huge! The whole idea behind horizontal partitioning is to break data into more manageable chunks, right? Unfortunately, partition level rebuilds are offline until SQL Server 2014.
  • Reorganizing can be pretty cool. ‘Reorganizing’ an index is always an online op, no matter what edition of SQL Server you’re using. It doesn’t require a schema mod lock, so it can provide better concurrency. Reorganizing only defragments the leaf level of the index. On large tables it can take longer than a rebuild would take, too. But as I said above, it’s nice that you can reorganize for a while and then stop without facing a massive rollback.

SQL SERVER 2014: WAIT_AT_LOW_PRIORITY, MAX_DURATION, AND ABORT_AFTER_WAIT

I’m really excited about new index rebuild options that are shipping in SQL Server 2014. Check *this* out:

So we’ve got new tools for those concurrency problems I was talking about with online rebuilds. Now, we can say how long we’re willing to wait to get that schema modification lock (in minutes), and if we have to keep waiting what should happen. (Options: kill those who are blocking us, kill ourself, or do nothing.) Obviously there are some situations where just killing the blockers could be a terrible problem, but I’m interested to experiment with this.

You Didn’t Answer the Question: Do I Use Rebuild or Reorganize?

Yeah, I totally dodged that question, didn’t I?

If you have a regularly scheduled downtime every weekend, you’re probably fine with straight up index rebuilds, even if you have Standard Edition. Single threaded offline index maintenance may not be the hottest thing in the world, but hey, if you’ve got time for it then embrace the simplicity.

If you have Enterprise Edition, embrace parallel index rebuilds– and use the ONLINE option for indexes that allow it if people need to access the database during your maintenance window.

If you have database mirroring or AlwaysOn Availability Groups, tread with caution– particularly with rebuilds. It’s easy to generate a ton of IO with index maintenance, and it could mean putting your secondaries or mirror so far behind that they can’t catch up.

Maintenance plans or custom scripts?

You can go the easy way and use SQL Server Maintenance Plans, but unfortunately they’re very simplistic: you can only say “rebuild all the indexes” or “reorganize all the indexes”. You cannot say, “If the index is 45% or more fragmented, rebuild it– otherwise do nothing.” If you don’t spend much time with SQL Server and you’ve got downtime available every weekend, this can be a decent option.

If you need to minimize downtime, custom index maintenance scripts are the way to go. Our favorite: Ola Hallengren’s maintenance scripts. These are super flexible, well documented, and … free! The scripts have all sorts of cool options like time boxing and statistics maintenance.

Some tips for using Ola Hallengren’s index maintenance scripts:

  1. Download and configure them on a test instance first. There’s a lot of options on parameters, and you’ll need to play with them.
  2. Get used the ‘cmdexec’ job step types. When you install the scripts you’ll see that the SQL Server Agent jobs run index maintenance using a call to sqlcmd.exe in an MSDOS style step. That’s by design!
  3. Use the examples on the website. If you scroll to the bottom of the index maintenance page you’ll find all sorts of examples showing how to get the procedure to do different useful things.

Find out when maintenance fails

Don’t forget to make sure that your maintenance jobs are successfully logging their progress. Set up Database Mail and operators so jobs let you know if they fail.

Tell your boss you did a good thing

Finally, write up a quick summary of what you did, why you chose custom scripts or maintenance plans, and why. Share it with your manager and explain that you’ve set up automated index maintenance as a proactive step.

Having your manager know you’re taking the time to follow best practices certainly won’t hurt– and one of these days, it just might help you out. (Even if it’s just by keeping everyone from following a red herring.)


Five SQL Server Settings to Change

SQL Server ships with sane defaults, right? Well, sort of. SQL Server ships with pretty sane defaults for a single CPU socket server or for a development work station. Honestly, the defaults are good enough for many things, but there are a few gotchas. Changing these settings is quick, relatively painless, and can result in all around stability and happiness.

MAXDOP... 9?!
MAXDOP… 9?!

Maximum Degree of Parallelism

By default, SQL Server will use all available CPUs during query execution. While this is great for large queries, it can cause performance problems and limit concurrency. A better approach is to limit parallelism to the number of physical cores in a single CPU socket.

If you’re saying “What?” right now, don’t feel bad. Basically – on a SQL Server with two CPU sockets and a 4 core CPU with hyperthreading off, the maximum degree of parallelism option should be set to 4.

Don’t believe me? Check out Recommendations and guidelines for the “max degree of parallelism” configuration option in SQL Server.

Cost Threshold for Parallelism

Speaking of parallelism – what about that cost threshold for parallelism setting? The default is set to 5, is that a Good Number®? Not so much.

The optimizer uses that cost threshold to figure out when it should start evaluating plans that can use multiple threads. Although there’s no right or wrong number, 5 is a really low setting. It’s appropriate for purely OLTP applications, but as soon as you add a modicum of complexity ka-boom!

I recommend starting with this setting at 50 or so and tuning up or down as appropriate. Make sure you measure for the critical queries in your application, of course.

Instant File Initialization

Technically this is a Windows permission, but whatever. By granting the “Perform volume maintenance tasks” permission to the SQL Server process, we give SQL Server a boost when it comes time to grow out data files.

The default behavior in Windows write a bunch of zeros whenever a user asks for space. If I create a 500MB file, Windows will write 500MB of zeros to disk to properly initialize the file.

By giving the SQL Server process these extra permissions, SQL Server can use a different API when requesting space for data files. These permissions tell Windows to mark the space as used and immediately hand it back to the calling program. In short – you can grow data files faster (which includes TempDB on system start up).

Backup Compression

Free compression! If you’re using SQL Server starting with SQL Server 2008R2, you can flip a check box and get yourself some backup compression. This is a no brainer, really – backups are smaller, they take less time, and the restores even take less time. What’s not to love?

The best place to observe a problem is from far away.

The Remote DAC

No, I don’t mean a DACPAC, I mean the dedicated administrator connection. When you connect through the DAC, SQL Server provides a dedicated connection, CPU scheduler, and memory; all of which make it easier to troubleshoot when SQL Server’s gone completely crazy. By default you have to be on the SQL Server’s desktop either physically at the console or else remotely over RDP. When I’ve got a runaway SQL Server, I know that I don’t want to wait for a sluggish GUI to respond to my commands.

Enter the remote dedicated administrator connection.

By enabling the remote DAC, a DBA can make use of the dedicated administrative connection from any computer that’s allowed to connect to the SQL Server – from your workstation, bastion server, or even your home PC over the VPN. It doesn’t matter, as long as you’ve got rights. Remote troubleshooting systems that are stuck at 100% CPU utilization is much easier when you’ve got dedicated CPU resources and memory at your disposal.

What are you waiting for?

Only one of these changes (Instant File Initialization) requires a restart, so get out there and start switching things up. (Your mileage may vary.)

Interested In Learning More?

In our classes, we cover the SQL Server settings you should watch and the tools that will identify even more settings to change. Read more about our training!


How to Get Your Manager to Pay for Training

SQL Server, Videos
5 Comments

When us geeks want something, we just point at it, look at our manager and say, “I want this. Buy it for me.”

Oddly, it doesn’t seem to work.

To get what we want, we have to think like a manager.

Step 1. Define a user’s Pain Point.

You need someone else on your side – not another geek, but a business person who can stand up for you and say, “There’s a problem causing us pain, the business needs a solution.”

Here’s some sample pains – and notice how they have both the person AND the pain point:

  • The users want the app to go faster.
  • Our developers need to implement more advanced features that require more from the database.
  • The CFO is tired of us throwing hardware at the problem.
  • The users want more uptime and less maintenance windows.

If you’re not sure whether or not training will solve your pain point, ask the trainer. For example, if you want to know if our performance training is going to fix your performance issues, email us at Help@BrentOzar.com and describe the issues you’re facing. We’ll tell you the fastest way to get those problems solved, and often, it’s not the training classes. (I don’t want someone eagerly showing up at our classes only to find out they’re in the wrong one.)

Step 2. List the free solutions you’ve already tried.

Your manager isn’t dumb: she solves problems with Google just like you. If you bring any pain point to her office, she’s going to turn to her computer, put it into Google, and ask you if you’ve tried those methods.

You need to head her off at the pass by listing what you’ve already tried:

  • Watching free training videos about the problem
  • Attending local user groups
  • Posting messages on DBA.StackExchange.com and SQLServerCentral.com

And here’s my favorite phrase to seal the deal: “I’ve tried all the free easy buttons, and we’ve seen some relief, but now we need to take it to the next level.” That makes it clear that you haven’t been sitting idle all day – you’ve actually done small things and gotten small return – but now you need resources.

Step 3: Give your manager 3 options for pain relief.

When you shop for a new laptop or a new camera, you comparison-shop. You look at all the options out there, and you figure out which one is best for your needs.

Your manager wants to do the same thing, but she wants to have the choices laid out clearly. She wants to know that you’ve done your homework, because she knows there’s more than one option.

Here’s how dot-com sites pull it off – they give you three options from their own product offerings so that you feel like you’re making a decision, even though there’s only one choice – them! Here’s an example from WPengine.com, a hosting company:

WPengine pricing options

It’s kind of small, medium, and large. It’s the Goldilocks approach. It lets your manager quickly see the differences between the options, and pick the one that suits your needs.

Here’s how you can present options to your manager:

Pricing comparison for training - download the Excel version
Pricing comparison for training – download the Excel version

YOU get to pick the options, and you should only pick options on there that you truly believe will get the problem solved. (After all, you don’t want your manager to pick something you don’t actually want.)

Make sure the choices really are different, like a small/medium/large. Don’t give them 3 options that cost the same thing, because those aren’t really choices – it’s your job to find the best option in each price category before you show the options to management.

Have your research ready for each choice – I like giving a “more info” link that goes to the product’s page. After all, your main goal is for your manager to forward this up the chain as evidence that you made a good decision, and somebody along the way is going to want to click on a link.

Download the spreadsheet now and casually walk into your manager’s office. Your job isn’t going to get any cooler by itself. There might be some leftover budget money this year – get your hands on it!


Common SQL Server Clustering, AlwaysOn, and High Availability Answers

Our live webcast topic this week was Q&A – you could bring any HA/DR questions, and we could avoid your answers. Just kidding. Here’s the webcast – we apologize for the audio, WebEx is still getting their act together. It cleans up after the first couple of minutes.

https://www.youtube.com/watch?v=G1URY5M09ic

And here’s the questions we couldn’t get to during the webcast:

SQL Server Licensing Questions

Q: If using virtual machines and clustering / failing over at that level (not sql server) is there any reason that SQL Server Standard Edition won’t work? Someone once told us in a sql class that Enterprise Edition was necessary for this.

Answer from Brent: don’t you just love those “someone once told us” things? You’ll want to get them to tell you why. Standard Edition works fine in virtual machines. It may not be cost-effective once you start stacking multiple virtual machines on the same host, though, because you have to pay for Standard Edition for every guest.

Q: Hi, with mirroring being deprecated and AlwaysOn AG only available with Enterprise Edition – what are our HA options going to be with Standard Edition in the future? Any ideas if AlwaysOn synchronous will make it into Standard?

Answer from Jeremiah: You have a few HA choices with SQL Server 2012 Standard Edition and beyond. Even though mirroring is deprecated, you could feasibly use mirroring in the hope that something new will come out. Obviously, this isn’t a viable option. The other HA option is to use clustering. SQL Server Standard Edition supports 2 node clusters, so you can always use it for HA.

How to Manage AlwaysOn Availability Groups

Q: Did you experience or know “split brain scenario” in AlwaysOn Availability Groups that when secondary node is up to take over primary role, the transaction becomes inconsistent? And how to avoid it?

Answer from Brent: Ooo, there’s several questions in here. First, there’s the concept of split brained clusters – when two different database servers both believe they’re the master. Windows Server Failover Clustering (WSFC) has a lot of plumbing built in to avoid that scenario. When you design a cluster, you set up quorum voting so that the nodes work together to elect a leader. In theory, you can’t run into a split brain scenario automatically – but, you can most definitely run into it manually if you go behind the scenes and change cluster settings. The simple answer here: education. Learn about how the quorum process works, learn the right quorum settings for the number of servers you have, and prepare for disaster ahead of time. Know how you’ll need to react when a server (or an entire data center) goes down. Plan and script those tasks, and then you can better avoid split brain scenarios.

Q: Can you recommend any custom policies for monitoring AlwaysOn?  Or do the system policies provide thorough coverage?  Thank you!

Answer from Brent: I was a pretty hard-core early adopter of AlwaysOn Availability Groups because I had some clients who needed it right away. In that situation, you have to go to production with the monitoring you have, not the monitoring you want. The built-in stuff just wasn’t anywhere near enough, so most of my early adopters ended up rolling their own. StackOverflow’s about to share some really fun stuff there, so I’d keep an eye on Blog.ServerFault.com. You should also evaluate SQL Sentry 7.5’s new AlwaysOn monitoring – it’s the only production monitoring I’m aware of, although I know all the other developers are coming out with updates to their tools for monitoring too.

Q: Is it wise to have primary availability groups in one server of the nodes and have primary groups on another of the servers that form the cluster. Or is it better to have all primary groups on server 1 and secondary on server 2?

Answer from Brent: If you split the primaries onto two different nodes, then you can do some load balancing.

Q: Would you consider Always-ON AG Read-Only replicas as a method to offload or load balance reporting? Looks like the Read Intent option acts like a load balancer for reading off of those DBs, right?

Answer from Brent: Offload yes, load balance no. The read intent options give you the ability to push read-only queries to a different replica, but there’s no load balancing. Your clients just hit the first server in the list. If you need true load balancing, you’ll want to put all of the read-only replicas behind a real load balancing appliance.

Windows Clustering Setup and Management

Q: Where can I find a good list of cluster hotfixes SQL 2008 R2 and perhaps the OS as well? 

Jes here. You can go to the Update Center for Microsoft SQL Server to find the latest CU and hotfixes. Check the Support pages for Windows Server 2008R2. Updates aren’t released as cluster-specific. This is why it’s really important to have a test or QA environment that is also set up as a cluster, so you know if the cluster services are affected at all.

Q: What is the recommended order/procedure when you have to do Windows updates to servers in a cluster?

Answer from Kendra: Microsoft knew you were gonna ask this! Check out their “SQL Server failover cluster rolling patch and service pack process” KB here. But do yourself a favor and always deploy patches to a non-production test cluster first and let them burn in a bit.

Q: From your previous answers, it sounded like you don’t recommend use Windows 2008 R2 for AlwaysOn. Can you elaborate bit more on why Windows 2012 is better suited for this? I need more persuasive power to talk the rest of folks of my company to use it.

Answer from Brent: Sure, check out the AlwaysOn Availability Groups Lessons Learned video at the bottom of that page.

Q: Would you have a single DTC group or multiple groups configured for a 4 instance cluster?

Answer from Kendra: There’s no shortcut here: you have to decide on an instance by instance basis. For each instance you gotta determine how much it uses distributed transactions, and how impacted it might be if DTC were to temporarily be offline. Review Cindy Gross’ information on DTC to find out pros and cons of different approaches to configuring DTC.

SQL Server Clustering with VMware and Hyper-V

Q: Is VMWare HA a good alternative to use instead of a Microsoft Cluster?

Answer from Jeremiah: The HA choice comes down to where you want your HA to be managed. VMware HA pushes the high availability question out of the SQL Server realm and into the VMware infrastructure. More than anything else, this is a business decision – just be sure you’re happy with the decision of which team is managing your uptime.

Q: When using a virtualized active/passive 2008R2 cluster with underlying iSCSI storage can the nodes by on different hosts or is FoE needed to have nodes on different hosts? 

Answer from Brent: Check out VMware’s knowledge base article on Microsoft cluster support. It lays out your options for iSCSI, FC, FCoE, and more, and separates them by shared-disk clustering versus non-shared-disk (AlwaysOn Availability Groups).

Q: Any thoughts on implementing AlwaysOn in conjunction with a virtual SQL environment using VMWare HA/ Site Recovery Manager (SRM)?

Answer from Kendra:  With this level of complexity, when things get tricky it’s incredi-hard to sort out. You gotta have a rockstar team with great processes and communication skills to handle problems as they arise– and you are going to hit problems.

Even if you have the rockstar team, you want to first ask if there’s a simpler way to meet your requirements with a less risky cocktail of technologies. If you rush into what you describe, you’ll find that your high availability solution becomes your primary cause of downtime.

Shared Storage for Clusters

Q: Was reading a great article from Brent on SQLIO. How does this work on a SQL Cluster?

Answer from Kendra: You run SQLIO against the storage (not the SQL Server instance) so it works the exact same way.

Q: After Setting up The Cluster and adding the various CLUSTER DATA Drives how can I add additional Drives after gaining new internal storage?

Answer from Kendra: Before you touch production, make sure you’ve got a lab environment. If you don’t, check out the link above on how to build one.  The exact steps to do this are going to vary depending on your version of Windows, your version of SQL Server, and exactly what storage you’re talking about.

For new shared storage on Sever 2008 or later, the basic process is presenting the storage to all of the nodes, bringing the drive online on one node, creating a volume, adding the disk in the failover cluster, and then adjusting dependencies in the cluster as needed. (Dependencies can be adjusted online in SQL Server 2008 and later).

If you have new non-shared storage that you want to use under tempdb (such as SSDs), you’ve got to make sure that every node in the cluster has the drives for tempdb online / volumed/ formatted/ and configured identically, and then you can move tempdb files over to it. You will need to restart SQL Sever to make modified tempdb files recognize the new paths.

Sharding and Mirroring Questions

Q: I have a peer to peer replication with 3 nodes (all bidirectional). Very beneficial but a big pain to maintain. Is that what the industry feels?

Answer from Jeremiah: SQL Server peer-to-peer replication solves a very specific need – the ability to have multiple active SQL Servers where writes can occur and where you can have near real-time updates to the other servers. While peer-to-peer replication meets that need, it has a relatively heavy price tag in terms of DBA expertise, support, and licensing costs. Even experienced teams want to have multiple DBAs on staff to deal with on call rotations and, let’s face it, while peer-to-peer replication hasn’t been deprecated, it’s a difficult feature to work with.

Q: I’ve implemented db sharding on Oracle in several environments. Is there an applicable tech in SQL Server?

Answer from Jeremiah: Sharding is just a buzzword for horizontal partitioning. In a sharded database, either the application or a load balancing router/reverse proxy is aware of the sharding scheme and sends reads and writes to the appropriate server. This can be accomplished with SQL Server, Oracle, MySQL, or even Access. There are no technologies from Microsoft and I’d be wary of anyone attempting to sell something that Just Works® – database sharding is time consuming, requires deep domain knowledge, and adds additional database overhead.

Q: Currently using SQL 2008 Mirroring.  Planning a move to 2012.  Your thoughts about jumping 2012 and going straight to 2014 Always On technologies? 

Jes here. There were no major changes to Database Mirroring in SQL Server 2012, and I don’t foresee any coming in 2014. Eventually – we don’t have a specific version yet – Mirroring will be deprecated.

More Free AlwaysOn and Clustering Training Resources

And if your business needs help deciding which one is right for you, check out our SQL Critical Care® methodology. We quickly get to the root cause of your availability and performance pains, and we train you how to fix it. Learn more about our SQL Critical Care® now.


Query Plans: Memory Grants and High Row Estimates

SQL Server needs to have a reasonably correct estimate of how many rows your query is going to handle. If it doesn’t, things can go terribly, terribly wrong.

Most often, the problem is that SQL Server under estimates its work. In this case, the query optimizer thinks it has just a little bit of work to do, but in actuality it has much more. This results in “undersized” execution plans for the task– frequently a tiny little nested loop that’s run through over and over again while a larger join would do much better for the workload. This problem is often found in relation to the Ascending Key Problem and out of date statistics in SQL Server.

But sometimes we have the opposite problem: SQL Server thinks it has a LOT of work to do, but really it only a little bit.

This pattern creates a totally different set of issues and has a very different impact on the workload of your SQL Server.

A simple trick to inflate row estimates

I’ve run into problems with workloads where overestimates are happening several times over the years, each time with completely different root causes. Recently I’ve found a simple way to reproduce the phenomena in AdventureWorks that makes it easy to see some of the impacts of overestimating a query’s work.

Let’s start by looking at the execution plan for the query behind AdventureWorks2012‘s [HumanResources].[vEmployee] view. We’ll run this and get an actual execution plan as well as IO statistics.

Here’s the general shape of our plan. Just note that the bars connecting operators are narrow– SQL Server has pretty low (and accurate) estimates of how much data will be flowing through these pipes:
Plan 1

Now, this query is already a little troubled. It has a lot of joins, including outer joins. It shows an optimization timeout in the plan. The plan estimated cost is 1.1 and it estimates it’ll bring back 229 rows. In my test environment it takes 16 ms to run and does several thousand logical reads across the many tables it joins. This means the query optimizer didn’t consider every possible plan, but hey, our runtime was pretty darn good anyway.

Plan 1 Timeout

Now let’s cause some real trouble. We’re going to make only one type change to this query– we’re going to add functions to the joins. These functions mimic what a user might do if they were concerned about leading/trailing characters. This is going to do several things:

  • Force SQL Server to do an implicit conversion to the columns in order to apply the functions
  • Effectively apply the functions row-by-row to do the comparison at runtime
  • Together this makes it incredibly hard for it to properly estimate the number of rows that come out of the joins.

Here’s our revised query:

There have been a LOT of changes to the shape of this plan, as well as to the size of those pipes!

Plan 2

Instead of being able to use column or index statistics to properly estimate how many rows that come out of the joins, instead we end up with estimates that are sized as if every row might join with every row (a Cartesian product). That requires some heavy lifting!

Our second plan has an estimated cost of 645 trillion. SQL Server thinks it might return 4,598,570,000,000,000,000,000 rows (however many that is– I’m not sure how you even say that). The return data set is estimated as a HUGE amount of megabytes.

In my test environment it takes 122,046 ms to run (as compared to 16 ms) and does more than 4.8 million logical reads (as compared to several thousand). It chews up lots of CPU on three of my four virtual CPUs for the whole time it runs, even though it’s not parallel. Of course, it returns the same 290 rows of data at the end as the original query. (It just takes a LOT more work to do it!)

We can learn a lot from examining why this query has to use 7,600 times more CPU. And we can use this query to reproduce some pernicious problems that sometimes attack production environments.

Big queries need big memory reservations

Let’s compare some information from our two queries. We’re using SQL Server 2012 so we get some very rich information in our execution plans regarding our “Query Workspace Memory Grant”. This type of memory is used for query execution specifically. When SQL Server starts running a query it needs to figure out a minimum amount of memory that’s appropriate for all the sorts, spools, joins, and other things it may need to do in memory in the query. The more work it needs to do, the more of a query workspace memory it may need to ask for.

This memory is totally separate from the memory SQL Server uses to cache data in memory (the “buffer pool”) and the memory SQL Server uses to cache execution plans. In fact, this memory is “stolen” from the memory used for caching data pages. (Hey, it’s gotta come from somewhere, right?)

Our revised query (overly high estimates due to the functions in joins) is on the left. Our original query is on the right.

Memory Grant Comparison

That’s a big difference, right?

If you run a lot of big queries like this at the same time, those bigger query workspace memory grants mean that you may run low on the available amount of workspace memory for those types of queries. When this happens, new queries that come in may have to wait for a query workspace memory grant to run. This shows up as a RESOURCE_SEMAPHORE wait, which is shown here with Adam Machanic‘s nifty sp_whoisactive stored procedure.

sp_whoisactive - Resource Semaphore

When this waits start happening, queries experiencing it literally can’t get out of the gate. They need a size of memory grant that just isn’t available, and they’ve got to wait around until their minimum grant can be met. (That’s fair, right? What wants to start running if there’s not enough memory to manage the query operators they need?)

Aside: Curious if you’re experiencing this problem in production? Our sp_blitz® procedure helps detect if you’re experiencing this type of wait.

Big queries may tear up tempdb

Another thing we can see with this experiment is that some large-sized operators may be super-expensive, even on small row sets.

Exactly what made our runtime so bad? Sure we thought a ton of rows were possibly going to come out of those joins, but in actuality they didn’t. It turns out that the second query actually really DID have to do a lot more IO than the first query. Here’s our STATISTICS IO output:

(290 row(s) affected)
Table 'Worktable'. Scan count 583, logical reads 4864543, physical reads 0, read-ahead reads 0, lob logical reads 0, lob physical reads 0, lob read-ahead reads 0.
Table 'PhoneNumberType'. Scan count 1, logical reads 581, physical reads 0, read-ahead reads 0, lob logical reads 0, lob physical reads 0, lob read-ahead reads 0.
Table 'CountryRegion'. Scan count 1, logical reads 4, physical reads 0, read-ahead reads 0, lob logical reads 0, lob physical reads 0, lob read-ahead reads 0.
Table 'StateProvince'. Scan count 1, logical reads 4, physical reads 0, read-ahead reads 0, lob logical reads 0, lob physical reads 0, lob read-ahead reads 0.
Table 'Address'. Scan count 1, logical reads 216, physical reads 0, read-ahead reads 0, lob logical reads 0, lob physical reads 0, lob read-ahead reads 0.
Table 'BusinessEntityAddress'. Scan count 1, logical reads 46, physical reads 0, read-ahead reads 0, lob logical reads 0, lob physical reads 0, lob read-ahead reads 0.
Table 'Employee'. Scan count 1, logical reads 9, physical reads 0, read-ahead reads 0, lob logical reads 0, lob physical reads 0, lob read-ahead reads 0.
Table 'Person'. Scan count 1, logical reads 3820, physical reads 0, read-ahead reads 0, lob logical reads 0, lob physical reads 0, lob read-ahead reads 0.
Table 'PersonPhone'. Scan count 1, logical reads 122, physical reads 0, read-ahead reads 0, lob logical reads 0, lob physical reads 0, lob read-ahead reads 0.
Table 'EmailAddress'. Scan count 1, logical reads 186, physical reads 0, read-ahead reads 0, lob logical reads 0, lob physical reads 0, lob read-ahead reads 0.

Look at that first line. Why the heck did we have to do almost 5 million reads against ‘Worktable’? And what exactly is worktable?

Let’s go back into that plan again. Look at the spool operators– they are where all those big pipes start. First we’ll hover over the line coming out of the spool.

Plan 2 Spool View 1

These “spools” are worktables being built in memory (and tempdb) in SQL Server. Not only are there a high estimated number of rows coming out of these, but there’s a high actual amount of rows coming out of them as well.

If we look at the spool operator itself, we can see that each spool had to be accessed over and over again at runtime in our system to feed data back up into the nested loop join:

Plan 2 Spool View 2

Because SQL Server had to do a lot of heavy row-by-row comparisons and wasn’t sure exactly how many might feed out of each of them, it decided to build “spool” temporary tables behind the scenes. It loaded the the temp tables up in memory turn by turn and then had to go through a long, painful process of reading from them. It did this three times, in sequence.

You don’t have to have big data to have big query problems

The SQL Server optimizer is really clever, but often in production it gets into a bad situation. This can be caused by complex query patterns, poor data statistics, or TSQL anti-patterns.

This can be really tricky to identify, diagnose and fix in production if you’ve never seen it before. If you’re used to working with small databases, don’t worry– you can use techniques like I’ve outlined here to help you easily recreate in a small test environment what production might look like with big “beefy” queries running all at once.

Learn More in Our Execution Plan Training

Our How to Read Execution Plans Training explains how to get an execution plan, how to read the operators, and learn solutions to common query problems.


What is the CXPACKET Wait Type, and How Do You Reduce It?

SQL Server, Wait Stats
121 Comments

When you query sys.dm_os_wait_stats, or check your waits with sp_Blitz® or sp_BlitzFirst®, one of your biggest wait types is probably CXPACKET. Let’s talk about what’s really going on.

Our SQL Server Stand-In: a Class.

Who wants to help me scan the sales table?

Pretend that you’re a schoolteacher in a classroom with a couple dozen students. You’ve got a class project that you need to accomplish as quickly as possible. The project is to build a list of all of the distinct words in the book Moby Dick, along with the frequency of each word.

There’s three ways you could do it:

1. Hand the entire book to a single student and let them work on it until it’s done. This student is going to be miserable, and it’s going to take a heck of a long time for this project to finish. However, this leaves the rest of the students to hang out and have fun playing Words With Friends.

2. Divide the pages of the book out between all of the students. Tear the book into a bunch of stacks of pages, distribute that work, and let them start working simultaneously. As they turn in their work to you, they can each get freed up to do other stuff. You (the teacher) will combine their work together into one master list. Each student’s paperwork will include the word “whale”, for example, and you’ll need to add up all of those “whale” references on one master list.

3. Divide the pages between a group of students (but not all of them.) Instead of putting all 24 students to work on the same project, you might tear the book into 8 sections and assign that work to 8 of your students. The other 16 students would be free to veg out in case another assignment comes in.

How This Relates to SQL Server

You’ve probably already figured out that the work involved is a query. The teacher is the master thread running a query. The students are CPU cores. Microsoft SQL Server can break a single query out across multiple cores as long as the work can be parallelized. (Paul White explains what kinds of work isn’t parallelized.)

When you pass in a big query, SQL Server will consider parallelizing it across more cores – up to your Maximum Degree of Parallelism (MAXDOP).

Read that sentence again, because it’s really important. We’re going to come back to that.

The data warehouse server

The more students we get involved, the more work we have to do to coordinate their efforts and combine their results. The students, being rowdy goons, get frustrated when they get done with their work quickly and have to sit around waiting for other students to finish. This isn’t really a bottleneck per se – the students could go off and do other work – but they like to complain about how they had to wait around for the slow kids.

That complaining is CXPACKET – Class eXchange Packets. The class is turning in their packets, and complaining about the slow kids.

Just like kids complaining, CXPACKET by itself isn’t a problem. However, it’s an indication that something might be going wrong in this important sentence. Let’s read it again:

When you pass in a big query, SQL Server will consider parallelizing it across more cores – up to your Maximum Degree of Parallelism (MAXDOP).

How to Reduce CXPACKET by Setting MAXDOP

The default Maximum Degree of Parallelism – the number of students we’ll get involved in a project – is zero, which means unlimited. That made sense back in the days when our SQL Servers only had a couple of cores, but today, we’ve got huge, ginormous processors. (I’m not bragging, I’m just saying.)

Microsoft KB 2806535 gives MAXDOP recommendations, and the short story is that you should set it to the number of cores in one processor, up to 8. (I’m simplifying here.)

The virtual machine has a little less power.

Microsoft is saying that in most cases, as you go beyond 8 students working on a single project, there’s a diminishing amount of returns. You’re better off leaving the rest of the students free to work on other projects.

There’s a ton of bad advice on the web that goes a lot further and says you should set MAXDOP to 1 for OLTP-oriented workloads. They’re saying that if your application’s database needs are mostly very small inserts, updates, and deletes, then you should constrain SQL Server to only use one student at a time for any project, no matter how big that project appears to be.

That advice is usually no good because it assumes your server will never, ever run a big query. Sure, in some environments like Microsoft SharePoint, MAXDOP = 1 does make sense – but the key is really knowing the query workloads well. In most of the OLTP environments I see, people still want to run big, ugly reports in production, and we can’t stop them. When they do hit the server hard with those queries, I want to throw a few cores at the problem to make it finish faster. The key is knowing that there’s another knob we can tweak.

Defining Big Queries: Cost Threshold for Parallelism

Remember that really important sentence? Let’s read it again:

When you pass in a big query, SQL Server will consider parallelizing it across more cores – up to your Maximum Degree of Parallelism (MAXDOP).

What exactly is a big query? Turns out we can actually tell SQL Server by setting Cost Threshold for Parallelism – the minimum cost of a query before SQL Server will consider dividing the work across multiple cores. It’s set in exactly the same place as MAXDOP – in SSMS, right-click on the server name and click Properties, Advanced.

The default Cost Threshold for Parallelism is 5 – but 5 what? Books Online says:

The cost refers to an estimated elapsed time in seconds required to run the serial plan on a specific hardware configuration.

That’s technically correct, but the words “specific hardware configuration” are a little tricky. They refer to an imaginary machine with an imaginary amount of CPU power and storage throughput. It’s like how we measure cars in horsepower. If you put together a tug-of-war between a Jaguar XFR-S and 550 horses, it’s not like it would be a dead heat. These are just numbers.

The real thing to know is that a query cost of 5 is a lot like 5 horsepower – it’s pretty darned small. With the defaults, SQL Server will aggressively try to parallelize everything.

The Real Way to Reduce CXPACKET Waits

Set MAXDOP per Microsoft’s recommendations in KB 2806535.

Set Cost Threshold for Parallelism in a way that lets your small queries stay single-threaded, but still gets more students involved when there’s a really big project. To do that, you have to…

Learn your workload. Use SQL Server’s plan cache to find the most resource-intensive queries on your system, and then analyze the costs of those queries. On one of my servers, for example, I know that we get hit with a lot of OLTP queries with a cost of around 30-40, and I don’t want those to go parallel. However, we also get a lot of reporting queries that scan the entire sales detail table, and those always have a cost of around 200 or higher.

This is a big topic, and tuning is different on a server by server basis. To get trained on learning your workload and taking the right steps for it, check out our SQL Server training videos.

What If Performance Gets Worse?

After setting Cost Threshold and MAXDOP, it’s possible that performance could suddenly get worse. You might have queries with a cost in the range of 5 to 50 that used to go parallel, and now suddenly go single-threaded.

Use sp_BlitzCache® to identify the top 10 most resource-intensive queries, making sure to run it with @SortOrder = ‘CPU’, then reads, then duration, looking at your SQL Server’s plan cache overall. Look for queries with a cost between 5 and 50, and do query tuning or index tuning on those queries.

It’s also possible that 50 might not be the right number: say you’ve got a query with an estimated cost of 40, and it’s actually a wildly underestimated cost. SQL Server is making a plan that doesn’t take into account how much data actually comes back. In that case, you can either tune the query, or lower Cost Threshold to 39 to let that query go parallel.

Wanna learn more?

In my Mastering Query Tuning class, I explain why queries go parallel, how SQL Server has a tough time balancing the work evenly across multiple cores, and how you can fix that by tuning the indexes and queries specifically for parallelism.

In my Mastering Server Tuning class, I dig into more details about Cost Threshold for Parallelism and MAXDOP, and I explain why those changes alone aren’t enough to rebalance work properly across multiple cores.

You can also get a deal on all of my Mastering classes with the Recorded Class Season Pass: Masters Classes.


My Five Favorite That Conference Memories

SQL Server
3 Comments

Last week, I went to summer camp for geeks, and I had a great time! That Conference is a three-day, developer-focused, family-friendly technology conference. Camp was held for the first time in 2012. I heard such great things about it from last year’s campers that I decided to go this year!

The sessions focused on mobile, web, and cloud development. Being a SQL Server geek, I was a bit of a stranger in a strange land. I confess I couldn’t answer any of the .NET Rocks! trivia questions during the prize giveaway at the end, but I still took a ton away from this conference. Here are my five favorites!

#That5K

I love running, and I try to find fellow runners at SQL Saturdays, PASS Summit, and even at our training classes. I saw that there would be a group running each morning of That Conference, so I decided to join them. I’m glad I did! I got to know a couple fellow runners and geeks better. The second day, one person told us it was the first time he’d ever run 3 miles straight, and another person said it was the first time in his life he’d ever woken up with the intent to exercise. Those comments made the early wake-ups worth it. Your physical health ties directly into your mental health and ability to enjoy life – don’t neglect it.

Technology-Agnostic

My primary focus is SQL Server, but when I work with clients, I’m not working with just the DBA. It’s frequently a group – a server admin, a manager, and a handful of developers that work with the system. They may not speak my language, and I’m not fluent in theirs. Most conferences focus on one topic – SQL Server, SharePoint, .NET. Not this one – it was a mix of .NET, PHP, Ruby, Java, mobile development, and more. Thus, this was the perfect conference for me to attend – learning what’s important to developers and speaking their language.

I attended sessions on PHP, Git, DevOps, website development and optimization, PaaS in the cloud, and Azure HA/DR, among other topics. I learned a ton. I also learned what developers care about – and it’s not how long the database backups take each night!

Fellow Campers

I met great people. Everyone that I sat down next to at breakfast or lunch was friendly and willing to chat. The speakers were top-notch.  It’s a great community-focused event where we were encouraged to network and share – and everyone did.

Arduino

Arduino is “an open-source electronics prototyping platform based on flexible, easy-to-use hardware and software.” Let me rephrase that: Arduino lets you make dancing robots.

arduino

I had the distinct pleasure of watching Sharon Cichelli give a talk about Arduino. Rather than a dry, boring presentation, she showed us how she learned electronics and this programming language to make a dancing robot. Having never owned an electronics kit or touched a breadboard before, I wasn’t sure I would understand a word. However, in 10 minutes, I was captivated and understanding electronics diagrams. When she wrote simple code to make her robot fret and wiggle, I was in love. The best talks are given by people who are passionate about a topic, and she clearly was. I’m tempted to get a “100 Electronics Projects for Kids” kit and let my inner geek out now!

Open Campfires

The difficulty with every conference is that there are always topics I want to talk about or learn more about that aren’t on the schedule. There are times I want to find a group of people sitting around a table, chatting, and join them. The Open Spaces concept fills that void perfectly. There was a large hall set aside specifically for this. Half of it was tables that anyone could use at any time – to work, to chat, to program. The other half was set up in four circles of chairs. If you wanted to lead a session at any time – whether you had a question you wanted to ask other people, or toss ideas around – all you had to do was put a topic and your name on a post-it note on the board.

The board was filled with topics from “Bitcoin” to “Unblocking Creativity” to “Improving the Workplace”. I sat in a couple of them my first day at lunch and was hooked. People were sharing ideas, confidently talking about what worked for them and what didn’t, and teaching me a ton.

I decided to throw my own in, and put down “Performance Tuning: What and How” on the second day after lunch. I wanted to find out what steps developers took to tune their code, and how they would get to the point of saying, “It’s a database problem.” I also wanted to know what questions they had about SQL Server performance tuning. The worst part about this? It was only an hour. It flew by. Ten or so of us discussed everything from how indexes work to caching, execution plans to baselines.

My Open Space discussion

What really impressed me was people’s willingness to talk. Everyone at that conference could have taught me something. Most people are scared of talking in front of people, so they never submit a session. But when you put them in a small group and let them talk about a topic they care about, they will open up. I learned most from those people, sharing their day-to-day challenges. It was inspiring!

Let’s Have S’mores!

I didn’t think anything could top the sessions and networking, but the conference ended with a s’mores and bacon bar. Perfect!

I can’t wait to go camping at That Conference next year!


Introduction to SQL Server Failover Clusters (video)

Clustering, SQL Server
55 Comments

You’d love to know how to make your SQL Servers more highly available, but you’re just not sure what “clustering” is all about. We can help! In this 30 minute video Kendra Little shows you how failover clusters make your SQL Servers easier to manage. She uses diagrams and drawings to teach you the strengths and weaknesses of failover clusters and shows why clustering is becoming even more critical for high availability and disaster recovery.

This webcast was sponsored by Idera Software— and they gave away a free trip to the SQL PASS 2013 Summit to one lucky attendee. How cool is that???

Got Questions? Scroll on down and check out Q&A from the live webcast below the video, or read more about clustering SQL Server.

Webcast SQL Server Clustering Q&A

For failover cluster instances, does Windows Clustering needs to be enabled before you configure SQL Server Clustering? Or is it enabled by default? You need to enable the Failover Clustering feature on all nodes and create and validate the Windows Failover Cluster. You then install SQL Server onto the cluster (you tell the SQL Server installation GUI you’re installing it on the cluster and it walks you through a wizard).

So there is only one active node at any given time with one or more possible passive nodes. Right? Yes, exactly– any given clustered SQL Server Instance can only be active on one node (physical server) at any given time. (You can have more than one instance on each cluster, so you could potentially have multiple instances active on a single node, or multiple instances active across multiple nodes.)

Can we have two nodes on the same physical hardware? A “node” IS a physical server, so no.

Must applications be coded as cluster aware? No, apps have no idea that they’re connecting to a database that lives on a cluster. They just need to be able to handle the brief downtime during a failover so that if their connection is interrupted, they retry/keep on going.

Is there any test or lab microsoft provides to try to test clustering? No, you’ll want to build your own lab for that.

What about a SQL Server cluster with one physical node and one node that’s a virtual machine– Is this recommended? We don’t recommend it. Read why it gives us the heebie jeebies here.

Would a virtualized failover cluster avoid the downtime during the failover? No.

How do you configure and Manage MSDTC? Several people asked this one. Cindy Gross answers everything you need to know about configuring DTC on a failover cluster.

How many IP addresses/names do you need? We had a couple of versions of this question– and I don’t mention every name and IP address involved in clustering in the video. Here’s a list:

  • Windows Failover Cluster Name and IP: The windows cluster itself gets a name, but you won’t use that to access the SQL Server. (It’s just for cluster management purposes.)
  • SQL Server Network Name and IP: Each SQL Server instance gets its own name and IP that can move around the cluster. This is a good thing. This *is* what you use to talk to the SQL Server.
  • DTC Name(s) and IP(s): The number you need depends on how your cluster and DTC are configured. See the link on the MSDTC question above.
  • Physical Server Names and IPs: Just like any other server, each physical node gets a name and IP so you can manage it.

Do we need to configure a heartbeat network? Great question. Check out Brent’s article, “Everything You Know About Clustering is Wrong“. (Great title, eh?)

What manages which node is up or down? The Windows Failover Clustering feature does this. It’s a set of services built into Windows that work for all kinds of clustering, like Exchange or file/print servers.

Are there advantages to a cluster with shared storage vs a cluster running availability groups without shared storage? Yes – say your database is 1TB. With AlwaysOn AGs, you need at least 2TB of storage. There are also scenarios with very high amounts of data modifications or high numbers of individual databases that (could) work (relatively) easily on a failover cluster, but push the limits of Availability Groups.

Doesn’t Microsoft discourage using the terms “active/passive” and “active/active”? They sure do! But the phrases “single instance failover cluster” and “multi instance failover cluster” just don’t roll off the tongue, so they’re rarely used in the real world. When we say “multi instance failover cluster”, inevitably people ask, “oh, you mean active-active?”  So you can either use the “approved” terms, or the terms most people understand— whichever you prefer.

In a two node cluster with one SQL Server Instance (“Active/Passive”), what exactly is the status of the passive node? Is it something like the SQL Service needs to start when the active node fails?  Yes! You got it. And if you look at the SQL Server services on the “idle” node, you’ll see they’re in a stopped state and set to manual start. That’s by design– it’s the failover cluster that will start the services when it needs to happen.

Would it be possible for each node to host its own SQL instance which fails over to the other one respectively? – Our goal would be to host one 2008 R2 and one 2012 instance of SQL server. Technically speaking, this is called a “side by side deployment”, but I don’t know anyone who recommends it. This question reminds me of the Meatloaf song, “I’d do anything for love, but I won’t do that.” Let’s break down the problems:

  • Installation: You’ve got to install everything in a very specific order (lowest to highest) on every node. Get anything out of order and you’ve gotta start over.
  • Maintenance: More updates, more patches, more failovers
  • Troubleshooting performance or availability problems: Oh, that gets ugly. You’d be running in a scenario that very few people use. Let’s imagine that you start getting unexplained failovers. It’s now much more hairy to troubleshoot.

So I urge you to consider other options. If you do go this route, work extra hard to make sure you have a very similar setup (ideally identical) in a non-production environment to mitigate risk and heartache.

To avoid confusion: For service packs and cumulative updates, you can use a rolling upgrade process on the cluster. That’s still totally cool.

For instant file initialization, you need to set that up on each node or is it “cluster” aware? And do you recommend it for clusters? You have to set it up on each node, and yes, we’d still recommend it.

Other than checking from SQL Server logs, Windows EventViewer logs, can we find the last failover duration? Nope, not outside of those places.

Is clustering available on the express edition? Technically, no, but you can cluster it manually yourself. If you’re considering this one, step back and take a good look at the problem you’re trying to solve– we’re a little worried.

Can I set up fake instance in my DNS that points to myServer\ThisInstance to start porting over to what will be in place after the cluster is in place?  Setting up before hardware order is placed we get to tweak existing sprocs?  Or is this a BAD IDEA?  Yes, you can create a pointer in DNS to do this. I call it a “DNS friendly name”, some people call it a “DNS pointer”, some people just say “CNAME”. This can be very useful.

More Microsoft SQL Server Clustering Resources

Whether you want help choosing between an active/passive and an active/active cluster, or if you’re the kind of DBA who knows that’s not even the right name for failover clustered instances anymore, check out our SQL Server clustering training page.


The Stages of Performance Tuning

SQL Server
2 Comments

Performance tuning is a weird art to learn, because you do it in public. Sure, you may puzzle over a technical problem at your desk or revise code on your own– but when it comes to really tuning hard problems, 99% of the time you’re doing it with other people. That’s the nature of real performance tuning.

Just like learning to dance, it can be awkward to get into performance tuning. What if you miss something obvious? What if the idea you suggest is totally stupid? What if you try to do things that are, frankly, impossible?

You’re worried that they’re all gonna laugh at you.

Everyone has these fears at first. If you keep at it, you’ll get through it.

Stage 1 – The Kid’s Recital: Everyone starts out here. You’ve read some blog posts, you’ve done a little practicing, and now when things get tough, you say, “Hey, what about this!?!?”

People can tell that you’re a little new at this, and maybe you’re a little overeager, but you probably make up for it in excitement. Don’t get stage fright. You know that sometimes people don’t think you’re a total pro, but you’ve got to just keep practicing and getting out there and performing. Go out there and try to do your thing.

You secret power at this stage: Listen to other people. Learn from them as much as you can.

Stage 2 – The Rebecca Black: Eventually, you learn to sing a song that’s pretty catchy. You find a few ways to make something blazing faster. People start to listen to you more and more, and they come to you to ask your opinion more often.

At this stage you just know a few tricks, but they seem powerful. You feel like “This stuff wasn’t so hard! I know everything I need to know!”

The rush is blissful, but usually brief. Suddenly you’re rushing into trouble and trying to tackle too much alone. It turns out that you really know a few tricks, and soon enough you start to make mistakes. Hopefully, it humbles you. (If it doesn’t, well, bad news. Nobody’s gonna wanna work with you if you get stuck in this phase.)

You wonder if you’ll ever be more than a one-hit-wonder.

Stage 3 – The True Karaoke Star: If you keep at it, you’ll get comfortable, and you’ll learn to embrace what you don’t know. You’re used to solving performance problems. You’ve got not just one or two tricks in your bag, but many different techniques, and you know their limits. You’ve got good sources to go to, and you love to question your assumptions.

More importantly, you’ve made it to that golden place where you’re no longer embarrassed, but you’re not over-confident, either. You have your voice and you also listen to people. You don’t panic at the first sign of trouble, and you also know that the show doesn’t have to be all about you– other people can get on stage, too.

Sometimes it Takes a While. Finding the right job and lifestyle where you can grow and learn is the hard part. That probably won’t fall into your lap. It’s OK. Everyone has to start somewhere– and for some of us it takes volunteering, working nights, or taking risks on our career to try something new.

Whichever way you get there, don’t get discouraged. You can be a rock star, too.


Success in the Cloud

Cloud Computing
5 Comments

Right now, someone in your company is thinking about moving your operations up into the cloud. If your company is like 95% of companies out there, “the cloud” is really a synonym for Amazon Web Services (AWS). Thinking about a move to AWS is happening across many companies, and it’s not something that you need to be scared of – nobody is going to lose their job. However, it’s important to understand what you and your company can do to make this transition successful, painless, and an opportunity for growth.

Performance Baseline

How fast is your application right now? Do you know when you’ve hit peak load or even which metrics signify peak load?

Having a performance baseline is the only way to make sure that changes are helping. A general feeling that things are getting better isn’t enough, you need to know. During our engagements with customers, we evaluate how applications are performing today. We gather metrics around disk and CPU performance and look for signs of existing and potential bottlenecks. Once we know where things are, it’s easy to figure out where things are going.

As you’re looking to move to AWS, take a look at your current performance baseline. Are you happy with those numbers? Things probably won’t get better after the move; virtualization has overhead and everything in AWS is virtualized. Once you’ve got a baseline of your performance, it’s easy to test your theories about performance and make decisions about how aggressively you need to tune your application to meet your promises to your customers.

Service Level Agreements

SLAs are so important that near the beginning of every engagement I ask, “Do you have an SLA with your customers? What about internal SLAs between your teams?”

An SLA can be as simple as responding to outages within a certain window or as complex as measuring the performance of specific actions in the application. Having an SLA in place early can make it easy to evaluate your ability to move up to AWS and still maintain acceptable performance. If you know that a specific set of web pages must return faster than an average of 250ms during peak load, you have an easy measurement to determine if performance is acceptable.

Distilling performance down to a set of metrics makes it easy to make decisions, spot problems, and design for the future. In addition to a performance baseline, SLAs also give guarantees. If query performance drifts outside of agreed upon norms, the SLA can describe who is going to work on improving performance and how quickly that work gets scheduled.

SLAs aren’t just performance related – they relate to how fast you can bring a system online in the event of an outage, how you will respond to potential performance issues, and what the shape of that response looks like. Everyone aspires to five 9s of uptime, but what’s important is how you handle unforeseen outages.

An SLA shouldn’t be a detailed, painful document that resembles of a software license. A well designed SLA will serve to drive customer interaction and push teams to take responsibility for making the application perform well.

Proactive Monitoring

What does your monitoring environment look like today? If you have monitoring in place, I suspect that you’re looking for problems as they’re happening. To maintain good performance in AWS, you need look for performance problems before they occur.

You can use your existing monitoring, or you can use Amazon’s CloudWatch to create alerts around trends in resource utilization. If you know your performance baselines, you can configure alerts to notify you when things are out of the ordinary. If CPU utilization has never gone higher than 55%, even under peak load, it’s helpful to set up an alarm to fire when CPU utilization has been higher than 60% over a period of 15 minutes.

It’s better to be aware of potential problems than to respond to a fire. Make sure performance warnings are different from alerts about actual problems, but also make sure that you’re doing something about warnings as they arrive. Being proactive about monitoring performance does more than help you keep things running smoothly; proactive monitoring gives you insight into where you can tune your applications and make things better in the long run.

Vision

What are your thoughts around AWS? What’s the big picture? Having a vision around AWS is going to be critical to a successful transition.

A vision around AWS can’t be a simple statement like “We’re going to move our operations into the cloud and save a lot of money.” While saving money is a nice goal, the vision around AWS needs to be something more than fork lifting your existing infrastructure into the cloud.

Having a strong vision about how AWS can help your organization meets its goals is critical. This doesn’t have to be highly detailed and include specific features, but make sure that the vision includes an understanding about how you will be deploying and refining your application over time. Moving to AWS is not a quick fix for any problem. Your vision needs to include what today looks like, what your goals look like, and how you’ll be working toward them over the next 3, 6, 9, and 12 months.

Taking full advantage of the rich feature set in AWS takes time, and your vision should reflect how you will make the move and monitor application behavior in order to make good decisions about direction and functionality.

Buy In

Most important is buy in. Everyone involved needs to buy into the idea that a move to AWS makes sense for the organization. This may be the hardest item to accomplish, but it’s worth making sure that your team is on the same page.

Having a team that’s accepting of the move will make the transition easier. Part of this acceptance is the realization that things will not be the same as they were before. Gone are the days of giant back end servers with hundreds of gigabytes of memory and multiple network cards. Performance is no longer a purchase order away. Your team needs to accept these statements as facts; you can’t easily upgrade your way out of performance problems in AWS.

Instead of buying their way out of problems, the team needs to be committed to investigating new ways to solve their problems. With AWS it’s simple to design a rapid prototype and direct load to the new prototype system. It’s important that everyone is on board with testing changes at any level – from a single function to the entire infrastructure. In AWS these sweeping changes are easy to do, but you need buy in from everyone involved that things don’t need to be the same as they were before.

Drifting Away Into Cloudy Success

If you don’t have all of these factors in place, are you going to fail? Probably not. These are distinct traits that I’ve found in companies who have successfully moved their infrastructure into AWS. The more of these that a company has possessed, the happier I’ve found them to be with AWS. As you’re considering a move into AWS remember that there are more than technical challenges to moving into AWS – there are human and organizational challenges that need to be met in order to ensure success.


SSD RAID Load Testing Results from a Dell PowerEdge R720

Hardware, Load Testing, Storage
159 Comments

We’ve got a client that does big batch jobs every day, loading hundreds of gigabytes of data or more in short bursts. They were frustrated with slow performance on the batch jobs, and after we performed our SQL Critical Care® with ’em, it was really clear that their hardware was the bottleneck. They were using a virtual server backed by an iSCSI SAN, and they were getting bottlenecked on reads and writes. We could put some more memory in it to cache more data, preventing the read problem, but we would still get bottlenecked trying to write lots of data quickly to the shared storage.

We recommended two things: first, switch to a standalone bare metal SQL Server (instead of a virtual machine), and second, switch to cheap commodity-grade local solid state storage. Both of those suggestions were a little controversial at the client, but the results were amazing.

Why We Switched from VMware to Bare Metal

Theoretically, virtualization makes for easier high availability and disaster recovery. In practice, there are some situations – like this one – where it doesn’t make sense.

In the event of a failure, 15-30 minutes of downtime were acceptable. The server was important, but not mission-critical. In the event of an outage, they didn’t mind manually failing over to a secondary server. This meant we could avoid the complexity of a failover cluster and shared storage.

Slow performance was not acceptable during normal production. They wanted to put the pedal to the metal and make an order-of-magnitude improvement in their processing speeds with as few code changes as possible.

They weren’t going to pay a lot for this muffler server. They’re a small company with no full time DBA and no glut of servers laying around. Buying a server was a big deal – we only had one shot to buy a server and get it right the first time. In this move, we were able to free up VMware licensing for other guests, too.

What We Designed: Dell R720 with Local SSDs

The Dell R720 is a 2-processor, 2-rack-unit server with room for 16 2.5″ drives across the front of the server, and two RAID controllers. It’s got room for up to 768GB of memory. It’s my favorite 2-processor SQL Server box at the moment.

I’m not against shared storage – I love it – but when I’m dealing with large batch jobs, a limited budget, and no clustering requirement, it’s tough to beat local SSDs. The R720 lets us use a big stack of 2.5″ solid state drives with two RAID controllers for processing data. Quantity is important here since affordable SSDs tend to be relatively small – 1TB or less. Some larger drives exist, like the Samsung 860 EVO 4TB, but bang-for-the-buck doesn’t quite match the 1TB-class yet.

The Dell R720XD is a similar server, but it’s absolutely slathered with drive bays, handling up to 26 2.5″ drives. While that sounds better – especially with today’s fastest SSD drives still being a little size-constrained – the R720XD only has one RAID controller instead of the R720’s two.

For our Plan B – where we’d fail over if the primary server died – we actually stuck with a virtual server. We built a small 2-vCPU, 8GB RAM guest with SQL Server. We keep it current using the database backups from the primary server. Remember, this application is batch-oriented, so we just need to run backups once a day after the batch completes, and then restore them on the secondary server. When disaster strikes, they can shut down the VMware guest, add more CPU and memory power to it, and it’s off and running as the new primary while they troubleshoot the physical box. It’s not as speedy as the primary physical box, but that’s a business decision – if they want full speed, they can easily add a second physical box later.

Picking Solid State Drives for the Database Server

When picking drives to populate the R720’s 16 bays, that’s where the tough decision comes in. You’ve got three options:

1. Use Dell-approved, Dell-sold drives. These are ridiculously, laughably, mind-bogglingly expensive given the size and performance:

Dell PowerEdge R720 Drive Choices

A 400GB MLC drive is $1,200 rack, so filling all 16 bays would cost $19,200. To put things in perspective, the server itself is about $10k with 2 blazing fast quad-core CPUs, 384GB of memory, and spinners on the fans, so buying Dell’s SSDs triples the cost of the server.

2. Use commodity off-the-shelf SSD drives. In the latest Tom’s Hardware SSD Hierarchy (check page 2 to see the SATA results), pick high bang for the buck drives.

And it’s usually half the cost of the Dell drive, meaning we could fill the R720 with 8TB of smokin’ fast storage for a few thousand bucks, plus leave a couple of hot spares on the shelf.

There are risks with this approach – Dell won’t guarantee that their controller and their software will work correctly with this combination. For example, during our load testing, the DSM SA Data Manager service repeatedly stopped, and we couldn’t always use the Dell OpenManage GUI to build RAID arrays.

3. Ignore the drive bays, and use PCI Express cards. Drives from Intel and Plextor bypass the RAID controller altogether and can deliver even faster performance – but at the cost of higher prices, smaller space, and tougher management. You can’t take four of these drives and RAID 10 them together for more space, for example. (Although that’s starting to change with Windows 2012’s Storage Spaces, and I’m starting to see that deployed in the wild.)

For our design, we ended up with:

  • Dell PowerEdge R720 with 2 quad-core CPUs, 384GB memory – $10k
  • 16 1TB SSDs – $8k
  • Hardware total: under $20k
  • SQL Server Enterprise Edition licensing for 8 cores – $56k

Kinda keeps things in perspective, doesn’t it? The hardware seems insanely overpowered until you look at how much licensing costs. At that point, why wouldn’t you buy this kind of hardware?

Why I Load Test SSDs in RAID Arrays

The R720 has two separate RAID controllers, each of which can see 8 of the Samsung drives. The drawback of this server design is that you can’t make one big 16-drive RAID 10 array. That’s totally okay, though, because even just a couple of these race car drives can actually saturate one RAID controller.

I wanted to find out:

How few drives can we get away with? For future client projects, if we didn’t need to fill up the drive bays in order to get capacity, could we saturate the controllers with just, say, 4 drives instead of 8? Can we leave enough space to have hot spare drives? I run the performance tests with 2, 4, 6, and 8 SSD drives.

How much of a performance penalty do we pay for RAID 5? RAID 10 splits your drive capacity in half by storing two copies of everything. RAID 5 lets you store more data – especially important on limited-capacity solid state drives – but is notoriously slow on writes. (Thus, the Battle Against Any Raid Five.) But what if the drives are so fast that the controller is the bottleneck anyway?

Should we turn the controller caching on or off? RAID controllers have a very limited amount of memory (in our case, 1GB) that can be used to cache reads, writes, or both. In the past, I’ve seen SSD-equipped servers actually perform slower with the caching enabled because the caching logic wasn’t fast enough to keep up with the SSDs. Dell’s recent PowerEdge controllers are supposed to be able to keep up with today’s SSDs, but what’s the real story?

Does NTFS allocation unit size still matter? In my SQL Server setup checklist, I note that for most storage subsystems, drives should be formatted with 64K NTFS allocation units for maximum performance. Unfortunately, often we get called into client engagements where the drives are already formatted and the database server is live in production – but the NTFS allocation unit is just 4K, the default. To fix that, you have to reformat the drives – but how much of a difference will it make, and is it worth the downtime?

The answers to these questions change fast, and I need to check again about once a quarter. When I need to double-check again, and I’m working with a client on a new server build with all SSDs, I offer them a big discount if I can get remote access to the server for a couple of days.

Load Test Result Highlights

Turning off read caching didn’t affect performance. The controller’s small cache (1GB) just isn’t enough to help SQL Servers, which tend to cache most of their data in memory anyway. When we need to hit disk, especially for long sustained sequential reads, the controller’s minimal cache didn’t help – even with just 4 SSDs involved.

The controller’s write caching, however, did help. Write throughput almost tripled as opposed to having caching disabled. Interestingly, as long as write caching at the controller was enabled, it didn’t matter whether read caching was enabled or not – we saw the same benefit. I would expect higher write throughput if all of the 1GB of cache was available to cache writes, but that doesn’t appear to be the case with the R720’s controllers at least.

NTFS allocation unit size made no difference. This combination of RAID controller and drives is the honey badger of storage – it just don’t care. You can leave the default caching settings AND the default NTFS allocation unit size, and it’s still crazy fast.

In RAID 10, adding drives didn’t improve random performance. We got roughly the same random performance with 4 drives and 8 drives. Sequential read throughput improved about 35% – good, but maybe not worth the financial cost of doubling the number of drives. Sequential writes saw a big boost of about 60%, but keep in mind that sustained sequential writes is a fairly rare case for a database server. It’s unusual that we’re not doing *any* reads, and we’re writing our brains out in only one file.

SSD speeds still can’t beat a RAMdrive. With SQL Server Standard Edition being confined to just 64GB of memory, some folks are choosing to install RAMdrive software to leverage that extra cheap memory left in the server. If your queries are spilling to TempDB because they need memory for sorts & joins, this approach might sound tempting. Microsoft’s even got an old knowledge base article about it. The dark side is that you’re installing another software driver on your system, and I always hate doing that on production systems. Just for giggles, I installed DataRam’s RAMdisk for comparison. The SSDs are on the left, RAMdisk on the right, and pay particular attention to the bottom row of results:

RAMdisk vs RAID 10 SSDs
RAID 10 SSDs vs RAMdisk

The bottom row, 4K operations with a queue depth of 32, is vaguely similar to heavy activity on multiple TempDB data files. This particular RAMdrive software manages about 4x more write throughput (and IOPs as well) than the RAID 10 array of 8 drives. (For the record, a RAID 0 array of 8 drives doesn’t beat the RAMdrive on random writes either.)

And finally, here’s the performance penalty for RAID 5. RAID 10 is on the left, 5 on the right. Same number of drives, same cache settings, same allocation unit settings:

RAID 10 versus RAID 5

It’s not a surprise that RAID 5 is faster for reads, but in this round of testing, it was even faster for sequential and large writes. The only place where RAID 5 takes a hit: the bottom right, 4K writes with queue depth 32.

If you’re running a Dell PowerEdge R720 loaded with Samsung 840 Pro SSDs, you’re probably better off with RAID 5 than RAID 10 – but why?

Load Test Lowlights: The Controller

We’re not just testing the drives here – we’re also testing the RAID controller. To get a true picture, we have to run another test. On the left is a RAID 10 array with 8 drives. On the right, just one drive by itself:

RAID 10 versus just one drive

The top two lines are sequential performance, and the RAID array helps out there as you would expect. Having more drives means more performance.

The jawdropper hits in the bottom half of the results – when dealing with small random operations, more drives may not be faster. In fact, the more drives you add, the slower writes get, because the controller has to manage a whole lot of writes across a whole bunch of drives.

See, we’re not just testing the drives – we’re testing the RAID controller too. It’s a little computer with its own processor, and it has to be able to keep up with the data we’re throwing at it. In the wrong conditions, when it’s sitting between a fast server and a fast set of solid state drives, this component becomes the bottleneck. This is why Dell recommends that if you’re going to fill the server with SSDs, and you want maximum performance, you need to use the R720 instead of the R720xd. Yes, the R720xd has more slots – but it only has one RAID controller, so you’re going to hit the controller’s performance ceiling fairly quickly. (In fact, the controller can’t even keep up with a single drive when doing random writes.)

This is why, when we’re building a new SQL Server, we want to test the bejeezus out of the drive configurations before we go live. In this particular scenario, for example, we did additional testing to find out whether we’d be better off having multiple different RAID arrays inside the same controller. Would two four-drive RAID 10 arrays striped together be faster than one eight-drive RAID 10 array? Would we be better off with a single RAID 1 for TempDB, and a big RAID 5 for everything else? Should we make four mirrored pairs, and then stripe them together in Windows?

You can’t take anything for granted, and you have to redo this testing frequently as new RAID controllers and new SSD controllers come out. In testing this particular server, for TempDB-style write patterns, a RAID 0 stripe of two drives was actually slower than a single drive by itself!

So as Jezza says on Top Gear, and on that bombshell, it’s time to end. Good night!


How to Use HP System Management Homepage

Hardware, SQL Server
22 Comments

One of the big reasons you spend big money on server-quality hardware is to get cool stuff to make administration easier. Each hardware vendor provides their own software tools – Dell includes OpenManage, IBM includes Director, and HP includes their System Management Homepage.

To illustrate how it works without violating anybody’s NDAs, I picked up a used HP DL380 off eBay to use as a demo.

When you remote desktop into your HP server, you’ll see HP System Management Homepage on the desktop. Launch it, and it’ll ask for your authentication information:

HP System Management Homepage Login

It integrates with Windows authentication, so as long as you’re a relatively powerful user on the local machine, you can use your regular Windows credentials and get in.

If HP System Management Homepage is Blank or Gives Errors

If it hasn’t been configured before, the home page will be completely blank:

Before WBEM Configuration

You may also get a popup warning saying something like:

A timeout occurred while loading data for the HP System Management Homepage which may result in missing or incomplete information. Please ensure that the various agents configuration is correct. One common error is around setting SNMP community strings and havin gat least one read/write string specified. For additional information on how to discover which components may be causing the timeout, see the HP System Management Homepage log and the HP System Management Homepage User Guide Troubleshooting Section.

That’s technically true – but if you’re dealing with a system that’s never been configured before, and your sysadmins aren’t actively using HP SMH for inventory and management, don’t bother with SNMP. There’s an easier way to fetch hardware data from Windows agents – WBEM.

Click Settings at the top, and under “Select SMH Data Source”, click Select:

Settings for System Management Homepage (SMH) data source

From there, change the data source to WBEM, and click the Select button:

Select WBEM data source

After you pick WBEM, *if* the provider agents have already been installed, the hardware details will populate within a minute or two. If not, you’ll need to install HP’s free WBEM providers. These are safe to run on SQL Server, and they give you a lot of good data that we’ll discuss below.

The Working Home Page

Once WBEM is up and running (or SNMP is configured correctly, but good luck with that), here’s what your System Management Homepage will look like:

HP System Management Homepage working correctly

From here, we can drill down into details to see what kinds of processors, memory, and power supplies we’ve got.

Note that in mine, it’s showing an error for HP NC373i Multifunction Gigabit Server Adapter. That’s because I’ve got a network cable unplugged. If that’s normal for me, I can click on that network card and change the Link Down Status Included to “Ignore Status” – that way I don’t get a red X on the dashboard:

Network Card Status
Network Card Status

You might have bigger problems, too. To simulate a drive failure, I yanked a hard drive out of the front of my running server. Here’s how the home page looks – note the yellow exclamation point next to the RAID controller:

HP SMH showing a failed hard drive

This isn’t a red-level warning because I’ve already got a hot spare drive in my server. If I click on the Smart Array for details, I get:

Failed drive symptoms in the array details

In the left, in the Physical Drives list, the red X over one of the drives shows me which one has failed. The Logical Drive is the RAID array, and it’s in a degraded state because it’s in the process of rebuilding. During a rebuild, I can expect slower storage performance, but my server won’t go down altogether. Later, my sysadmin (okay, actually there’s just one of us here) can pull the failed drive and replace it with a good one. I won’t get another rebuild at that point – that newly inserted drive can just become my new hot spare, depending on my settings.

HP System Management Homepage isn’t the only place to see storage problems. When the HP drivers are installed correctly, you’ll also see it in the Windows event logs:

HP drivers pushing errors up to Windows event logs


Get Even More Storage Details with the ACU

If my sysadmins are really good, they’ve even installed the HP Array Configuration Utility, which lets me drill down into RAID options in Windows. Check your Start menu to see if it’s installed:

HP Array Config Utility Menu

After launching the ACU, you get buttons for the controller settings, caching settings, and more:

HP Array Config Utility Dashboard

From here (as well as from the System Management Homepage), you can get details about whether your array cache is optimized for reads or writes:

HP cache settings
HP cache settings

If you’re really serious about performance, and you’ve got time before you go live with a server, you can do benchmark testing to determine the right cache settings for your database server’s data files, log files, and TempDB files. For example, if you know your log files are 100% write (except for the log backups), maybe it makes sense to use 100% write cache on those.

Getting Alert Emails When Things Break

We can’t be going into HP SMH all the time just to check on things – ain’t nobody got time for that. Sysadmins can also install HP Event Notifier, which works in combination with the drivers to send us emails when something goes wrong. Check your start menu to see if it’s already been installed:

HP Event Notifier
HP Event Notifier Config

The configuration is a simple wizard:

Event Notifier Config Wizard

You start by configuring the mail server and the “from” address it will use:

From Emails
From Emails

I like my “from” address to be the name of the server – in this case, Bigmouth, because my current lab boxes are named after Smiths songs. I like my reply address to be a distribution list for the IT team. That way, when an email alert comes in, one of my admins can just hit reply and say “I’m on it” or “Ignore this, I’m replacing a drive” or whatever.

Next, you’ll configure the destination emails, which again should be distribution lists, not individual employees.

Recipient Addresses
Recipient Addresses

Finally, you get to pick the events that will trigger emails. You want all of them:

Events
Events

I absolutely love this because it catches all kinds of things that regular OS & application alerts can’t. For example, one fine summer Sunday in South Florida, our data center air conditioners struggled to keep up with demand. I received email alerts from my servers saying that their RAID controllers were too hot – and within 15 minutes, the first air conditioner failed outright, followed shortly thereafter by the second (supposedly redundant) AC unit. Those early warnings from the RAID controller temps gave us extra time to get into the office, and every little bit helps. (Especially when you have to shut down hundreds of servers and shared storage devices.)

Managing Firmware and Software with the Version Control Repository Manager

VCRM is like Windows Update for your hardware. If your System Management Homepage has Version Control on the front page, click on it, and you’ll see something like this:

HP Version Control Repository Manager

In my example above, I’ve got a list of hardware and drivers going down the left, and then on the right it shows the installed version. That’s missing an important piece – what you really want to know is the most recent version for each one.

Unfortunately, that part is a lot more work. It requires installing a repository server somewhere in your data center, and then pointing each of your servers to that repository. When it’s done, it’s amazing:

VCRM with a Working Repository

Now, I’ve got both Installed Version and Latest Version. When an update comes out, I’ll see it here, and I can simply check boxes and install the updates. Your servers probably aren’t going to have that – but that’s okay! That’s an advanced power tool.

Accessing Your Servers Remotely Via the HP iLO

HP’s Integrated Lights Out (iLO) gives you access to the server’s keyboard, mouse, and monitor remotely over the network. You can get the iLO IP address from your sysadmin or from System Management Homepage. Then go to that IP address with your browser:

HPO iLO Login
HPO iLO Login

You may get SSL certificate warnings – by default, the iLO ships with its own self-signed certificate, and your browser doesn’t trust that.

After logging in, you’ll get the iLO dashboard, which has some pretty nifty buttons:

HP iLO Dashboard
HP iLO Dashboard

The “Server Power” button does just what you think it does: you can either do a momentary press, or a press-and-hold to force the server to restart. However, before you do that, you should probably take a look at the console to make sure you’re rebooting the right server (or double-check to see that it’s actually frozen).

Click on the Remote Console tab, and you can actually take control of the server. It’s just like standing in front of the server in the rack. You can even click the Virtual Media tab to map local CDs to the server just as if they were plugged into the server. This is great for emergency diagnostics, but not so great for installing software – it’s much slower than using a network share.

Not all iLO features are available by default – some advanced stuff like remote console while the server’s up require advanced licensing packs. But who cares? You don’t really need that part – you can get an amazing start with the rest of the features I’ve mentioned.

Did I Mention This Stuff is Free?

When you buy and install a new server from HP, Dell, or IBM, they all include an insane amount of really cool management tools. They’re installed by default, but if you decide to pave & reinstall everything, make sure you get these goodies and install them.

They help you dig into your hardware’s capabilities, see how much free space your motherboard has for additional memory, learn how your storage cache is configured, and more. Knowing this stuff makes you a better systems administrator and database administrator.