Blog

Exploring the Magic of the Plan Cache

The plan cache holds a lot of secrets about what’s going on inside SQL Server. In the First Responder Kit we shared one of our plan cache scripts to find the top resource consuming queries. That query works well, but over time we’ve added some additional functionality to the query. I figured it was time to share the new query that we’re using to analyze SQL Server performance.

Our existing query looks at individual query stats, but it doesn’t take into account stored procedure or trigger execution stats. During our SQL Critical Care® checks, we’ve found it helpful to look at both procedures and triggers to figure out if they were causing problems for overall server health.

What Are We Looking At?

The original query just looked at sys.dm_exec_query_stats and looked at average and total metrics across CPU, duration, and logical reads.

Plan cache query: classic flavor


This was a helpful approach, but over time it’s become apparent that we needed to look at more than just individual statements – what if a single procedure was causing problems that only show up in aggregate?

The Bigger Picture

To get a view of the bigger picture, we added in two more DMVs – sys.dm_exec_trigger_stats and sys.dm_exec_procedure_stats. This gives us a big picture view of what’s going on inside SQL Server – the only thing that would make this better would be a DMV for function execution stats.

To avoid skewing results, data is aggregated by the query_hash – unfortunately this means the queries won’t work against SQL Server 2005. Not only do we rank queries by CPU, IO, duration, and execution count, but a second level of ranking is provided that ranks queries within their logical grouping – by statement, procedure, and trigger. If you want to see what your most expensive trigger is doing, it’s easy enough to make a quick change to the query.

Check it out:

New and Improved Output

Try it out – get sp_BlitzCache® in the usual way – by agreeing to our crazy terms of service, selling your email address to a foreign government, and clicking “download”.

Using the Query

This query is easy enough to start using right way – just download the file and run it. Once you’re familiar with it, scroll to the bottom and you’ll see two separate queries you can run. The first is suitable for pasting into Excel – it has no query plan and the SQL text is shortened to easily paste into a single cell. The second query has everything that you want.

Since data is dumped into a temporary table during analysis, it’s easy to keep re-querying the temporary table as you re-sort data or refine what you’re looking for.


Did Microsoft Stop Releasing SQL Server Service Packs?

SQL Server
47 Comments

Check out SQLServerBuilds.blogspot.com, a site that lists cumulative updates and service packs. Here’s a remixed version:

SQL Server Service Pack Release Dates

The first service pack seems to come out fairly quickly, but after the first one, it’s a year or more. Makes sense – you find a lot of bugs quickly, right?

Microsoft released at least one service pack per year, but … not last year. 2013 saw no service pack releases, and it’s been 442 days since the last service pack (SQL 2012 SP1) shipped.

Is Microsoft taking too long? Let’s look at each current version missing a service pack:

  • SQL 2012 has been waiting 442 days for SP2 – but that’s actually right in the range for normal SP2 releases. SQL Server 2008 went 540 days before SP2.
  • SQL 2008R2 has been waiting 545 days for SP3 – but that’s also less time than it took for SQL 2005 to get its SP3, so no cause for panic here yet.
  • SQL 2008 has been waiting 839 days for SP4 – here we actually do see some cause for alarm, because no supported SQL Server version has gone that long without a service pack.

442-DAYSWhen you step back and take the long view, we’re not really in that bad of shape yet – but I can see why people would be disturbed that no service packs have been released in over a year. It might just be a timing coincidence, or it might be something more.

But it does beg the question – what if Microsoft just stopped releasing SQL Server service packs altogether, and the only updates from here on out were hotfixes and cumulative updates? How would that affect your patching strategy? Most shops I know don’t apply cumulative updates that often, preferring to wait for service packs. There’s an impression – correct or not – that service packs are better-tested than CUs.


Full Scans/sec Doesn’t Mean What You Think

SQL Server
9 Comments

When is a “Full Scan” not a Full Scan?

The performance counter “Full scans/sec” sounds pretty scary. If you see spikes in this counter, you’re likely to think that your queries are madly scanning all the data in your tables– there are no stylish, well performant seeks, just drunken queries spewing IO everywhere.

If you look up the counter in SQL Server Books Online, it seems to confirm that. Full Scans/sec is defined as the “Number of unrestricted full scans per second. These can be either base-table or full-index scans.” It’s not just a FULL scan, it’s “unrestricted.” That’s sounds really bad, right?

Not necessarily.

Let’s take a look. You can warm up your test SQL Server instance and restore your favorite sample database to play along with the sample queries below using the AdventureWorks2012 database and perfmon.

Test 1: A full scan

Here’s our first test query. This query technically does an index scan, but it’s a very efficient partial scan– it uses just 3 logical reads to hop to the end of the index and grab the last value.

500 of these finish in less than one second. Here’s what the plan looks like. (If you look deep into the properties of the scan operator, you’ll find that it says that it’s a special “Backwards” scan for speed.)

An optimized clustered index scan

In perfmon, I can see that this query did the following:

  • 500 Full Scans/sec (SQL Server:Access Methods)
  • 1,908 Page lookups/sec (SQL Server: Buffer Manager – this is logical reads)
  • 0 Page reads/sec (SQL Server: Buffer Manager — this is physical reads and the data was already in memory)

I see full scans

Hmm, so what we’ve seen here is that we can make the full scans/sec counter spike with a scan that isn’t really “unrestricted” or “full” in the way that we might think.

Full scan does NOT really mean that it read the entire index! (I’m not the first to discover this, of course. Michael J Swart gives a nice example of a TOP query doing something similar in this post on different types of scans.)

Test 2: a “worse” full scan

Let’s make our test query a bit nastier. This new version of the query is not such a great citizen — it reads 3,820 pages on each run (as opposed to 3 reads from the query before):

This is also a scan but it does more IO. 500 of these take five seconds or so– much longer. Here’s the plan:
This scan does more io

When we run this, we see that:

  • Full scans/sec only spikes up to a max value of 97 this time– it’s much LOWER, even though we hit the SQL Server with a nastier query. We just ran this from a single SQL Server session, so it didn’t spike up as much and took longer– but it certainly isn’t better than the first query.
  • Page lookups/sec spikes up to a max value of 362,161. Each run of the query is doing more logical IO– and the fact that this query does more work shows up much more clearly here.
  • Page reads/sec just has a slight bump and at one point 8 reads/sec are registered. The data was already in memory, so this wasn’t really impacted at all.

Second sample of full scans
The “worse” query didn’t spike the full scans/sec counter, but it did more IO. If we were designing monitoring around the full scans/sec counter then we’d probably just throw an alert on the incident that actually had less impact.

Pulling it all together

Monitoring is a tricky business. Performance counters tell you a lot about SQL Server– but if you monitor on individual thresholds on many performance counters, you’ll end up with false alarms and more questions than answers. The counters shown in this post can be useful for baselining, trending, and interpreting in a larger context of information, but by themselves they don’t tell you a full story.

If you’re getting frustrated with perf counters and want to learn what’s really dragging down your SQL Server, check out our free webcasts, our free scripts, or our performance tuning training videos.


Improving the Performance of Backups

There will come a time when your database backups will not be as fast as you would like them to be. Over time, the volume of data you’re storing will grow, and backups will take longer – but your weekly or daily maintenance windows don’t grow as well. Backups can be resource-intensive, using I/O and network resources – and if they’re running when users are trying to work, the users may notice the performance impact.

Here are two ways to make your backups go faster.

Option A: Full and Differential backups

A typical backup scenario that I see is a full backup daily and, if the database is in Full recovery model, log backups throughout the day. But what happens when that full backup begins to take hours, instead of minutes? A differential backup may help.

A full backup contains all the data in the database, and enough of the log to recover it. A differential backup contains only the extents (groups of 8K data pages) that have changed since the last full backup. Because a differential is usually smaller than a full backup, it can take less time to complete.

The commands to run the backups are very similar. A full backup:

To perform a differential backup, you add the WITH DIFFERENTIAL option:

Combining full and differential backups throughout the day or week can reduce the time you spend waiting for backups to complete. There are two scenarios I usually see. The first is a full backup one or two days per week, with differential backups on the other days, and regular transaction log backups. This makes sense when a full backup every day would be too time-consuming. The second is a full backup daily, differentials every few hours, and regular log backups. This usually makes sense when fast recovery is necessary, and it would be better to be able to restore a full backup, a differential backup, and a subset of log backups – rather than the full backup and all log backups for the day.

This can add a layer of complexity to a restore strategy – instead of restoring the last full backup and ensuing logs, the most recent differential must be accounted for as well. You should practice this restore sequence so you understand the steps involved. You also need to monitor the size of the differential backups closely – depending on the rate of change in the database, you may not be saving as much space as hoped.

However, when your time to do backups and have them impact your users is shrinking, yet database size is growing, the full + differential strategy can be used effectively.

Option B: Backing up to multiple files

The standard database or log backup is done to one backup file:

When a backup is written to one file, one thread is assigned. You can back up to multiple files – in one or more locations – and multiple threads will be used. This can make a backup take less time – sometimes significantly. Here’s the command to create a full backup across four disks:

Having multiple backup files can make a restore more complicated. All of the files must be available, and all must be referenced in a restore session. To restore the backup files shown below, use the following command:

However, the benefits can be significant. I performed five tests – one file on one disk, two files on one disk, four files on one disk, two files on two disks, and four files on four disks. The results show that adding more disks decreases the backup time.

backup time chart

Note: these tests don’t cover all scenarios. If you have a group of disks in a RAID 5 or RAID 10 array, multiple threads writing to multiple files could be faster than one thread and one file. Lesson learned: test your backup files in your environment to determine what is best for you!


sp_Blitz® v32: Emailing, Serializable Locking, Simultaneous Agent Jobs, and More

SQL Server
9 Comments

The latest version of our SQL Server health check stored procedure is out today. Here’s what we’ve added in the last couple of versions – big thanks to the folks who keep making this even better for the community:

Changes in v33 – January 20, 2014:

  • Bob Klimes fixed a bug that Russell Hart introduced in v32, hahaha. Check 59 was false-alarming on Agent jobs that actually had notifications.

Changes in v32 – January 19, 2014:

  • Russell Hart fixed a bug in check 59 (Agent jobs without notifications).
  • Added @EmailRecipients and @EmailProfile parameters to send the results via Database Mail. Assumes that database mail is already configured correctly. Only sends the main results table, and it will not work well if you also try to use @CheckProcedureCache. Execution plans will not render in email.
  • Fixed a bug in checks 108 and 109 that showed poison waits even if they had 0ms of wait time since restart.
  • Removed check 120 which warned about backups not using WITH CHECKSUM. We fell out of love with WITH CHECKSUM – turns out nobody uses it.
  • Added check 121 – Poison Wait Detected: Serializable Locking – looking for waits with %LCK%R%. Happens when a query uses a combination of lock hints that make the query serializable.
  • Added check 122 – User-Created Statistics In Place. There is nothing wrong with creating your own statistics, but it can cause an IO explosion when statistics are updated.
  • Added check 123 – Multiple Agent Jobs Starting Simultaneously. Ran into an issue where dozens of jobs started at the exact same time every hour.

Changes in v31 – December 1, 2013:

  • Dick Baker, Ambrosetti Ltd (UK) fixed typos in checks 107-109 that looked for the wrong CheckID when skipping checks, plus improved performance while he was in there.
  • Dick also improved check 106 (default trace file) so that it will not error out if the user does not have permissions on sys.traces.
  • Christoph Muller-Spengler @cms4j added check 118 looking at the top queries in the plan cache for key lookups.
  • Philip Dietrich added check 119 for TDE certificates that have not been backed up recently.
  • Ricky Lively added @Help to print inline help. I love his approach to it.
  • Added check 120 looking for databases that have not had a full backup using the WITH CHECKSUM option in the last 30 days.

Go find ugly surprises inside your SQL Server now.


How to Query the StackExchange Databases

SQL Server
27 Comments

Update – October 2015 – You can download a Torrent of a database (rather than a data dump) now.

Most of my demos involve my favorite demo database: Stack Overflow. The Stack Exchange folks are kind enough to make all of their data available via BitTorrent for Creative Commons usage as long as you properly attribute the source.

There’s two ways you can get started writing queries against Stack’s databases – the easy way and the hard way.

The Hard Way to Query StackOverflow

First, you’ll need to download a copy of the most recent XML data dump. These files are pretty big – around 15GB total – so there’s no direct download for the entire repository. There’s two ways you can get the September 2013 export:

I strongly recommend working with a smaller site’s data first like DBA.StackExchange. If you decide to work with the monster StackOverflow.com’s data, you’re going to temporarily need:

  • ~15GB of space for the download
  • ~60GB after the StackOverflow.com exports are expanded with 7zip. They’re XML, so they compress extremely well for download, but holy cow, XML is wordy.
  • ~50GB for the SQL Server database (and this will stick around)

Next, you need a tool to load that XML into the database platform of your choosing. For Microsoft SQL Server, I use the Stack Overflow Data Dump Importer.

The SODDI user interface expects two things:

  1. The XML files have to be stored in a very specific folder name: MMYYYY SITEINITIALS, like 092013 SO. SODDI will import multiple sites, and it creates a different schema for each site.
  2. All of the XML files for the site have to be present in that folder: Badges, Comments, PostHistory, PostLinks, Posts, Tags, Users, and Votes.

When you run SODDI.exe without parameters, this GUI pops up (assuming that you named your Stack Overflow demo folder 092013 SO):

SODDI with my settings

Source is the folder where you saved the data dumps. It expects to see subfolders in there for 092013 SO.

Target is the connection string for your database server. I’m using a local SQL Server (note that I picked SqlClient in the Provider dropdown) with a database named StackOverflow, so my connection string is:

Data Source=(local); Initial Catalog=StackOverflow; Integrated Security=True

If you want to use a remote SQL Server, you’d put its name in there instead of (local). You’ll also need to pre-create the database you want to use.

Ah, the StackOverflow Database

Click Import, and after a lot of disk churn, you’re rewarded with a StackOverflow database with tables for Badges, Comments, Posts, PostTypes, Users, Votes, and VoteTypes.

The resulting database is about 50GB. SQL Server’s data compression doesn’t work too well here because most of the data is off-row LOBs. Backup compression works well, though, with the resulting backup coming in at around 13GB.

Why Go to All This Work?

When I’m teaching performance tuning of queries and indexes, there’s no substitute for a local copy of the database. I want to show the impact of new indexes, analyze execution plans with SQL Sentry Plan Explorer, and run load tests with HammerDB.

That’s what we do in our SQL Server Performance Troubleshooting class – specifically, in my modules on How to Think Like the Engine, What Queries are Killing My Server, T-SQL Anti-patterns, and My T-SQL Tuning Process. Forget AdventureWorks – it’s so much more fun to use real StackOverflow.com data to discover tag patterns, interesting questions, and helpful users.

The Easy Way to Query StackOverflow.com

Point your browser over to Data.StackExchange.com and the available database list shows the number of questions and answers, plus the date of the database you’ll be querying:

StackExchange Database List

At the time of this writing, the databases are updated every Monday. If you want even more recent data, you can use the Stack Exchange API, but that’s a story for another day.

Click on the site you’d like to query, and you’ll get a list of queries you can start with, or click Compose Query at the top right. As an example, let’s look at a query that compares the popularity of tags:

Querying StackOverflow

Yes, this is a lot like SQL Server Management Studio in the browser. At the top, we’ve got our query, plus space for a couple of parameters. One of the fun parts about Data Explorer is that you can design queries to take parameters to show information for different users, date ranges, tags, etc.

At the bottom, notice the tabs for Results, Messages, and Graph. If your results look graph-friendly, Data Explorer is smart enough to figure that out:

Query Results in Graph Format

And yes, Data Professional, that last tab does indeed say Execution Plan, and it renders in your browser right down to the ability to hover your mouse over parts of the plan and see more details:

Execution Plan
Execution Plan

Data Explorer is really easy to use – check out the one-page documentation. It’s even open source, so to learn more about how it works, visit StackExchange.DataExplorer on Github.

Some system commands (like SET STATISTICS IO ON) are allowed, but you can’t create indexes, and there aren’t many indexes to begin with. You can also shoot yourself in the foot by writing an extraordinarily ugly query, and the system won’t stop you – for example, SELECT * FROM Posts will start running, but then may crash your browser as they start returning data. Jeremiah and I managed to repeatedly kill our Chrome browsers while tuning queries for fun.

I like using this to go poking around for unusual questions or answers. For example, I like to find questions that are viewed a lot, but don’t have any upvoted answers yet. (That’s prime territory for a SQL Server geek like me that wants to find tough questions to solve.)


Careful Adding Indexes with Always On Availability Groups

In theory, you can add indexes online with SQL Server Enterprise Edition.

In theory, with AlwaysOn Availability Groups, you can add and drop indexes on the primary replica whenever you want.

In theory, you can perform read-only queries on the secondaries whenever you want, and nobody gets blocked.

In practice, these things don’t always add up to the same answer.

I’ve got an AlwaysOn Availability Group demo lab with SQL Server 2014 hosting the AdventureWorks2012 database. I’ll start on my secondary server, and I’ll get all of the suffixes from the Person.Person table:

Clustered index scan on Person.Person

The query results aren’t important – instead, I’m showing the actual execution plan, which is very important. By default, there’s no index on the Suffix field, so I get a clustered index scan.

Say that for some bizarre reason, this is the type of query my end users constantly run, so I decide to switch over to the primary to add an index on Suffix. (As a reminder, you have to add indexes on the primary, not the secondaries.) After adding the index, I run the query again:

ag-demo-step-4
Index scan on our newly created index

Woohoo! We’ve now got an index scan on my new index. (Yeah, it’s not a seek, but this is a crappy query, and a scan is the best I’m going to get.) So far, so good.

But now let’s mix things up a little – let’s run that same query, but start a transaction with it:

Starting a transaction and running a SELECT

Now I have an open transaction, which really shouldn’t mean anything because you can’t do updates on the secondary. However, switch over to the primary, and drop that newly created index. Back over on the secondary, where we’ve got that open transaction, run the exact same query again:

Boom
Boom

Our transaction has been knocked out and failed. It’s funny to think of a read-only transaction as “failing”, but if you have a stored procedure that starts things off with BEGIN TRAN and then does a lot of reads, thinking it’s going to get a complete point-in-time picture of the data, that’s not going to work.

I know what you’re thinking: “But Brent, I don’t even use snapshot isolation, because I read Kendra’s post about it, and I know we’re not ready to test our app with it yet.” Thing is, SQL Server uses RCSI behind the scenes on all AlwaysOn Availability Group replicas – and it’s lying to you about whether or not the feature is enabled. Here’s the sys.databases view for my secondary replica:

Trust no one.
Trust no one.

SQL Server claims that for the AdventureWorks2012 database, both snapshot isolation and read committed snapshot are off – but it’s lying to you. Read Books Online about querying the replicas and note:

Read-only workloads use row versioning to remove blocking contention on the secondary databases. All queries that run against the secondary databases are automatically mapped to snapshot isolation transaction level, even when other transaction isolation levels are explicitly set. Also, all locking hints are ignored. This eliminates reader/writer contention.

They’re not kidding – even if I specify dirty reads, I can run into the same problem. Here, I start a transaction, but I’ve asked for the dirtiest, no-lockin-est reads I can get:

Riding dirty
Riding dirty

But when I add or drop a related index on the primary, even WITH (NOLOCK) transactions are affected:

Wow, Microsoft's getting much more casual with the error messages lately.
Wow, Microsoft’s getting much more casual with the error messages lately.

This starts to point to the challenge of running complex reporting jobs off the secondary replicas. SQL Server is constantly changing the data underneath your queries, and most of the time, it cooperates beautifully. However, if you have a long-running stored procedure (like minutes or hours long), and you want a point-in-time picture of the underlying data while you generate reports on the replica, you don’t want to play around with transactions. Instead, a database snapshot might be a better fit.

If you’d like to run these demos on your own lab, download the scripts here.


SSMS Trick: Edit Large Procedures with the Splitter Bar

SQL Server
11 Comments

Here’s a SQL Server Management Studio trick that comes in super handy when you’ve got long pieces of code. I almost never see anyone use this, and I think the reason is that few people know about it.

When I’m working on a stored procedure, sometimes I want to add in a new variable or a temp table. I declare ’em all at the top of the procedure, but I’m working much farther down in the proc than that.

SSMS Need to add a temp table!
If I scroll up to add the temp table at the top, I have to find my way back here. And I’m *lazy*.

I don’t have to lose my place. I can split the window using a cool, but hard to see feature known as the “splitter bar”.

Finding the splitter bar icon in SSMS
This tiny icon is the “splitter bar”

Drag the splitter bar down. I now have two synchronized views into my procedure.

Dragging down the splitter bar
Dragging down the splitter bar opens up two work “zones” in the same document.

Voila, I can add my temp table in the right area without losing my place.

Editing two zones in SSMS
A great reason to justify that huge monitor you need for productivity.

This feature isn’t specific to SQL Server Management Studio– it exists in lots of other products. (Including Word!) But the feature is hard to spot and most folks just never seem to learn about it. (I had no idea it was there myself until Jeremiah showed it to me a while back, and now I’m addicted to it.)


Dynamic Sorting

SQL Server
36 Comments

While working on some DMV scripts, I came up with a lazy way to have a user definable sort order in the query that seemed like pure genius. I showed it to the team and they’d never seen anything like it before.

The Situation

Users like to be in control. They want to define custom columns, sort orders, and basically drag, drop, and pivot chart their way to victory. While I’m not going to show you how to build custom everything, we can look at a custom sort order.

Let’s start with a simple query:

Possible Solutions

Our users want to be able to define a custom sort order on this query. We could solve this in a few ways:

  1. Writing several stored procedures
  2. Use dynamic SQL to build an ORDER BY

Writing several stored procedures is tedious and error prone – it’s possible that a bug can be fixed in one of the stored procedures but not the others. This solution also presents additional surface area for developers and DBAs to test and maintain. The one advantage that this approach has is that each stored procedure can be tuned individually. For high performance workloads, this is a distinct advantage. For everything else, it’s a liability.

We could also use dynamic SQL to build an order clause. I wanted to avoid this approach because it seemed hacky. After all, it’s just string concatenation. I also wanted to work in the ability for users to supply a top parameter without having to use the TOP operator.

The First Attempt

My first attempt at rocket science looked like this:

Why do it this way? There are a few tricks with paging that you can perform using ROW_NUMBER() that I find to be more readable than using OFFSET and FETCH in SQL Server 2012. Plus ROW_NUMBER() tricks don’t require SQL Server 2012.

Unfortunately, when I looked at the execution plan for this query, I discovered that SQL Server was performing three separate sorts – one for each of the case statements. You could generously describe this as “less than optimal”.

A terrible execution plan featuring three sort operators.
Look at all those pretty sorts!

Even though it seems like SQL Server should optimize out the CASE statement, the obvious thing doesn’t happen. SQL Server has to compute the ROW_NUMBER() for every row in the result set and then evaluate the condition in order to determine which row to return – you can even see this in the first execution plan. The second to last node in the plan is a Compute Scalar that determines which ROW_NUMBER() to return.

I had to dig in and figure out a better way for users get a custom sort option.

Moving the CASE to the ORDER BY

My next attempt moved the custom sort down to the ORDER BY clause:

This ended up performing worse than the first attempt (query cost of 8.277 compared to the original query’s cost of 6.1622). The new query adds a fourth sort operator. Not only is the query sorting once for each of the possible dates, it’s then performing an additional sort on the output of the ROW_NUMBER() operator in the ORDER BY. This clearly isn’t going to work.

I somehow made this query even worse. You should move on.
-50% improvement is still improvement, right?

Getting Rid of ROW_NUMBER()

It seems like ROW_NUMBER() really isn’t necessary for our scenario. After all – I only added it as a trick if so I could potentially add paging further down the road. Let’s see what happens if we remove it from the query:

Right away, it’s easy to see that the query is a lot simpler. Just look at the execution plan:

Despite the file name, this isn't the winner.
A contender appears!

This new form of the query is a winner: the plan is vastly simpler. Even though there’s a massive sort operation going on, the query is still much cheaper – the over all cost is right around 2 – it’s more than three times cheaper than the first plan that we started with.

There’s one downside to this approach – we’ve lost the ability to page results unless we either add back in the ROW_NUMBER() or else use FETCH and OFFSET.

Bonus Round: Back to ROW_NUMBER

While using my brother as a rubber duck, he suggested one last permutation – combine the ORDER BY technique with the ROW_NUMBER() technique:

This ended up being almost as fast as the ORDER BY approach; this query’s cost is only 0.00314 higher than the ORDER BY. I don’t know about you, but I would classify that as “pretty much the same”. The advantage of this approach is that we get to keep the ROW_NUMBER() for paging purposes, there is only one sort, and the code is still relatively simple for maintenance and development purposes.

Check out the plan!

Victory is ours!
Victory is ours!

What Did We Learn?

I learned that trying to be smarter than SQL Server can lead to pretty terrible performance. It’s important to remember that the optimizer reserves the right to re-write. In the first and second case, SQL Server did me a favor by re-writing the query. Our third case is fairly obvious. The fourth example is somewhat surprising – by shifting around the location of theCASE, we’re able to eliminate multiple sorts and gain the benefit of using ROW_NUMBER().


Why Are You Still Using SQL Server 2005?

SQL Server
15 Comments

The year: 2005.

What was happening with the Brent Ozar Unlimited® crew?

I was working on the help desk for a small company while attending Fox Valley Tech College to earn my associate degree. I think I still wanted to go into programming at that point in time! I’d never been to a user group meeting or posted on a forum. I wasn’t even a runner!

Brent took his first full-time DBA gig at Southern Wine & Spirits. He worked on his first cluster and his first 1 TB+ database. He’d never written about Perfmon or attended a conference.

Kendra worked for a dot-com in Seattle. She spent a lot of time with 32-bit servers, automating installs, restores, and configuration of SQL Server for large environments.

The hottest phone of 2005?

Doug was working on a VB6 app for insurance adjusters. At home he had a smokin’ PC with a 1.0 GHz AMD Athlon and a 19” CRT monitor. He and his wife didn’t have kids yet, and he surprised her with a trip to Venice for Christmas.

Jeremiah was (don’t laugh) a developer. While sitting on the bench, he decided to revise the company’s project management software. He rapidly prototyped a new system using SQL Server instead of Access and the .NET Framework with an ORM instead of ad hoc SQL written in VBScript and classic ASP.

The Technology World

Star Wars Episode III was released. YouTube was launched. The Xbox 360 was released.

And, after long last, Microsoft released SQL Server 2005. It had been a long five years since SQL Server 2000. There were drastic changes between the two editions. DMVs (dynamic management views), CLR, hot-add memory, ranking functions, and the XML data type were introduced. Database Mirroring, a new HA feature, was available as of SP1. SQL Server Management Studio: need I say more? These were big changes!

Star Wars III: You know you saw it in the theater

Moving On

Jump in the time machine. 9 years later, I’m writing this blog post. It’s January, and a new year is beginning.

I’ve finished college, I’ve moved up from the help desk (way up), I’ve been to – and spoken at – a couple user group meetings just in the last month, and I’ve run a couple marathons.

Brent? He’s done OK. He’s attained Microsoft Certified Master (MCM) status in SQL Server. He’s gone from DBA to software evangelist to consultant. He’s spoken all over the world.

Kendra has also attained MCM status and become a consultant. She’s learned a lot about hardware, query tuning, and when it pays to upgrade your environment instead of sinking countless people-hours into solving a problem.

Doug is the newest member of the Brent Ozar Unlimited® crew. He’s spent his 9 years learning everything he knows about SQL Server, and becoming a blogger, presenter, and user group leader.

Jeremiah used his software project to set the course for his career. He learned he had a knack for databases, and he ran with it. He too has become a successful consultant, blogger, and speaker.

Technology? It’s changed a bit, too.

Our iPads are now as powerful as Doug’s computer was back in the day. The Xbox One and PlayStation 4 launched this year. Instead of carrying around a phone, a laptop, a camera, and scanner, we carry one smartphone that does everything.

SQL Server, 9 Years, and You

SQL Server has changed dramatically, too!

SQL Server 2012 has been out for well over a year, and SP1 was released in 2013. This release brought some big changes. Internally, the way memory is handled was changed, improving operations and efficiency. There are improved T-SQL functions, such as more windowing functions. AlwaysOn Availability Groups were introduced as the latest HA/DR technology. With a GUI, Extended Events is ready to take over Profiler’s job. Columnstore indexes were introduced to make data warehouse storage and retrieval more efficient.

What’s next? We’re awaiting word on a release date for SQL Server 2014. This release is going to have the usual improvements, and then some. There’s a new method for cardinality estimation. A new engine is being introduced – In-Memory OLTP. Backups can be done directly to “the cloud” in Windows Azure. Clustered columnstore indexes will be updateable. There’s more – check out my recent webcast!

Let Me Ask You a Question

And let’s focus on your job. Are you still using the same laptop you did in 2005? If you’re on call, are you still using the same phone – or, help us all, the same pager – you had 9 years ago? Has your company’s main business application undergone change since then?

2005: HP Compag nx9600 - loaded with a  Pentium 4 650, 2048 MB RAM, 60 GB 7,200 RPM hard drive, and almost 10 pounds
2005: HP Compag nx9600 – loaded with a Pentium 4 650, 2048 MB RAM, 60 GB 7,200 RPM hard drive, and almost 10 pounds

You have a newer laptop. You have a newer phone. The applications have been updated, or changed entirely. Why are you still on SQL Server 2005?

Yes, the process of testing a database upgrade is time-consuming. But it’s well worth it. The changes to the internals and the new features available are nothing but positive. And let’s not forget that in just over two years – Microsoft is currently stating April 12, 2016 – extended support for SQL Server 2005 ends.

Start making plans to upgrade today, and reap the benefits!


You Won the Tribal Awards With Us

Blogging, SQL Server
4 Comments

The Simple-Talk Tribal Award Winners are out, and we won in two categories – Blog of the Year for the Brent Ozar Team Blog, and me as the Person You’d Most Like to Have a Beer With.

See, now we're having a beer virtually. It's almost like - no, it's nothing like. We need real beer.
See, now we’re having a beer virtually. It’s almost like – no, it’s nothing like. We need real beer.

So three things we need to cover here.

First, when we have a beer together, don’t worry about picking the beer. Just grab us a beer. I know I’m all foodie-focused, and yes I do love champagne, but I’m not a snob. I’ll drink everything from dark Guinness to fruity hefeweizens to Corona. If you see me with an empty bottle (what, you think I need a glass?), just bring over another one and let’s talk.

Second, you can get our blog posts via email too. We stopped promoting this a while back when we redesigned the site, but the subscription still exists. One of these days we’ll add it back in somewhere. We’ve still also got an RSS feed if you’re old-school like me. (I’ve been using Feedly as a replacement for Google Reader.)

Last, thank you. Thank you for being here, listening, commenting, and enjoying the journey with us. We still joke around about how this company started as a blog about turtles and pantyhose. We’ve come such a long way over the last twelve years, and I can’t wait to see what the future brings for us all. We’re going to keep right on blogging about how you can improve your database skills, your career, and the community as a whole. That’s what’s important to us, and thanks for making it important to you, too.


What’s the Smallest SQL Server You Should Build?

SQL Server, Virtualization
53 Comments

Before we pick CPUs or memory, let’s start by looking at SQL Server 2012’s licensing costs:

Sticker Price for SQL Server 2012

These are MSRP prices and do not include the extra costs for Software Assurance (maintenance) or any discounts for being a school, non-profit, or those photos you have of Bill Gates.

Physical, Standard Edition – you’ll notice that I went with 2 processors rather than 1. Technically, if you’re dying to save money, you could get away with installing SQL Server on a server with a single CPU, but if you want to save that much money, go virtual and avoid the hardware costs altogether. I could have also gone with 2 dual-core processors, but I only know of one dealer still selling those, and we’re talking about new servers here.

Physical, Enterprise Edition – that’s $6,874 per core, so it adds up fast.

Virtual, Standard Edition – here we’re using just 4 cores, the minimum license size Microsoft allows for a new server. You can build smaller ones (and I do), but as long as you’re licensing with Standard Edition, you’re paying per guest, and the minimum cost is $7,172.

Virtual, Enterprise Edition – if you really need Enterprise features in a virtual machine, you’ll most likely be running multiple SQL Server VMs. In that scenario, you’re best off licensing Enterprise Edition at the host level, and then you can run an unlimited number of SQL Server VMs on that host. (When I say “unlimited”, I’m using it the same way your cell phone company tells you that you have unlimited Internet.)

My failover cluster lab circa 2011. Feel the power of SATA.

When I’m designing servers, I start with the licensing discussion because it helps everyone focus on the real cost of the server. Often folks want to nickel-and-dime their way into 16GB of RAM and a pair of SATA drives, but once licensing costs come into play, they realize architecture here is different. Our goal is to absolutely minimize the number of cores involved – ideally deploying virtual machines as often as we can – and then when we need to go physical, we get serious about the hardware, because this stuff ain’t cheap.

Now Let’s Talk Hardware

Once you’ve picked your licensing and physical vs virtual, let’s talk hardware. I’m using a major server vendor, but the exact brand isn’t important – you can get similar pricing from the hardware vendor of your choice, and this post isn’t about making brand decisions.

Gentlemen, start your caps lock.

Notice how the numbers are displayed as total, licensing, and hardware? That’s how you need to present them to management. When a manager looks at those physical server numbers, the hardware is still clearly the cheapest part of this transaction. If they want to drive costs down, they can start by asking why this SQL Server needs to be physical – the real way to save money here is to drop down to the Virtual column.

Again, these are public sticker prices here based off the hardware vendor’s web site, and don’t include the extra costs of Windows, management software, or volume discounts. These prices also don’t include the cost of the drive space for the data and log files. Your choice between shared storage (SANs), local SSD, or local magnetic drives varies widely between shops, so I’m leaving that out. Let’s just focus on the basic hardware at first.

Physical, Standard Edition – this is a 2-CPU rack mount server with the fastest quad-core processors available right now, 96GB of the fastest memory, a pair of magnetic hard drives for Windows, and a pair of vendor-supplied-and-supported solid state drives for TempDB.

“BUT BRENT! YOU TOLD ME THIS WAS THE SMALLEST SERVER YOU’D DEPLOY, AND THAT SOUNDS LIKE AN INCREDIBLE SPEED MACHINE!!!1! WHAT ARE YOU THINKING? ARE YOU TROLLING ME AGAIN LIKE YOU DID WITH THE FRAGMENTATION POST?”

No, this is actually what I recommend to clients. You don’t waste dry cleaning money on your dad jeans, and you don’t run $14k worth of software on $3k worth of hardware. Besides, you want this thing to last for a few years, right? You don’t want to come running back to this machine again and again trying to fix performance problems that could be fixed with a basic injection of memory.

Physical, Enterprise Edition – the exact same 2-CPU box with the same processors, but upgraded to 384GB of memory and four 400GB SSDs for TempDB.

“BRENT ZOMG YOU MUST BE JOKING THAT’S CRAZY FAST, LIKE KEN BLOCK’S FORD FIESTA FAST. NOBODY NEEDS THAT MUCH MEMORY EVER, BILL GATES TOLD ME SO!!!!ONE”

Yes, my incredulous caps-loving friend, because we need to stay focused on the $55k worth of licensing costs, the dozens (hundreds? thousands?) of employees who rely on this server every day, and the capabilities in Enterprise Edition. Right now, the $55k of licensing you bought is being wasted on crappy hardware that’s more like Stason Lee’s Ford Fiesta.

Virtual, Standard Edition – since you’re licensing by the guest, you don’t have to buy an additional host for every new SQL Server you deploy. You can just mix these in with the rest of your virtualization farm and incur incremental costs. It’s certainly not free, but it’s nowhere near as expensive as a dedicated physical box.

Virtual, Enterprise Edition – since we’re going to license this at the host level, we generally only want to run SQL Server virtual machines on this host. Any other guests here are just wasting my very valuable CPU cycles and memory – at $55k for the licensing, I need to keep this focused just on SQL Server. Because of that, I’ve got a host equipped with the same power as my Physical Enterprise Edition spec – fast cores, high memory, and some local solid state to make a vSAN deployment easier for my VMware admins. (Disclaimer: when building out a real VMware host, I’d obviously tweak this – I’d end up with 10Gb Ethernet and/or FC HBAs, for example, but that depends on each shop’s network infrastructure.)

Yes, it’s another shock-and-awe post from Brent.

If you’re building physical boxes with 16GB of memory, and then you find yourself repeatedly going back to those boxes to do performance troubleshooting, the problem isn’t the app or the server or the memory.

The problem is you, and your old-school 16GB memory fixation.

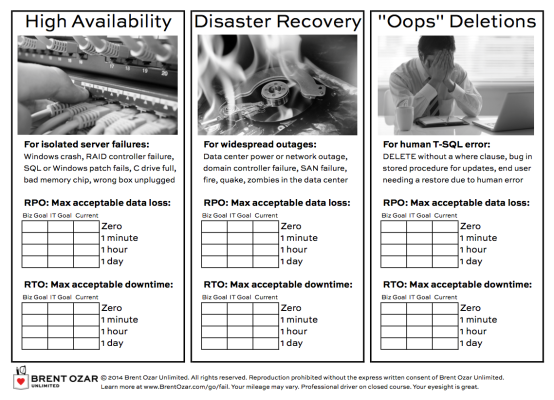
You need to step back and look at the whole picture – licensing, business needs, RPO/RTO – and stop trying to save a few bucks in ways that hurt the server, the business, and your weekends.


SQL Server DMVs that Lie

SQL Server
21 Comments

sys.liesSQL Server has amazing instrumentation. Dynamic management views and functions give you great insight into what’s happening in your SQL Server and what’s slowing it down. Interpreting these views and functions takes a lot of time, but with practice and skill you can use them to become great at performance tuning.

But nothing’s perfect. Some of these DMVs and DMFs have bugs or column names that can be misleading. If you take them at face value, you can end up with egg all over your face.

sys.dm_os_sys_info – hyperthread_ratio column

This DMV is great for quickly checking the last startup time of your SQL instance and finding out if it’s virtualized. But don’t trust sys.dm_os_sys_info to tell you whether or not hyperthreading is enabled on your processors.

The “hyperthread_ratio” column is simply an indication that you have multiple cores per processor and does NOT tell you whether or not they are using hyperthreading.

sys.dm_index_usage_stats – the whole concept of “usage”

This DMV is trying to tell you the truth, but almost nobody understands what it means. This DMV tells you how many times a query used an index in its execution plan– but it doesn’t tell you exactly how many times the index was accessed. Only the number of operators referencing it when the plan was run.

A simple example: I run a query that does a nested loop lookup to retrieve a value from the index PK_Address_AddressID. The query runs once, and in that one run it executes the lookup 30 times. This is counted as one “use” of PK_Address_AddressID, even though 30 lookups were executed.

If a single index appears more than once in an execution plan (due to a subquery, union, etc), then it’ll be counted once for each operator in the plan.

TLDR; index_usage_stats does NOT show you the number of “reads” or “writes” an index is really serving up.

sys.dm_exec_trigger_stats – execution_count and last_execution_time columns

Which triggers on your server are running the most and using the most resources? The sys.dm_exec_trigger_stats DMV seems like it’s perfect to answer that question, but beware.

There’s a bug where execution_count increments due to completely unrelated actions that wasn’t fixed until SQL Server 2012. (I’ve seen the info from this DMV be wonky on 2008R2, and I’ve validated I can’t reproduce this on SQL Server 2014, but I haven’t personally tested on 2012.)

Side note: isn’t it cool that Microsoft makes the Connect bug data public? I’m not sure that I ever would have figured out what contributes to inflating the execution counts on my own!

sys.sysindexes – Rowmodctr

It can sometimes be useful to estimate how many changes have occurred since statistics were last updated on a column or index. This gives you a quick way to guestimate if those stats are maybe not-so-fresh.

Good news on this one– the column isn’t perfectly true, but Books Online has a great rundown of its issues. It lets you know that SQL Server doesn’t really use this counter for its own purposes, and that it’s only roughly accurate at best.

And then it lets you know that SQL Server doesn’t expose column modification counters, so this maybe-pretty-close-guestimate counter is still perhaps better than nothing.

sys.dm_os_performance_counters

I’m a huge fan of SQL Server’s performance counters, wheter you’re querying them via sys.dm_os_performance_counters or looking at them with perfmon.exe.

But there’s a whole host of misleading and just plain outdated counters that will lead you astray. Learn which perf counters to beware in Jeremiah’s post on perfmon.

SQL Server’s Instrumentation is Great

And honestly, so is SQL Server’s documentation. The challenge is that there’s a massive amount to document– and Books Online can’t cover all the nuances of everything. Keep using those DMVs– just keep an eye out for the gotchas.


Top 10 Signs Your SQL Server is Neglected

"That's an interesting configuration you've got there."
“That’s an interesting configuration you’ve got there.”

Sometimes you see someone with toilet paper sticking to their shoe, their shirt tucked into their underwear, or badly in need of a tissue to get rid of whatever that is hanging out of their nose. It’s only right to find a discreet way to let them know they should do some quick cleanup before they get completely embarrassed.

The same embarrassing “oops” exist for SQL Server. There are some practices and configurations which just make it look like the DBA may not have learned about this “internet” thing yet.

But, truthfully, it’s very simple to accidentally embarrass yourself. Here are the top 10 (well, 11) signs that your skills or your SQL Server are badly in need of an update:

Even if you know better, have you checked your servers to make sure that you don’t have toilet paper on your shoe without realizing it? Run our free sp_blitz® script to check for most of these issues, and more.


How to Cache Stored Procedure Results

SQL Server, T-SQL
23 Comments

Say you run an online store, and on each item’s page, you need to show related items that people purchased. Let’s take an Amazon page for my favorite rechargeable AA batteries:

Frequently Bought Together

In a perfect world, we would cache this data in the web/app tier – but back here in the real world, sometimes our developers build stored procedures to fetch this kind of data, and the stored procedure ends up getting called way too often.

To solve it, let’s build a caching layer into our stored procedure.

Here’s the pseudocode of how our stored procedure usually works:

Original Stored Procedure

I’m using a really simple stored procedure, but this approach works best when you have a complex stored procedure that does a lot of heavy lifting – calculations, querying big tables, aggregations, etc.

Instead of directly doing all the heavy work, check this out:

Implementing Caching, Part 1

I’ve introduced a new table here – Cache.dbo.GetRelatedItems. I created a new database called Cache, and I keep it in simple recovery mode. I can use a totally different backup strategy for this database – perhaps not even backing it up at all.

Cache-Table

The Cache.dbo.GetRelatedItems table has exactly the same columns that are normally returned by usp_GetRelatedItems, plus the input field. In this case, our stored procedure has an input field of ItemID, and it returns RelatedItemID and RelatedItemName, so the table would look like the one shown at right.

Rocket surgeon readers will note that I added an ID field to give the table something unique. They will also notice that I didn’t add a DatePopulated or DateCached field – depending on my business needs, I would probably just truncate this table every night. In the case of related items in an e-commerce store, I might only truncate it every week, and I’d want to do it right before a really low load period so that the cache could gradually refresh. This outright-truncation technique is less efficient for refreshing the cache, but it minimizes the locking required by deletes. In a caching setup, I’m worried about concurrency here.

When implementing a solution like this, I usually do a lot of A/B performance testing to find the right clustered index for the table. Typically each caching table has no non-clustered indexes, and has just one clustered index designed to produce the fastest range scans for the number of parameters for the stored proc. (Before somebody posts a comment asking for that strategy, no, I’m not blogging that, because it’d take me a day, and I’m lazy.)

If you choose not to back up the Cache database, your code should not rely on the existence of objects in it. It should start by checking to see if the Cache.dbo.GetRelatedItems table exists, and if not, create it. That way if you fail over to your DR site and the Cache database is empty, your queries won’t fail.

I’ve over-simplified the stored procedure a little, though – something actually has to populate the cache table. There’s two ways I could do it: externally, like a SQL Agent job or an SSIS process, or internally – inside the stored procedure itself. Let’s code that:

Caching Part 2: The Cachening

We start by checking the cache table for results, and if we don’t find any, we add them.

I’m cringing as I write this because I can hear the screams of performance tuners. Yes, I’m adding additional write load on the SQL Server – keep in mind that I only use this approach when I’m faced with:

  • A very work-intensive but read-only stored procedure
  • Called very frequently (hundreds or thousands of times per minute)
  • Whose results change less than once a day (or where we’re not concerned about real-time accuracy)
  • A business that needs immediate speed and can’t wait for developers to implement a caching layer

As soon as I deploy a solution like this and the business pain goes away, I immediately start working with the developers on a better long-term solution. This solution is an emergency band-aid to get the business up and running, but it still incurs load on the SQL Server for writing the caching results, getting locks, and running the stored procedure. This is when I start talking to the developers about caching in the app tier, and here’s my favorite resources on that:


Meet Doug Lane (Video)

Company News, SQL Server
0

Our mysterious employee #2 – where did he come from? How did he get into SQL Server? What does he want to learn in his first year at work with us? The answers to those questions, and more, will reveal themselves in this webcast recording:


Q: Can High MaxDOP make a query SLOWER?

SQL Server
13 Comments

Answer: Yep, sometimes it can.

I used to think that higher degrees of parallelism followed a law of diminishing returns– you could add more threads, but the benefits would taper off. But it’s a bit more complicated than that. Microsoft’s recommendation to be careful when setting maxdop to values over 8 is a warning worth heeding.

Lowering maxdop can cut CPU without sacrificing duration

We tend to think that reducing the number of threads available MUST make a query slower– but that we sometimes need to do it so other queries can run concurrently.

It’s great to support concurrency, but lower DOP doesn’t necessarily mean a longer runtime, even if it does lower CPU consumption. Here’s a simple example of an OLTP query run with two different DOP settings. CPU time and duration were measured using “SET STATISTICS TIME ON”. For both runs all data was in memory (no physical reads or read aheads).

OLTP Query MaxDOP

Duration in both cases was around 700 milliseconds. The lower DOP didn’t make execution time longer. It changed the way SQL Server ran the query, but it cut overall CPU usage while keeping the runtime about the same. This was great in this case, because the query in question needed to run frequently on an OLTP system.

Higher maxdop can slow down large queries

In the case of large queries, higher DOP can slow down query execution. The impacts here vary a lot by processor, memory type and amount, and whether or not your SQL Server is virtualized— not to mention based on the execution plan of the query in question.

Here’s a totally different query tested on totally different hardware. In this case the query reads in hundreds of gigabytes of data, but as in the previous example all tests were run against a “warm” cache and were not doing physical reads or read ahead reads. The server used in this test had 8 physical cores per NUMA node.

Large Query MaxDOP

Changing maxdop changes query plans

When you tune maxdop, it’s worth watching the execution plans for the top queries on your server. I’ve seen changing the amount of threads available for a query make the optimizer change its mind about how to run a query immediately– and been able to reproduce it switching the plan back as soon as I hint a different DOP.

Since impacts can be complicated I recommend changing maxdop rarely and monitoring your plan cache and wait stats for at least a week or two after the change.

Parallelism is a good thing

Don’t get me wrong– I ain’t saying parallelism is bad for SQL Server. Multiple threads can make many queries faster!

One of the gotchas with SQL Server is that the default value of “0” for the “Max Degree of Parallelism” setting can lead to poor performance– because it lets SQL Server use all your processors (unless you’ve got more than 64). Fewer threads can not only reduce CPU usage, but may also be faster.

So check your maxdop settings, and keep reading to learn more about CXPACKET waits.


Vote for yourself in the new Tribal Awards.

SQL Server
0

When you vote for us in Simple Talk’s new Tribal Awards, you’re voting for yourself.

Best Free Script – sp_Blitz® – Sure, I started this all by myself a few years ago, but it’s grown into something huge. Scroll down through the change log and get a load of the dozens of contributors who have helped make this tool amazing. I even hear from consultants who ask me, “Are you sure it’s okay to use this thing in my job?” Of course! We’re all in this together, and we’re all trying to make SQL Server easier for everybody.

Blog of the Year – www.BrentOzar.com – To me, the comments are the most fun thing about a blog. Since the first post 11 years ago, we’ve had 16,650 comments (and no, that doesn’t include the spam). This place is fun because you guys take part, and even when you say crazy stuff, at least I get to use my witty retorts.

Person You’d Most Like to Have a Beer With – Brent Ozar – Let’s be honest – you guys only nominated me because you know that whenever I’m drinking beer, I’m also ordering tater tots. It’s not that you want to have a beer with me – you want to eat my tater tots. You’re just being greedy here.

So go vote, and we all win.


How Would You Change Windows Azure SQL Database?

Cloud Computing, SQL Server
33 Comments

This artist formerly known as SQL Azure is a cloud service something akin to Microsoft SQL Server.

SQL Azure is still under legal drinking age.

When it first came out, it had a lot of challenges – a small subset of T-SQL commands and datatypes, inability to take backups, and absurdly small database sizes.

But much like Emma Watson, when your back was turned, WASD matured into a surprisingly capable platform. However, most of us still aren’t using it, preferring to run SQL Server on-premise.

This leads to an interesting question: what would Microsoft have to do to get you into Windows Azure SQL Database?