It’s easy to find problem queries on your SQL Server after they’ve happened. You can open your favorite monitoring tool or look in the plan cache. Those options are great for finding things after they’ve happened, but what if you want to find problems as they happen?
Server Side Trace
You could set up a SQL Server Server Side Trace. This is an acceptable solution if you’re using SQL Server 2008 or earlier. There are a few problems with this approach.
Problem the first – the SQL Server Profiler UI is less than beautiful. The GUI interface is somewhat cumbersome and the scripting interface is hilariously bad. To make matters worse – to only capture a single query requires string based filtering. There’s a plan handle property available in profiler, but it’s not available for TSQL or stored procedures.
As much as I like string matching in T-SQL (hint: I don’t), I think it’s fair to say that Profiler/Server Side Trace are best avoided unless you’re using SQL Server 2008 or earlier.
Extended Events
Extended events are nowhere near as hard as you’d think. Trust me on this. How do I know? I set up an Extended Events session to grab a particular query.
Here’s what you do:
- Create a crappy stored procedure. Use your imagination.
- Run the stored procedure a lot.
- Grab the
query_hashfor that stored procedure. The easiest way
I’ve found to do this is to use our plan cache query to identify it. Myquery_hashis0x2B42702322C10821. What’s yours? - Create an extended events session to capture that specific query hash.
Step 4 isn’t as easy as it sounds. Astute readers will note that I never said this was easy, just that it’s not as hard as you would think.
Even though the query_hash is stored as a hexadecimal in SQL Server, Extended Events would prefer to see an unsigned 64-bit integer. To get this magic number, take your query_hash and cast it as either a BIGINT or a DECIMAL(20,0):
|
1 2 |
SELECT CAST(0x2B42702322C10821 AS BIGINT); /* my magic number is 3117177188303046689. */ |
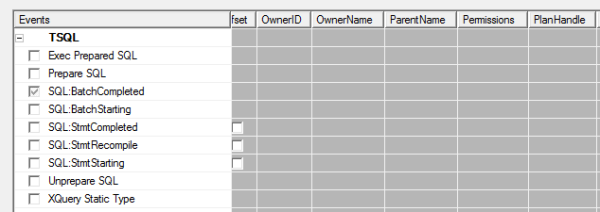
Once you convert the query_hash to a magic_number, create your Extended Events session. I chose to capture the sp_statement_completed and sql_statement_completed events and a number of server level events like time, app name, and client host name. Here’s what it would look like capturing this to a file:
|
1 2 3 4 5 6 7 8 9 10 11 12 13 14 15 16 17 18 19 20 |
CREATE EVENT SESSION [query hash] ON SERVER ADD EVENT sqlserver.sp_statement_completed( ACTION(package0.collect_system_time, sqlserver.client_app_name, sqlserver.client_hostname, sqlserver.database_name) WHERE ([sqlserver].[query_hash]=(3117177188303046689.))), ADD EVENT sqlserver.sql_statement_completed( ACTION(package0.collect_system_time, sqlserver.client_app_name, sqlserver.client_hostname, sqlserver.database_name) WHERE ([sqlserver].[query_hash]=(3117177188303046689.))) ADD TARGET package0.asynchronous_file_target (SET filename = 'C:\temp\XEventSessions\query_hash.xel', metadatafile = 'C:\temp\XEventSessions\query_hash.xem', max_file_size=5, max_rollover_files=5) WITH (MAX_DISPATCH_LATENCY = 5SECONDS); GO |
Once you have that up and running, you should be able to start the session, if it isn’t already started, by running:
|
1 2 |
ALTER EVENT SESSION [query hash] ON SERVER STATE = START ; |
Just like that, you’ll be capturing your terrible queries to disk where you can mine the extended events files for gold and glory at your own convenience. If you want to query it, it’d look something like this:
|
1 2 3 4 5 6 7 8 9 10 11 12 13 14 15 16 17 18 19 20 21 22 23 24 25 26 |
WITH events_cte AS ( SELECT DATEADD(mi, DATEDIFF(mi, GETUTCDATE(), CURRENT_TIMESTAMP), xevents.event_data.value('(event/@timestamp)[1]', 'datetime2')) AS [event time] , xevents.event_data.value('(event/action[@name="client_app_name"]/value)[1]', 'nvarchar(128)') AS [client app name], xevents.event_data.value('(event/action[@name="client_hostname"]/value)[1]', 'nvarchar(max)') AS [client host name], xevents.event_data.value('(event/action[@name="database_name"]/value)[1]', 'nvarchar(max)') AS [database name], xevents.event_data.value('(event/data[@name="duration"]/value)[1]', 'bigint') AS [duration (ms)], xevents.event_data.value('(event/data[@name="cpu_time"]/value)[1]', 'bigint') AS [cpu time (ms)], xevents.event_data.value('(event/data[@name="logical_reads"]/value)[1]', 'bigint') AS [logical reads], xevents.event_data.value('(event/data[@name="row_count"]/value)[1]', 'bigint') AS [row count] FROM sys.fn_xe_file_target_read_file ('C:\temp\XEventSessions\query_hash*.xel', 'C:\temp\XEventSessions\query_hash*.xem', null, null) CROSS APPLY (select CAST(event_data as XML) as event_data) as xevents ) SELECT * FROM events_cte ORDER BY [event time] DESC; |
Cleaning Up After Yourself
Once you’re done watching a specific query or queries, make sure you clean up after yourself. There’s no reason to add extra load to SQL Server when you aren’t watching. Make sure to stop and remove your Extended Events session:
|
1 2 3 4 5 6 7 |
/* Stop the Extended Events session */ ALTER EVENT SESSION [query hash] ON SERVER STATE = STOP; /* Remove the session from the server. This step is optional - I clear them out on my dev SQL Server because I'm constantly doing stupid things to my dev SQL Server. */ DROP EVENT SESSION [query hash] ON SERVER; |
Augment Your Techniques
This won’t replace any other techniques that you’re using to find poorly performing queries. However, you can use this technique to find problem queries as they’re happening.
Different monitoring techniques provide you with a different view of the data. Our plan cache query shows you a historical record of what’s been going on, but it can only show so much. If a query has been run 14,400 times over the last 24 hours, does that mean it’s been run 10 times a minute for that entire period or is there a period of activity where that query gets run 1,440 times a minute for 10 minutes straight?
This isn’t going to replace the need for other tools you have at your disposal. It’s just another way to get the job done.