Update on 5/25/2014: At least parts of this improvement have been backported to SQL Server 2012 SP1 CU 10. Read the KB here. After applying CU10 to SQL Server 2012 SP1, the test query shown in this post performed as it did against SQL Server 2014.
I was excited to read Bob Dorr’s recent post about a hidden gem in tempdb performance in SQL Server 2014. I had a copy of SQL Server 2014 Developer Edition handy, as well as a workload that beat up tempdb, so I decided to do a quick performance test. I wanted to find out how much this might help performance when tempdb was already on SSDs.
The tempdb improvement (in a nutshell)
There’s been a myth for a long time that if you populate a temp table or table variable, the data just resides in memory. This hasn’t been true in the past, but in SQL Server 2014 temporary operations are not as “eager” to cause disk IO.
The test setup
I ran a simple workload using HammerDB. My workload “warmed up” for one minute, then ran for three minutes. The workload ran with 1 watcher thread and 6 worker threads. Each worker thread selects data into a temp table as fast as it possibly can, over and over again. The workload isn’t much like a normal production workload: it just beats up tempdb.
I ran this test a few times independently against two VMs on my laptop. Both VMs have 6000MB RAM, 4 vCPUs, Windows Server 2012 R2, and all their storage is on SSD.
- Mister: SQL Server 2012 SP1
- ChairmanMeow: SQL Server 2014 RTM
Both SQL Server instances were configured with ‘Cost Threshold for Parallelism’ set to 50, which effectively makes this workload single threaded. Each instance had 40 equally sized tempdb data files configured. (That’s a lot more than you’d usually have with 4 vCPUs! This is a contrived workload with an especially high amount of tempdb contention.)
During each test run, I took a 30 second sample of waits and file io stats using sp_BlitzFirst®. (I ran: exec sp_BlitzFirst @ExpertMode=1, @Seconds=30)
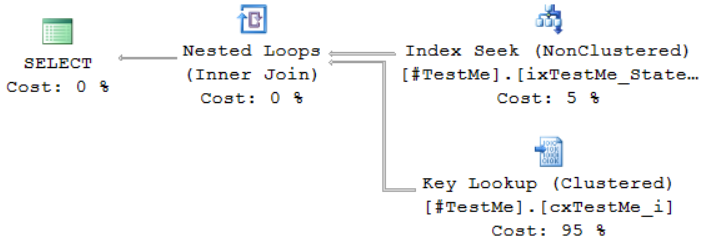
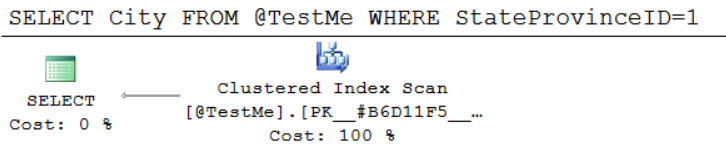
The Test Query
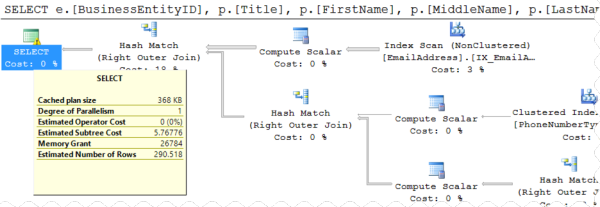
The workload runs this test query. The execution plan costs out as 16.71 on both of my instances and the plan is the same shape.
|
1 2 3 4 5 6 |
SELECT TOP(5000) a.name, replicate(a.status,4000) as col2 into #t1 FROM master..spt_values a CROSS JOIN master..spt_values b; GO |
How did the instances do?
I got quite consistent results over multiple tests. Here’s a comparison:
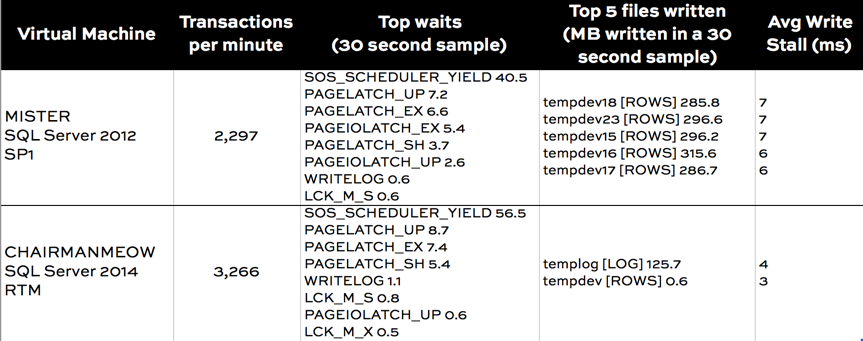
Wait stats comparison
My SQL Server configuration isn’t perfect. Sure enough, there’s still some tempdb contention: I’ve got PAGELATCH waits because my queries are fighting over PFS and GAM pages.
PAGEIOLATCH show up more in the SQL Server 2012 sample. That’s the first tip that disk access is more of an issue.
MB written by file comparison
The real validation on what’s happening in this feature comes in on the two columns on the right. sp_BlitzFirst® peeks at your sys.dm_io_virtual_file_stats DMV, and when you run it in ExpertMode it lets you know the top 5 files you’ve read and the top 5 files you’ve written to.
We can clearly see that in SQL Server 2012, I was doing a lot of write IO. That write IO was going to every single tempdb file evenly (that’s expected if they’re evenly sized), as well as to the tempdb log. My average write latency was 7 ms, which isn’t really bad given what I was doing to my SSDs.
And sure enough, that IO just about disappears in SQL Server 2014! That adds up to a notable improvement in transactions per minute.
You’ll really love this feature if you can’t put SSD underneath all of your tempdb databases. But even for those who’ve already tuned up their storage, this feature should help you out.