Blog

#SQLPASS Speakers: Here’s How to Improve Your Session

This year there’s a couple of special challenges you need to keep in mind for projecting your beautiful knowledge out to the audience.

Fixing the Contrast Levels

PASS distributes a custom PowerPoint template – looks great this year – but the contrast level is extremely light. The template uses light blue and light gray text on a white background. In a bright room with less-than-perfect projectors, this is going to wash out pretty badly, and people won’t be able to read your brilliant nuggets of wisdom.

To fix this, open the slide template and click View, Master, Slide Master. Mine is Office for the Mac, but the general idea will hold true across all versions of PowerPoint:

PASS Summit Template - Slide Master
PASS Summit Template – Slide Master

Click on the slide title (“Click to edit Master title style”) so that the whole entire title box is selected, not the text in the title, and click onto the Home tab of the ribbon. From there, you can change the font color:

Changing the font color

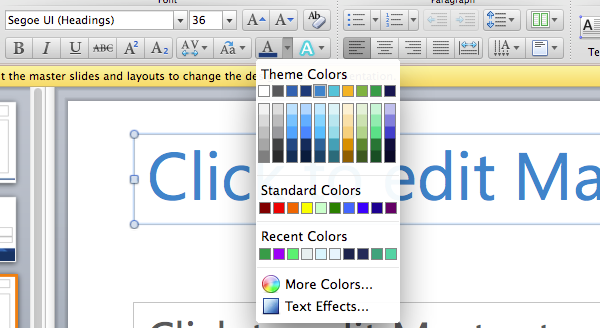
Just use a darker version of the existing color – that way the slides will still look matchy-matchy, but just have more contrast.

Repeat the same process with the content box as well, turning it into a darker gray or black.

This is totally okay – Lana Montgomery of PASS HQ writes, “Feel free to adjust the depths of the colors for the blue and grey for your presentation.”

Next: That Widescreen Thing

This year’s slide template is widescreen – 16:9 aspect ratio – and the projectors are widescreen as well. The minimum resolution will be 1280×720.

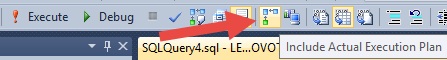
This is a fantastic resolution for slides, but if you’ve got demos, you need to make sure to test them at the 1280×720 resolution. There are some parts of SSMS’s user interface where buttons disappear at just 720 pixels of vertical resolution, for example. If you’re using a virtual machine, and you’re sacrificing some pixels at the top and bottom for toolbars, this may be even worse.

If you’re doing query demos, you may also want to take the widescreen effect into account. Often I run SSMS in a 4:3 aspect ratio, like 1280×1024, and there’s plenty of space to put the query at the top and my execution plan at the bottom. In a widescreen aspect ratio, that’s not the case – you’re better off putting the query in a pane on the left, and the plan in a pane on the right.

Knock ’em dead! And while you’re prepping, ask these 51 questions about your session.


Why Archive Data?

Oracle, SQL Server
12 Comments
The data story so far

Meet Margot. Margot is an application developer who works for a small company. Margot’s application collects and generates a lot of data from users including their interactions with the site, emails and texts that they send, and user submitted forms. Data is never deleted from the database, but only a few administrative users need to query historical data.

The database has grown considerably because of this historical data – the production database is around 90GB but only 12GB or so is actively queried. The remaining data is a record of user activity, emails, text messages, and previous versions of user data.

Margot is faced with an important decision – How should she deal with this increase in data? Data can’t be deleted, there isn’t budget to upgrade to SQL Server Enterprise Edition and use table partitioning, and there’s a push to move to a cloud service to eliminate some operational difficulties.

Using Partitioned Views to Archive Data

A Partitioned View
A Partitioned View

One option that Margot has read about is “partitioned views” – this is a method where data is split into two or more tables with a view over the top. The view is used to provide easy access to all of the information in the database. Storing data across many tables means DBAs can store data in many different ways – e.g. compressed tables or filegroups and tiered storage.

There’s a downside to this approach – all of the data is still in one database. Any HA solutions applied to the live portion of the data set will have to be applied to the entire data set. This could lead to a significant cost increase in a hosted/cloud scenario.

Archiving Data with a Historical Database

Archive this!
Archive this!

The second thing that sprang to mind was creating a separate archival database. Old data is copied into the archival database by scheduled jobs. When users need to run historical reports, the queries hit the archival database. When users need to run current reports, queries are directed to the current application database.

Margot immediately noticed one problem – what happens when a user needs to query a combination of historical and current data? She’s not sure if the users are willing to accept limited reporting functionality.

Archiving Data with Separate Data Stores

One active database. One archival octopus.

A third option that Margot considered was creating a separate database for the data that needed to be kept forever. Current data would be written to both the live database and the historical database. Any data that didn’t need to be ever be in the current database (email or SMS history) would only be written to the historical database.

Although this made some aspects of querying more complex – how could row-level security from the primary database be applied to the historical database – Margot is confident that this solves the majority of problems that they were facing.

This solution would require application changes to make querying work, but Margot and her team thought it was the most flexible solution for their current efforts: both databases can be managed and tuned separately, plus the primary database remains small.

Other Ideas?

Not every database needs to scale in the same way. What ideas do you have to solve this problem?


Changing SQL Server Editions: Standard, Enterprise, Evaluation and More

SQL Server
71 Comments

“Enterprise Edition was installed for SQL Server, but it turns out that we only have a license for Standard Edition. Is that an easy change?”

I see this question a lot. The answer is well documented by Microsoft, but it seems to be really hard for folks to find! If you’d like to go straight to the source, everything I’m going to highlight here comes from the MSDN page Supported Version and Edition Upgrades.

Sometimes Edition Upgrades (SKUUPGRADES) are simple

If you want to make a supported edition change, it takes a little downtime but isn’t all that tricky. You run SQL Server Setup and just follow the steps in the Procedure section here.

Edition Upgrade SQL Server 2012
“How complicated can this be?” … Famous Last Words

Protip: The Edition Upgrade GUI lets you see and copy the current license key for that instance of SQL Server. (No, I’m not showing a screenshot with my key in it!)

You can also do this from the command line using the SKUUPGRADE parameter (and back in SQL Server 2005 and prior, that was your only option).

Changing the edition causes some downtime, but it’s a simple procedure. The fact that it’s relatively simple isn’t an excuse to skip testing: always run through this outside of production first so you know exactly what to expect. And always, always, always take your backups and make sure they’re on separate storage before you start. Document everything you need to know about your configuration just in case something goes wrong and you’ve got to reinstall.

It’s pretty simple. Except when it’s not supported.

What Goes Up Does Not Necessarily Come Down

The way I usually remember the rules is that you can typically change from a cheaper version to a more expensive version. But you can’t necessarily go from a more expensive version to a cheaper version.

So if you have SQL Server Enterprise Edition and you want to change to Standard Edition, a simple SKUUPGRADE isn’t going to work for you. (If you have the “Evaluation” Enterprise Edition, you’re probably OK though!) Check the chart for what you want to do to make sure.

Clusters are Special. (Not in a good way in this case.)

A lot of the confusion is around SQL Servers installed on failover clusters. You have to scroll waaaaay down on that page to see this:

The fine print on upgrading failover clusters

Ouch! Changing the edition of a clustered SQL Server is not a simple thing.

While I’ve made you uncomfortable, check out KB 2547273, “You cannot add or remove features to a SQL Server 2008, SQL Server 2008 R2, or SQL Server 2012 failover cluster”.

What if I Don’t Know What Edition I Need?

Typically the answer here is to use Evaluation Edition. But if you’re running a failover cluster, be careful– as you can see above, you can’t easily change from Enterprise Evaluation to Standard Edition.

Will CHANGING THE EDITION Reset My Service Packs?

I believe this used to be true on SQL Server 2005– if you changed editions, you’d have to reapply service packs and cumulative updates afterward.

I just ran a test on SQL Server 2012 and upgraded from Developer Edition to Enterprise Edition on a test instance, and I still had version 11.0.3431 (Service Pack 1, Cumulative Update 10) after the upgrade.

But like I said, test this out with your version, even if it’s using a quick virtual environment that you don’t keep after the change has been completed successfully. There’s other real perks to doing this as well, such as making sure that your license keys really work and are the edition you think they are!

What If My Change Isn’t Supported By the GUI / Upgrade Installer?

In this case, you need to uninstall and reinstall SQL Server. It’s going to take longer and cause more downtime. You’ll have to reconfigure everything and reinstall service packs. (It’s not actually that much extra work, because you were going to take those backups and document all the special configuration just in case, right?)

What if I Can’t Take Much Downtime?

If downtime is a real issue, don’t make this change in place. Set up a new SQL instance, test the heck out of it, get it into monitoring and plan a way to migrate to it with limited downtime using something like Database Mirroring. (If you’re considering this, read that link– it mentions that mixing editions between database mirroring partners isn’t supported by Microsoft. You can’t set it up through the GUI, you have to use TSQL. If that makes you paranoid, you could do the migration with log shipping.)


The Top 3 Trickiest Features in SQL Server (Twitter Poll)

SQL Server
7 Comments

I’ve worked with a lot of features in SQL Server. I know what I think is tricky and more difficult than it looks like at first. But experiences vary, right?

So I asked the Twitterverse, “What are the Top 3 Trickiest Features in SQL Server?”  Here’s what I heard back.

#1: Replication

SQL Server Replication “wins” the top spot for being mentioned by the most people. Maybe it won because it’s touched the hearts of the most people since it works with Standard Edition. Maybe it’s just been in the product long enough to have tricked lots of us?

#2: Availability Groups

Coming in second is SQL Server Availability Groups. These may have only been with us since SQL Server 2012, but their complexity has impressed quite a few people already.

#3: DBAs

The number three place goes to a feature I hadn’t thought of myself… database administrators themselves. I laughed out loud when I saw these tweets, but, well, there’s some truth in it. We are a tricksy bunch!

Honorable Mentions

Other top tricky features that came up:

  • Service Broker (guessing they worked at MySpace)
  • Security
  • SSIS (oh, the clicking! the clicking!)
  • SQL Server Clustering
  • PIVOT
  • XML
  • CLR
  • Active Directory (ah, Kerberos authentication, you devil you)
  • Resource Governor (someone actually used Resource Governor!?!?!)
  • Extended Events
  • SAN Administrators
  • Enterprise Architects

My Personal Top 3

Turns out I’m not so different from the Twitter community. My personal top three trickiest features are: Availability Groups, Replication, and Service Broker. (I’m not really all that into queues in SQL Server, but I do like Event Notifications, which use the Broker framework.)

What are yours?


Using Triggers to Automatically Add Indexes

Let’s say you’ve got a vendor application that creates tables, loads them, queries them, and drops them all the time. You can’t change the code.

The tables involved desperately need an index in order to go faster, and they’re your biggest performance bottleneck.

Enter DDL triggers. Regular DML triggers fire when you insert/update/delete rows in a table, but DDL triggers fire when you create/alter/drop tables or databases. You may remember them from the last time Jeremiah and I played with them – way back in 2008!

The below code fires whenever a table is created, checks to see if the table name is like CustomerExport%, looks for the existence of a CustomerName field (which I probably should have done with XQuery, but I’m lazy), and if it exists, creates an index on the CustomerName field:

And when Kendra found out what I'd done, she broke my arm.
And when Kendra found out what I’d done, she broke my arm.

Voila – automatic indexing, and a lifetime of regret and careful debugging. See, there’s a boatload of ways this can break:

No datatype checks. In the above example, I’m not checking for datatype. If the vendor changes CustomerName to an NVARCHAR(MAX), my table creation will bomb with an error that CustomerName “is of a type that is invalid for use as a key column in an index.”

Queries can fail. We had some queries fail (particularly SELECT INTOs) because the table schema changed before the rows started going in. Multi-statement transactions may also fail because the whole transaction will get rolled back if the trigger fails.

No duplicate index checks. If the vendor later decides to add an index as part of their code, I could be creating a duplicate index, and now slowing my processes down. Or they might just change the way they do exports, and no longer need the index at all – and I won’t be able to catch that since the tables and indexes appear and disappear so fast. I could actually set up another DDL trigger looking for table drops of these same names, and log index usage information to a table, then periodically analyze that information to see if I needed different indexing.

Lots of risk and work here. Let’s not even go into how incredibly hard it is to catch these issues when the tables and the query plans keep disappearing from memory – it’s not even enough to just grab the slow queries, but you also have to grab the tables and their contents so you can reproduce the queries to figure out the right index to build. Obviously this isn’t a solution everyone should go implement on their vendor apps, particularly mission-critical ones, but it’s an example of how far you can go to tune vendor code when other options have been taken off the table.


Learning By Doing: How We’re Innovating In Our Seattle Course, “Make SQL Apps Go Faster”

SQL Server
2 Comments
A team challenge in our Chicago classes in 2013
A team challenge in our training in Chicago, 2013

As teachers, we’re always working to maximize the skills that students can learn in a given amount of time.

Many students “learn by doing.” But what’s the best way to do this?

You may immediately think of lab exercises as an option. But labs are treacherous to implement in a classroom environment: ten minutes after you’ve begun, the person next to you is suffering from unexpected reboots, you’re not sure why the scripts aren’t working properly for you, and the fellow behind you is somehow already done. Even under the best of circumstances, labs don’t move at the same pace for everyone. By lunchtime, you’re bored and frustrated.

We’ve got a better way.

We’re building two very cool Challenges in our two day Seattle course, Make SQL Apps Go Faster, which will be held just prior to the SQL PASS Summit in 2014.

Challenge 1: Learn to Diagnose a Server

We work with SQL Server in two different ways: we’re consultants and teachers. The two parts of our business enrich one another. Through consulting we constantly expand our experience and understanding of the real challenges people face. In the classroom we’re always refining our methods to help people learn faster. Now we’re bringing these two things even closer together.

In our upcoming two day course in Seattle, “Make SQL Apps Go Faster”, we’re using challenges to help our students learn more and really engage with the class. For the first day, students will get dynamic management view information for a SQL Server with a problematic workload. It will contain information just like you can gather with our free tools in the real world:

Your challenge: write down what you’d do to tackle this environment.

We won’t give away all the answers. We’ll train you on these topics using slightly different examples so that you still get to figure things out on your own! Then at the end of the day we’ll go over the challenge, talk through your solutions, and compare them to our suggestions and experience working with SQL Servers around the world.

Challenge 2: Digging into TSQL, Queries, and Execution Plans

On the second day of the training, you get to specialize on query tuning challenges: you have 3 queries that you need to make faster. You’ll get the TSQL, schema, indexes, and execution plan information for all three queries and your challenge is to figure out how YOU would make these faster.

Always get involved in your learning and question everything. (Isn't that what my face says here?)
Always get involved in your learning and question everything. (Isn’t that what my face says here?)

On this day you’ll watch Kendra, Brent, and Jeremiah dig in deep to tune queries and indexes and delve into more advanced features of execution plans in SQL Server.

At the end of the day you’ll revisit the challenge. Would you make any choices differently? How do your ideas compare to the solutions we came up with? Can you make the queries even faster than we can!?!

Get involved in your training

Consulting and teaching have taught me a huge lesson: people learn better and faster when they’ve got something fun to work on. We have a blast teaching people about SQL Server — join us in Seattle and take the challenge.


What’s New in Oracle 12.1.0.2?

Oracle
0

Oracle 12.1.0.2 was recently released with some fanfare. One of the most talked about features is Oracle Database In-Memory, but there’s more to this release than just columnar storage.

Big Investment in Data Warehousing

Almost all of the new features reflect an increased focus on data warehousing. This is similar to recent SQL Server releases and, indeed, most mainstream database releases. Different vendors are betting on BI and Oracle’s most recent release is no exception.

Full Database Caching

Caching data in memory can avoid costly disk-based I/O. By default, databases will cache frequently accessed data. There’s a setting in Oracle called the small table threshold – scans of tables larger than the_small_table_threshold will use a portion of memory that should age out faster. This idea (in SQL Server it’s called page disfavoring) exists to prevent large table scans from clearing out database server memory.

What if you want those tables to stick around in memory? Modern servers can hold huge amounts of memory and with Oracle RAC, you can scale your buffer pool across multiple servers.

The full database caching feature changes this behavior. Once full database caching is enabled, Oracle will cache all data in memory as the data is read.

It’s important to note the guidance around this new feature – it should only be used if the logical size of the database is no bigger than 80% of available memory. If you’re using Oracle RAC, DBAs need to be doubly careful to make sure that the workload is effectively partitioned across all RAC nodes. Read more about the features and gotchas in the Oracle Database Performance Tuning Guide.

Who needs disk when you have memory?

Big Table Caching

Speaking of larger tables, the new patch includes a feature called automatic big table caching. If you have more data than you have memory, this feature seems a lot safer than full database caching.

Rather than attempt to cache all data in memory, big table caching sets aside a portion of the buffer pool for caching data. The DBA sets up a caching target (DB_BIG_TABLE_CACHE_PERCENT_TARGET) and up to that percentage of memory will be used for caching really big tables.

Like the full database caching feature, this works with single instances of Oracle or Oracle RAC. There are, of course, considerations for using the feature. The considerations are documented in the VLDB and Partitioning Guide.

In-Memory Column Store.

I’ve already covered Oracle’s In-Memory Column Store. There are some additional features that have been announced that make the In-Memory Column Store feature a bit more interesting.

A new data flow operator has been added to Oracle: the VECTOR GROUP BY. This new operator enables efficient querying for In-Memory Column Store tables. Although no new SQL operators have been added to Oracle for theVECTOR GROUP BY, it’s possible to use query hints to control optimizer behavior. Six new hints have been added to push the optimizer in the right direction.

Attribute Clustering

In the Oracle world, tables are almost always heaps. Clustering is done only rarely and in special circumstances.

Attribute clustering lets the data warehouse designer specify a table order based on one or more columns of the table. So far, this sounds like something that you could already do. It is also possible to use join attribute clustering to cluster on columns connected via a foreign key relationship. The data warehouse designer, or even the DBA, can modify table structure to cluster a fact table based on dimension hierarchy.

An additional feature called interleaved ordering uses some pretty advanced storage mechanisms to get better I/O out of an attribute clustered table. Interleaved clustering makes it more efficient to perform queries where you may not know the search predicates, or where search predicates may vary over multiple columns (sounds like a dimensional model to me).

There are a few upsides to attribute clustered tables – they require fewer (or no) indexes, they may require less I/O, and they improve data compression. As always, consult the Attribute Clustering documentation for all the details and fine print.

A map of all the people who need data.

Zone Maps

Zone maps are new to Oracle 12.1.0.2 – they provide an additional level of metadata about the data stored in a table. Instead of operating at the row level, like an index, a zone map operates at the level of a range of blocks. In a way, an Oracle zone map is a lot like a SQL Server Columnstore dictionary – it allows I/O pruning to happen at a much coarser granularity than the row level.

When zone maps are combined with features like attribute clustering or partitioning, the database can take advantage of metadata at many levels within the zone map and perform incredibly efficient I/O pruning. Data can be pruned at the zone, partition, or subpartition level, and when attribute clustering is in use the pruning can happen at the dimension level too.

Zone maps are going to have the most benefit for Oracle databases with a heavy data warehousing workload. Big scans with common predicates, especially with low cardinality predicates, will use zone maps to eliminate a lot of I/O. Users taking advantage of attribute clustering and partitioning will also see improvements from this feature. You can read more in the Zone maps section of the data warehousing guide.

More than Data Warehousing

This is a wealth of features. Seriously, that’s a crazy investment in data warehousing for any release of a product, much less a point release.

Every Developer’s Dream: JSON Support

Everybody hates XML. It’s cumbersome to query and people love making fun of it. Many databases have been adding support for JSON and Oracle is no exception.

Oracle’s JSON implementation supports search indexes for general querying (give me the third element of the array in property “sandwiches”). Multiple index types exist for the JSON data type, giving developers fine grained control over how they interact with the data stored in the database. Oracle full text search also supports full-text queries using a new json_textcontains operator. If you want to jump down the JSON rabbit hole, make sure you check out the JSON documentation and pay particular attention to the sections about indexing – there are a number of examples of what will and won’t work.

Astute readers will notice that with the addition of JSON to Oracle 12c, SQL Server is now the only major database platform that doesn’t support JSON as a native datatype.

Cross Container Querying

Oracle 12c brought multi-tenant databases, sometimes referred to as contained databases or containers. If you wanted to query across databases, you’d typically have to go through some shenanigans. The CONTAINERS clause makes it easier for developers to write queries that can go across all containers, or even some containers.

Basically, instead of querying directly from one table, a developer would put the name of the table in a CONTAINERS function:

And if you wanted to query only specific containers:

While not useful for all systems, this does allow DBAs to perform administrative or back office queries across multiple database containers. The gotcha? All databases need to have the same schema.

Summary

Oracle 12.1.0.2 has a number of new features, some of which I didn’t mention since they relate entirely to managing the contained database features. If you want to learn more, check out the new feature guide – it’s full of links to the Oracle documentation on each new feature.


Career Planning for DBAs: Your Next Two Years

You’ve been doing this database thing for a while, and you’re ready to get serious about it. What’s the next step?

Step 1: Define your specialty in one sentence.

If you say you do everything, you compete with everyone.

You want to be the only one they want. That means you’re:

  • Actively sought-after
  • Uniquely qualified
  • A very high value for short bursts of time
  • Respected for your opinion
  • Worth more than your competitors (more on that later)

This sounds selfish, but remember – it’s not about you. It’s about your customers (whether they’re internal or external) and your ability to help them.

To pick your specialization, lemme show a slide from our live instructor-led training classes where I talk about the different types of DBAs and what they specialize in. Here’s one of the important slides from that session:

Common types of DBAs

Most of you out in the crowd are going to say, “But I do all of these.” Sure you do – today. But we’re talking about where you want to be two years from now if you’re going to really stand out. Not only am I encouraging you to pick one of the columns, but I’m even encouraging you to focus on a specific horizontal row.

Examples of specialties include:

  • “This server has to be reliable. We need AlwaysOn Availability Groups. I know just who to call.”
  • “We need to manage thousands of servers with easier automation. I know the right person for the job.”
  • “Our SQL Servers in VMware are just too slow, and nobody knows whose fault it is. I know who can tell.”
  • “We need to offload our full text search, but we have no idea what to use. I know somebody who does.”

Notice that I’m phrasing these in a one-sentence pain point. You need to be known for resolving someone’s pain. This is the funny thing about business and consulting – you get paid the most to relieve urgent pain, not to provide keeping-the-lights-on maintenance.

The first step in your two-year plan is to write the one-sentence pain you want to resolve.

Step 2: Assess your current skills and your target skills.

Thinking about your one-sentence pain point:

  1. How many times have you relieved that pain?
  2. How many times have you failed to relieve it?
  3. When you hit an impasse, who did you escalate it to?
  4. Have you sketched out a process for diagnosing it? Has anyone?
  5. Have you documented the process for others to follow?

The more answers you have, and the more confident you are giving those answers aloud to someone else, the better your skills are. What, you expected a true/false multiple choice assessment test? Technology moves so fast that often the questions aren’t even right, let alone the answers.

Here’s a longer version of that assessment that I use for my own skills testing:

  1. I don’t know where the pain is coming from.
  2. I can identify the pain in clear terms.
  3. I know several possible root causes of the pain.
  4. I can identify exactly which one is at fault here.
  5. I know several ways to relieve that pain.
  6. I can identify exactly which one is right here.
  7. I’ve documented my triage process.
  8. I’ve hit situations where my process has been wrong, and I’ve learned from it.

From those levels, what level do you think you get paid for?

Surprise – it’s #1. You know plenty of people who are getting paid right now even though they have absolutely no idea where the pain is coming from. However, the higher your level, the easier it is to get paid more. (Don’t think that just because you’re on level 7, you’re making a bazillion dollars – there’s plenty of folks who aren’t great at negotiating their value, either.)

Figure out what level you’re at today, and get a rough idea of what level you want to be at in two years. Now let’s figure out how to get there.

Step 3: Build a 2-year learning plan to make that leap.

Divide the number of levels you want to jump by the amount of time you have. If you want to go up four levels, and you’ve got two years to do it, then you need to progress a level every 6 months.

This sounds really easy, but there’s a problem: you’re probably not repeatedly solving this pain point at your day job. You probably solve it every now and then, but not over and over in a way that helps you refine your technique.

That’s why a 2-year learning plan is really a 2-year sharing plan.

Nothing teaches you something like being forced to teach it to someone else. Heck, even building this blog post (and a presentation on it a few weeks ago) made me flesh out my own philosophies!

But to share, you have to get permission. Start by having this discussion with your manager:

Dear Manager – Recently, we ran into the problem of ____. To get relief, I did ____. Are you happy with that relief? If so, I’d like to talk about what I learned at my local SQL Server user group. I won’t mention our company name. Is that OK? Sincerely, Me

By having that discussion, you’re also making sure the manager is really satisfied with your pain relief efforts and that they saw value in your work. (After all, think of them as one of your first pain relief clients.)

Once you’ve got permission, here’s how you build the 2-year sharing plan: every level jump equals one user group presentation.

  1. Write the user group presentation agenda in 4-5 bullet points.
  2. Write a blog post about each bullet point. (The words in your blog post are what you’ll say out loud in your session – think about it as writing your script.)
  3. Build slides that help tell the story, but the slides are not the story. Don’t transcribe your blog posts word-for-word on the slide.

For example, if you need to hit the level “I know several ways to relieve that pain,” and your specialization is improving the performance of virtual SQL Servers, your user group session could be titled “5 Ways to Make Your Virtual SQL Server Faster.” You’d then write a blog post about each of the 5 ways. Presto, there’s your session resources.

At the end of your 2-year sharing plan, you’ve built up a solid repertoire of material, plus built up your own level of expertise. (You’ve also built up a little bit of a reputation – but more on that later.)

Step 4: Decide what lifestyle works best for you.

How much risk can you tolerate?

  • Some. I could miss a couple of paychecks a year and manage my own benefits if I earned more.
  • Lots. I’d be willing to go without income for a month or two per year if I could earn lots more.
  • None. A very predictable salary and benefits are absolute requirements for me.

This determines whether you should be a full time employee, a long-term contractor that switches positions periodically, or a short-term consultant. In a nutshell, the differences are:

Consultants tell you what to do. They listen to your business problems, come up with solutions, and guide your staff on how to do it. They are typically short-term stints – a couple of days per month at a client, multiple clients at a time.

Contractors do what they’re told. They get a list of required solutions from the business and implement those solutions. They typically work together for long stints, showing up at the same client every day for months at a time, with only one live client relationship.

Full time employees do a mix of this. They come up with ideas, plus implement some of those ideas.

There’s no one answer that’s better for everyone. Heck, I’ve even changed my answer a few times over the last several years! It comes down to finding the right risk/reward balance for your own lifestyle needs, and then bringing the right customers in the door.

Step 5: Decide how you’ll market yourself.

Consultants sell advice, not manual labor, so they have many clients – which means doing a lot of sales.

Contractors sell labor, so they have fewer clients – which means less sales efforts.

Full time employees (FTEs) only have one sales push every few years when they change jobs.

Our company is a good example of the work required to do marketing and sales when you want to scale beyond one or two people:

  • We have tens of thousands of regular blog readers
  • Thousands of them attend the weekly webcasts
  • Hundreds of them email us per month asking for help
  • A few dozen turn into serious sales opportunities
  • Around a dozen will book consulting engagements with us

This funnel approach demonstrates inbound marketing – using lots of free material to get the word out about your services and invite them to contact you for personal help. It’s a lot of hard work – very hard work.

The other approach is outbound marketing – cold calls to strangers asking if they’ve got your specialized pain point, and then trying to convince them that you’re the right person to bring pain relief. (You can kinda guess how I feel about outbound marketing.) Sure, it sounds slimy – but the takeaway is that it’s hard work, and every bit as hard as doing inbound marketing.

But only one of those options polishes your skills.

Inbound marketing is a rare two-for-one in life – it’s both your 2-year sharing plan, and your 2-year marketing plan. You don’t have much spare time, so you need every bit of it to count. Choose inbound marketing, do your learning and sharing in public, and you’ll write your own ticket.

Presto – You’re two years away from success.

No matter what pain you want to solve, how you want to solve it, or how you want to get paid for it, this simple plan will have you on the road to success. Now get started on writing down that one-sentence pain point!


The SQL Server Components of kCura Relativity

kCura Relativity, SQL Server
8 Comments

kCura Relativity is a software product for law firms to find interesting stuff to help their case. To get you up to speed on what it does, here’s some of the posts I’ve written about Relativity in the past:

  1. Performance Tuning kCura Relativity – explains what the product is for and how DBAs can help make it faster
  2. Tiering kCura Relativity Databases – how to manage hundreds or thousands of Relativity databases
  3. Using Partitioning to Make Relativity Faster – when you have a 1TB+ workspace, this technique makes backups and maintenance easier

Today, I’m going to talk about the database mechanics – where data lives, and which tables you need to care about.

Relativity’s EDDS* Databases

The EDDS database stores Relativity’s system-wide configuration. (Just plain EDDS, no numbers or letters after it.) All of the users and processes will hit this database at various points of their work.

The EDDSResource database is like Relativity’s TempDB. I’m a huge, huge fan of this approach – this lets DBAs tune the EDDSResource independently from TempDB.

Each of the EDDS12345 databases (with a bunch of different numbers) is a legal matter, or in Relativity terms, a workspace. Think lawsuit or case, basically. As your lawyers take on new cases, each one will get its own new EDDS database.

You may also have an EDDSPerformance database, which houses kCura Performance Dashboard – a product that gathers performance metrics about your environment.

Distributed Environments: Spreading the Load Between SQL Servers

When you first get started, all of these databases could be on the same server. In the e-discovery business, though, growth happens really fast. Right from the get-go, you probably want to plan to separate them onto multiple SQL Server instances – in Relativity terms, a distributed environment with a couple of different SQL Servers:

The starting point for a Relativity distributed setup

We’ve got two SQL Servers, each with a couple of workspaces. (Obviously, Relativity scales WAY bigger than two workspaces on a single server, but I only wanna make these images so big, people.)

The EDDS database – the central config data – only lives on SQL1.

Both servers have their own EDDSResource database, and that’s for temporary scratch space.

But two standalone SQL Servers would be an insanely bad idea because if either server goes down, you’re screwed. Instead, you want to build a failover cluster of SQL Server instances, each instance living on a different physical box:

Two SQL Server instances for Relativity on a failover cluster

The databases live on shared storage, so if either box dies, the SQL Server instance can start up on the other box. Of course, this means you’ll have twice as many workspaces living on the same hardware, and that’s not a recipe for high performance, and you can mitigate that by buying a separate passive node. I’m not going into the intricacies of failover clustering here – for that, see our clustering resources.

How the EDDS Databases Affect Cluster Design

The EDDS database will consume performance resources. As your distributed environment grows larger and larger, the load on the EDDS database will increase. If other workspaces are sharing that instance, they may be bullied around by the EDDS database. In very large environments, the EDDS database may grow to the point where it needs its own SQL Server instance – or rather, you just don’t want to put any workspaces on that instance.

Any one workspace is confined to one database server. If you have a massive case going on with tens of terabytes of data, the load isn’t spread across the servers. One database still lives on just one host. While technically, SQL Server 2012 AlwaysOn Availability Groups does let you spread load across multiple servers, and technically Relativity 8.2 supports SQL Server 2012, they don’t support AGs for failover or spreading load yet.

You can move databases between servers to balance load, but it requires some downtime and work on the application side. You can’t just back up a workspace on one server, restore it onto another SQL Server, and take off. kCura has administration tools to help with this task, but it’s up to you to figure out which databases should be on which servers. This is where the concept of tiered workspaces comes in.

How to Performance Tune the EDDS Database

Because this database holds configuration data, and because the queries that hit here aren’t usually user-created, you generally don’t want to touch this database.

A few weeks after deploying a new release of Relativity, I recommend checking SQL Server’s index usage DMVs and plan cache to find out if there are any new problems that pop up. There may be a new query that needs a new index, or a unique way of doing a query in your environment that hasn’t been seen out in the wild yet.

When issues like that pop up, start by opening a support case with kCura rather than making index changes in here. In your support case, include the query text from the plan cache (if applicable) and evidence from your index DMVs to support the index change you want to make. You could actually make index changes inside this database, but generally speaking, that’s not a good first step. Let the Relativity support folks make the call there because any index changes here can dramatically affect all workspaces.

How to Tune the EDDSResource Databases

You don’t. It’s a temporary staging ground. You can skip this guy under most circumstances.

How to Tune the EDDSPerformance Database

Performance Dashboard is a relatively new product – at least compared to Relativity. Early versions of it desperately needed a few indexes, so using tools like sp_BlitzIndex® pay off big time here. I would highly recommend checking missing indexes in this database, but then after a couple of low-hanging-fruit indexes are applied, this database won’t be a performance issue.

Before making changes here, again, start a support case with the changes you’d like to make. In most cases, this is just a simple known issue and easy to fix.

How to Tune the Workspaces (EDDS* Databases)

Ah, now here’s the fun stuff.

Expanding on the process I discussed in my Performance Tuning kCura Relativity post, every database is a new case that goes through a lifecycle:

  1. The database is created. It’s technically restored from a “template”, a database that the users have set up as their standard starting point. Larger Relativity shops may have several templates to choose from.
  2. Some documents are loaded. We need to load data into the database server as quickly as possible.
  3. Users review the documents. They run searches looking for terms and attributes that might indicate evidence that would bolster their case. As they review documents, they make small edits to the metadata fields at the document level, like marking whether the document has been reviewed, who reviewed it, and whether or not it was interesting. We need to audit everything the users do (as well as things the system does, too.)
  4. We go back to step 2 a few times. More documents get loaded, and users run more searches. This cycle continues for some time, until the amount of documents trickles to a halt, but searches still continue for a while.
  5. The case becomes dormant. Legal matters can drag on for years, but we may need to keep this database online the whole time. The amount of changes drops dramatically – sometimes with no data changes for months or years – but the database has to be online, and it has to be backed up.

Some of the major tables in each EDDS* database include (and remember, lawyers, I’m simplifying this for the DBAs in the house):

  • Document, File – things we loaded into Relativity to search through, like Excel files and Outlook PSTs
  • AuditRecord_PrimaryPartition – a log of most Relativity events, like document loads or end user searches (when this is a problem, start by partitioning it out)
  • Artifact – think of this like a system table for Relativity that lists every Document, plus other system objects
  • CodeArtifact – prior to Relativity v8, this one table stored records for all choices for every Document. (Think multiple-choice fields, like what kind of file type it was.) This had scalability limits because it had multiple times more rows than the Document table, and query plans could get ugly. This was changed in Relativity v8, but I’m mentioning it here in case any of you out there are still on 7.5. (Get on this level.)
Advice for Relativity 7.5 shops

Index tuning isn’t necessary on most of these tables because the queries that hit these tables are all managed by Relativity itself. The kCura developers sit around the office trying to figure out how to make those queries go faster, and they come up with some pretty good ideas. (Well, they also surf my site when they’re bored. Did I mention that they’re attractive people?) You shouldn’t need to touch indexes or queries here, other than the same every-new-version check that I described about EDDS.

Except for the Document table.

Oh, boy, the Document table.

Why the Document Table is Fun to Tune

Relativity lets end users write whatever crazy searches they want against the Document table. Wanna find every email with “S” in the email address? You got it. Need to see every PowerPoint created in June last year? Can do. Interested in every file whose extension is MP4 but the data is actually a PowerPoint slide deck and has hidden slides? No problem. You can build these searches in a GUI without understanding anything whatsoever about how SQL Server works, and Relativity will build the T-SQL for you.

To make matters even more fun (HA! see what I did there, lawyers? “matters”, oh, I kill me), the end users can add new fields to the Document table any time they want. If they want to add a new decimal field called LooksSuspicious, it happens with no DBA intervention or change request. Relativity generates the ALTER TABLE commands on the fly, and then users can populate that field and run searches against it.

Index tuning becomes really challenging because we may never be done loading documents. To load documents, we want as few indexes as possible for faster insert speeds. To search for documents, we want lots of indexes so we don’t have to scan the Document table. As DBAs, we’d like to ask the users, “Are you done loading now? Because I can add indexes to make this go fast.” The answer with Relativity may always be, “No, I might load some more tomorrow.”

And what I find the most interesting is that every EDDS* database can be wildly different. Every team that’s involved with every legal matter may have totally different approaches to loading, searching, and managing their documents. That means you have to treat every EDDS* database as its own unique indexing challenge.

At any given time, you might have a hundred EDDS* databases, each for a different legal matter, each with their own Document table. Each has different numbers of fields and indexes in each case.

You can’t conquer each of these databases individually. You simply have to use my tiered workspace approach, define the small databases that will work just fine on their own, and go tackle the largest and most active databases with traditional index performance tuning methods.


Video: Test Your Index Design Skills (with poll results)

Indexing, SQL Server
8 Comments

You know how to design indexes, but you’re not sure how good your skills really are. In this quiz-packed session you’ll get a chance to test your skills! Kendra Little will walk you through a set of index design challenges. You’ll have time to answer each problem on your own, then find out whether the SQL Server engine thinks you made the right choice. At the end of the session you’ll get to tally your score (but you can keep it a secret if you like).

Take the quiz while you watch the video. If you’d like to dive straight into the questions, skip to 2:30.

Compare your answers to the group

Our webcast had 416 attendees and 80% of people answered each question. To find out the right answers (and why) watch the video above, but here’s the stats on how webcast viewers answered each question.

This is NOT the answer key— don’t assume the majority of people got every question right! This just lets you compare what you thought to what others thought.

Q1) A NonClustered Index is…

A) 4.39%
B) 19.26%
C) 73.65%
D) 2.70%

Q2) What will this query probably due given this table definition?

A) 13.92%
B) 70.55%
C) 9.06%
D) 6.47%

Q3) What is most likely the biggest problem with this table?

A) 4.35%
B) 69.93%
C) 17.39%
D) 8.33%

Q4) INCLUDED columns are…

A) 14.33%
B) 77.88%
C) 5.30%
D) 2.49%

Q5) A unique constraint is…

A only) 11%
A and B) 11%
A, B, and C) 16%
A, B, C, and D) 14%
A and C) 41%
A, C and D) 8%
A and D) 4%

(There were some other combos, but they all got low percentages)

Q6) Which one of these statements is ALWAYS true?

A) 16.77%
B) 36.13%
C) 14.52%
D) 32.58%

Q7) How many indexes were written to?

0) 2.33%
1) 17.00%
2) 46.67%
3) 34.00%

Q8) Why wouldn’t SQL Server Ask for an Index?

A) 22.73%
B) 45.45%
C) 26.22%
D) 5.59%


Getting an Oracle Execution Plan

Oracle
3 Comments

Execution plans are fantastic – they make it easier to visualize how a query is running and find tuning opportunities. SQL Server DBAs starting with Oracle may be a bit frustrated by the lack of a clear way to get to execution plans. This covers three ways to get to execution plans in Oracle – estimated plans, actual plans from an active session, and actual plans from the plan cache.

Getting Estimated Oracle Execution Plans

One way, likely more familiar to MySQL and PostgreSQL DBAs, is to use the EXPLAIN PLAN FOR command to get an execution plan out of Oracle. To do this, a DBA would simply add the command EXPLAIN PLAN FOR to the beginning of a SQL statement:

Oracle will immediately finish and return Explained. SQL Server DBAs will likely exclaim “WTF, Oracle?” and stomp off in frustration in search of a GUI that will let them connect to Oracle and show them a graphical execution plan.

Oracle gives DBAs the ability to save off plans into tables, and that’s exactly what the EXPLAIN PLAN FOR syntax does – it saves the plan into a table named plan_table. You can view the execution plan using the following command:

This produces lovely text output:

There are three parts here – the plan hash value, the row source tree, and predicate information. Plans can be read similarly to SQL Server execution plans; just start at the deepest level and work your way out. In this case, start at Id 6 and work your way up to 3, then 2, then 1, then 0. An asterisk next to the Id means that there’s more detailed information about that step in the Predicate Information section.

You can get more detailed output from Oracle by supplying parameters to the DBMS_XPLAN.DISPLAY() function:

More documentation on DBMS_XPLAN can be found in the Oracle documentation.

Getting Actual Execution Plans From Oracle

Run the query first:

And then follow up by executing:

You should see the following execution plan:

Hey, that looks exactly the same! The default parameters for dbms_xplan.display_cursor won’t show us all the juicy details that we want. Adding in FORMAT => '+ALLSTATS'will do exactly what we want. Before you go running that execution plan query again, you have two choices: you can either execute the full select query again, or you can copy down the SQL_ID and use it in the dbms_xplan.display_cursor function like this:

The output gets a bit more detailed and ends up looking like this:

Now we can see the estimated (E-Rows) and actual (A-Rows) returned from each operation as well as timing and memory information. Parallel queries will return even more information (take a look at the example DBMS_XPLAN commands and output to see what that would look like.

Viewing The Oracle Execution Plan Cache

You might hear Oracle people talk about this as the library cache or the cursor cache. In the SQL Server world, we’d call it the execution plan cache. Whatever you want to call it, it’s contained in a system view: V$SQL_PLAN.

We could find our query in V$SQL_PLAN and get the execution plan doing something like this:

This query will pull back basic information about the different statements that have been executed that match our search condition. That output looks different because I used thebasic parameter for plan display instead of the default of typical, but here’s an example:

If you want to get the full plan from any of these statements, you can either include the sql_id in the query to find all plans for a statement, or you can use the plan hash value to get retrieve it from the v$sql_plan view and use it in the dbms_xplan.display_cursor function.

In the query to retrieve matching plans, our query uses Oracle’s v$sql_plan system view to find matching cursors (everything’s a cursor, yay) in memory. Once we have a list of matching cursors in memory, dbms_xplan.display_cursor is used to pull back information about the actual plan from the cursor cache.

Wrapping Up

There you have it – three ways to view execution plans in Oracle:

  1. Using EXPLAIN PLAN FOR to get an estimated execution plan.
  2. Using dbms_xplan.display_cursor() after running a query to get the actual execution plan.
  3. Querying v$sql_plan to find plans in the plan cache.

SQL Server experts and novices alike can get the kind of query details from Oracle that they’re used to seeing from SQL Server.


How to Back Up Terabytes of Databases

When you weren’t looking, your databases went and grew up. Now your backup window has grown so large that you’re about ready to open it and jump.

Time to make a choice.

The Native Way: Tuning SQL Server Backups

You can theoretically pull this off by using a combination of tactics:

Back up as infrequently as the business will allow. Run your full backups once a week (or if you want to go wild and crazy, once per month) and differential backups periodically. As Jes explains in her backup and recovery class, differentials back up the data pages that have changed since the last full backup. When disaster strikes, you only need to recover the most recent full backup, the most recent differential backup, and all of the log backups after the differential. This can shave a lot of time off your restores – but only if you minimize the number of changed pages in the database. This means…

Change the database as little as possible. We can’t change what the users do, but we can change what we DBAs do. Stop doing daily index defrag/rebuild jobs – you’re just changing pages in the database, which means instantly inflating the size of your differential backups. In a scenario like this, you can only do index maintenance when you’re sure it is the only way to solve a performance problem, and it absolutely has to be your last resort.

My backup camera collection has started to grow out of control.

Tune the data file read speeds. You need to read the pages off disk as fast as possible to back them up. Use tools like CrystalDiskMark and SQLIO to measure how fast you’re going, and then tune your storage to go faster.

Compress the data as much as possible. It’s not just about minimizing the size of your backup file – it’s about minimizing the amount of data we have to write to disk. Bonus points for using index compression inside the database so that it’s compressed once, not recompressed every time we do a backup, although that doesn’t really help with off-row data.

Tune the backup target write speeds. If you’re using a small pool of SATA drives in RAID 5 as a backup target, it’s probably not going to be able to keep up with a giant volume of streaming writes, even if those writes are compressed versions of the database. Problems will get even worse if multiple servers are backing up to the same RAID 5 pool simultaneously because the writes will turn random, which is the worst case scenario for RAID 5.

Tune the bottleneck between the reads and the writes. If you’re backing up over the network, use 10Gb Ethernet to avoid the pains of trying to push a lot of data through a tiny 1Gb straw.

Tune your backup software settings. If you’re using native backups, start with using multiple files and the built-in options, and graph your results. Third party compression products usually offer all kinds of knobs to tweak – you’ll need to use that same level of graphing diligence.

Whew. I got tired just typing all that stuff. And if you’re lucky, at the end of it, your backups will complete in an hour or two, but the server might be darned near unusable while you’re beating the daylights out of it. Then the fun balancing act starts, trying to figure out the right point where the system is still usable but the backups complete quickly.

Or Just Cheat with SAN Snapshots.

In my Virtualization, SAN, and Hardware video class, I explain how SAN snapshots are able to take a full database backup of any size in just a couple of seconds.

I'm a big believer in snapshots.
I’m a big believer in snapshots.

Seriously.

Sort of.

See, while it’s technically a backup, I don’t really consider it a backup until it’s off the primary storage device. Your SAN storage, expensive as it was, is still vulnerable to failure, and you need to get that data out as quickly as possible. The good news is that you can move that data out without dragging it through the SQL Server’s storage connections, CPU, and network ports. You can simply (simply?) hook a virtual tape library, actual tape library, or another storage device to the same storage network, and copy directly between the two.

Your data read speeds may degrade during that process, but it’s up to you – if you want to architect your storage so that it’s fast enough to do these full backups without any noticeable performance to the end user, it’s possible by inserting enough quarters in the front.

You still have to pay attention, though, because your backup process will look like this:

  • Daily full backups via SAN snapshots – all writes are quiesced for 1-10 seconds during this time
  • Conventional log backups every X minutes – where X is dictated by the business

If you push a big index rebuild job through, you can still bloat the transaction log, and your log backups may take longer than X minutes to complete. This is where our RPO/RTO planning worksheet is so important – if your RPO is 1 minute, you simply may not be able to do index rebuild jobs.

SAN snapshots have one other drawback: depending on your storage make/model, snapshots may not be included in your licensing pricing. You may have to spend a lot more (typically tens of thousands of dollars) to unlock the feature. Ask your SAN admin if snapshots are right for your wallet.

Building Terabyte Servers Means Starting with Backups First

When I’m building a SQL Server to hold multiple terabytes of databases, this backup question is the very first one we have to address – even before we talk about the speed of end user queries.

Otherwise, we could end up designing a server with all local solid state drives, which is very inexpensive and satisfies end user performance goals – but we can’t back the data up fast enough.


Comparing Estimated and Actual Execution Plans in SQL Server

Let’s say you want to have an addition built on your house. You contact a contractor, who comes to your house, looks at your lot, looks at what exists, and asks you questions about exactly what you want. He then gives you an estimate of the work – approximately how long he thinks it will take his crew, what supplies will be needed, and the cost of those supplies.

SQL Server gives you a similar option. When you write a query, before committing to it, you can request an estimated execution plan.

The estimated execution plan is designed to show what SQL Server would most likely do if it were to execute the query. Using statistics, it estimates how many rows may be returned from each table. It chooses the operators it will use to retrieve the data – scans or seeks. It decides how to best join the tables together – nested loops, merge joins, hash joins. It is a reasonably accurate guide to what SQL Server will do.

You can view an estimated execution plan for an individual statement, a stored procedure, or a function. The plan can be text, XML, or graphical. To view text, use SET SHOWPLAN_TEXT ON. For an XML version, use the command SET SHOWPLAN_XML ON. To view a graphical plan in SSMS, click the Display Estimated Execution Plan button in SSMS.

Est Exec Plan

There are some cases in which SQL Server can’t create an estimated execution plan. If your query has parameters in it and values aren’t passed in, SQL Server can’t interpret those – it needs literal values. If the query references a temp table that is not declared, the plan also can’t be generated.

Now, let’s go back to our construction project. We’ve signed the contract and the contractor begins work. While the addition is being framed, you decide you want to add an extra room, or add windows, or make the ceilings higher. The contractor has to adjust for this in terms of time and cost. This will change how long the project takes, and how expensive it is.

Executing a query in SQL Server is no different. The actual execution plan is shown after a query is executed. The difference here is that SQL Server can tell you exactly how many reads were performed, how many rows were read, and what joins were performed.

If it’s a long-running query, it will take a while to get the execution plan. Parameters, if required, must be passed in.

The text plan is generated using SET STATISTICS PROFILE ON. The XML version of the actual plan can be viewed by using SET STATISTICS XML ON. A graphical version can be generated in SSMS by using the Include Actual Execution Plan button.

Actual Exec PLan

There are some cases in which things that show up in the estimated plan will not show in the actual plan. For example, when you call a scalar-value function, the estimated plan will show it – the actual plan will not. (This is why the impact of functions can be very misunderstood.)

“IF I VIEW AN ESTIMATED PLAN, THEN IMMEDIATELY RUN THE QUERY AND VIEW THE ACTUAL EXECUTION PLAN, WHY DO I SEE DIFFERENCES?”

The query optimizer is going to use statistics on the tables and indexes to decide how to perform the actual query execution. If statistics change for any reason between the time you estimate a plan and when the query is actually run, you can see differences.

Changes to table schema, indexes, or even the data can affect the statistics. If a new index is added, or rows are updated in the table, when the query optimizer executes the query, it could choose a different set of operators than it did during estimation. Sometimes the differences between the estimated and actual plans can be large!

How can you prevent this from being a problem? Make sure statistics are updated on your tables and indexes. Auto update stats will automatically refresh statistics if a specific number of rows in a table change – after a table reaches 500 rows, roughly 20% of the rows need to change. (Exact details about that are here http://support.microsoft.com/kb/195565/en-us). The more rows that your table contains, the more changes that need to be made for them to automatically refresh – on large tables, you may need to set up more frequent stats updates.

You also want to be aware that using table variables on large result sets can be wildly inaccurate – they always estimate a low number of rows.

TRIVIA: WHICH TYPE OF PLAN IS STORED IN THE PLAN CACHE?

The estimated plan is stored in the plan cache. If you review the XML (doesn’t that sound like fun?!), you will see “ParameterCompiledValue” listed near the end. This is what value the query was run with when the plan was stored. Ensuing executions may use different values, which can lead to less-than-optimal performance if bad parameter sniffing happens.


An example of compiled values in the execution plan XML

Estimated execution plans can be very useful as you are writing and tuning queries, giving you an idea of how SQL Server will most likely perform query execution. However, if you need to know exactly what steps SQL Server will take, executing the query and reviewing the actual execution plan is the only way to be certain.

Learn More in Our Execution Plan Training

Our How to Read Execution Plans Training explains how to get an execution plan, how to read the operators, and learn solutions to common query problems.


Performance Tuning SQL Server Transactional Replication: A Checklist

Replication
76 Comments
salmon-swimming-shutterstock_154697786
Swim faster!

SQL Server transactional replication is a blessing and a curse. It’s a great developer tool that lets you scale out data to multiple servers, even using Standard Edition. But as your business picks up, your datasets get larger, and your customers grow more demanding, replication can start to fall behind. You need to learn how to tune it to keep up.

Before You Start Tuning Replication….

Make sure you can prove when changes you make to replication improve performance. Or find out quickly if you make something worse. (It’s gonna happen.)

If I’m going to make changes with something as complex as replication, here are my basic requirements:

  • Monitoring must alert the DBA team replication latency exceeds allowed thresholds
  • Monitoring needs to track historical latency to show if my changes reduce latency
  • I need a production-like staging environment to test my changes.

If you haven’t configured monitoring for transactional replication, read how to do it here. The “easy” and “medium” steps are a small amount of work and are incredibly useful.

Don’t Skip “Normal” SQL Server Performance Tuning!

I’m going to give you a lot of transactional replication specific performance tuning tips in this post. But don’t skip other elements of SQL Server performance tuning! Wait statistics, virtual file stats, and identifying bottlenecks are still important. Get started with SQL Server performance tuning here.

1) Are You Using the right versions of Windows and SQL Server for Replication?

For replication performance, you want to be on Windows Server 2008 and SQL Server 2008 minimum. It really makes a difference.

2) Have You Scaled up your distributor?

When replication performance is important, use a dedicated distributor server so that your distributor doesn’t have to fight with a publisher or subscriber for CPU, memory, network, or storage resources. If you need high availability for the distribution database, you have limited options: failover clustering is pretty much the only way to go.

3) Is Replication really what you need?

Check your assumptions. Could you get by with Transaction Log Shipping? Are you a good candidate for Availability Groups?

4) Are You Using the right type of subscriptions and tools for replication over the WAN?

Argenis Fernandez shares what he learned from tuning transactional replication over wide area networks. This is a great use of “pull” subscriptions.

5) Have You Made sure Articles are NOT in more than one publication?

Kendal Van Dyke shows that having articles in multiple publications can also magnify the number of commands in your distribution database. That bloats your distribution database and will slow you way down as activity picks up.

(Note: If you’re using row-filtering on your articles, you may be the exception to this rule.)

6) Do You Only run Snapshots when you need them?

I’ve come across cases where the Snapshot agents for a publication were set to run on a schedule, even when replication wasn’t being initialized. I believe that when someone was setting replication up, they had checked off the option to “Schedule the Snapshot Agent to run at the following times” without realizing that it wasn’t needed. Don’t run snapshots on a schedule, it will lock up the publishing database. (When you open “Job Activity Monitor” these jobs show up with the category “REPL-Snapshot”.)

7) Are you Using “Immediate Sync” to your Advantage?

The immediate sync option is hard to spot when you first set up replication. Setting this to false can help minimize the impact of running a replication snapshot if you need to add new articles, or even remove and re-add a few articles. Learn more about it here. As always, test your changes outside of production first! (I personally have a fear of having immediate sync set to true because of this old bug from SQL Server 2005.)

For information on how the immediate_sync can also impact your distribution database, read more here.

Thanks to Allen McGuire for his comment reminding us on the benefits of this setting!

8) Are You Replicating only the articles and columns you need on the Subscriber?

Don’t just “add all.” For scalability, replicate only the articles that must be in replication, and only the columns that need to be replicated. This not only helps overall performance, this reduces the impact of times when you may need to re-initialize replication. This goes especially for large object / LOB data types. If you must replicate LOB types, Microsoft recommends that you use newer types such as nvarchar(max), varbinary(max), etc.

9) Do You Set the ‘Replicate Schema Changes’ subscription option to false when needed?

New columns being added to a published article shouldn’t be replicated to the subscriber unless they really need to be there. You can turn off the replication of schema changes by setting the ‘Replicate Schema Changes’ subscription option to ‘false’. (It defaults to ‘true’.)

10) Have You Considered static row filters?

“Static row filters” allow you to include only certain rows in a given publication. There is overhead to applying the row filter itself: Microsoft only recommends you use the row filters if your replication setup can’t handle replicating the full dataset.

11) Have You Optimized your subscriber databases for re-initialization?

Face it: re-initialization happens. Unfortunately it usually happens when you least expect it and had plans to be doing something else. There are a few things you can do to keep re-initialization from making your publication database unusuable for long periods.

  • Isolate your replication subscriber tables into their own database, and only keep replicated articles in there. This also typically helps you use use recovery models that are optimized for minimal logging in that database to speed up bulk inserts. Consider using synonyms to quickly “repoint” to replicated articles to give you flexibility.
  • Evaluate whether initializing replication from backup could help.

12) Have you Considered Using multiple publications?

There’s pros and cons to splitting out publications. Here’s the pros:

  • You can isolate large tables that are the biggest problems for snapshotting into their own publications so that they get their own snapshots. That can be helpful if there are other tables you might need to remove and re-add to replication more frequently. (The immediate_sync setting can also help with this, see #7 above.)
  • This will give you multiple distribution agents so changes can be applied to your subscribers in parallel. (This one’s a pro and a con, as you’ll see.)

Cons:

  • This is more work to manage. You should be checking in scripts for your entire replication into source and have documentation on everything. More publications makes that whole process harder.
  • All those distribution agents can backfire if you don’t have the resources to support them working on the subscriber at the same time.
  • Be mindful not to put non row-filtered articles in more than one publication as noted above.

13) Are “Subscription Streams” Right for You? (or not?)

This option allows you to raise the number of connections that the distribution agents use to apply changes to the subscriber. But there’s overhead to managing all these threads, and you can get into situations where transactions aren’t fully consistent if you hit problems.

This feature is primarily recommended for use on situations where you have high network latency and are not changing the setting often. Keep in mind that if you’re splitting your articles into multiple publications for other reasons, you’ve already got multiple distribution agents running in parallel.

14) Are You replicating non-clustered indexes blindly?

Confession: I did this wrong for years. It’s very easy to set up transactional replication and send all the indexes over to the subscriber: you just set “Copy nonclustered indexes” in the articles property to “true”. But you’re only required to replicate the Primary Key and unique indexes. There’s two big problems with replicating all the nonclustered indexes:

  • It can make re-initialization slower. By default the subscriber will have objects created, bulk load the articles, create “extra” nonclustered indexes, then “catch up” on any changes that came in after the snapshot was pushed. You definitely want to make sure that all “extra” nonclustered indexes are disabled or don’t exist while that bulk load is happening. But if a lot may have changed since the snapshot ran, you may not want the indexes to be created until the very end, anyway. Handling the nonclustered index creation outside of replication gives you that flexibility.
  • It’s very rare for the exact same queries to run on the publisher and subscriber. You usually want nonclustered indexes that are specific to the workload on the subscriber, anyway.

Identify the “extra” nonclustered indexes specific to the queries that run on the subscriber. Script them out, check them into your source control, and have a process to deploy them whenever replication needs to be re-initialized.

15) Could publishing stored procedure execution work?

If your workload is run entirely by stored procedures, this can be a great option. (FYI, there is a bug/hotfix for this in SQL Server 2012/2014 listed below.)

16) Are You Using Read Committed Snapshot Isolation on replication subscribers?

It’s common for the distribution agent to have to fight with other processes while it tries to insert, update, and delete rows in the subscriber database. One DBA that I worked with removed a huge amount of blocking and speeded up processing by using RCSI on a subscriber database. Learn more about RCSI here.

17) Have You Ruled Out Virtual Log File fragmentation on the publisher database?

If you’ve got more than 10K virtual log files on your publication database, it could slow down replication. I’ve particularly seen this cause replication to get behind when a large operation like an index rebuild was run. Our free sp_Blitz® script will diagnose high numbers of VLFs for you.

18) You Haven’t Been Randomly Fiddling with Settings on the Distribution Agent, Have You?

There’s a lot of little settings you can change on the Agent Profiles in replication. I’m not a huge fan of changing them unless you can prove they helped your performance, though. These are typically “fine tuning” settings after you have the right architecture in place, in my experience.

19) Have You Looked Out for Replication Bugs / Fixes?

Man, these can get you. Like any other complicated tool, things can go wrong. Here’s a few highlights:

  • KB 2674882 – Deadlocking distribution agents OR replication queries with very high memory grants. This can occur on SQL Server 2005, 2008, or 2008R2.
  • Unexpectedly inactive subscriptions. There are many performance reasons to upgrade from  SQL Server 2005, but if you must be on it then you shouldn’t run anything less than SP4.
  • KB 2958429 – Service Packs Matter. SQL Server 2012 SP2 added some features to replication logging (and even a few improvements to Peer to Peer replication, oddly enough). Scroll to “Highlights for SQL Server 2012 SP2” and expand “Replication” to see the list. If you apply this service pack, you may also want to apply KB 2969896.
  • KB 2897221 – Stack dumps/ non-yielding schedulers if you’re replicating stored procedures. SQL Server 2012 or 2014.
  • KB 949296 – Replication Agents cannot run when you have many agents and the Windows desktop heap is “used up”. (Thanks to Michael Bourgon for suggesting we link to this one.)
  • The Log Reader Agent may fail to start on SQL Server 2012 Service Pack 1.
  • KB 2655789 – FIX: Replication Log Reader Agent fails with “18773” and “18805” error messages if you set the ‘large value types out of row’ table option to ON for the publication article table Print Print Email Email

Public Safety ANNOUNCEMENT: Replication Needs Special Treatment for Hotfixes and Upgrades

With any hotfixes, it’s always good to review KB 941232, “How to apply a hotfix for SQL Server in a replication topology.” (You’ll need special steps if you’re using Database Mirroring or AlwaysOn Availability Groups.)

Be careful with the steps you take to upgrade and ‘drain’ replicated transactions. If you don’t do this, in some cases you may have big problems during an upgrade.

Got a Transactional Replication Horror Story or Recommendation?

Or do you have a favorite setting I haven’t mentioned here, or something you disagree with? Replication is full of controversy! Share it with us in the comments.


Backing Up an Oracle Database

Oracle
3 Comments

One of a DBA’s most important tasks is taking backups of databases. As SQL Server DBAs, we’re used to using the same tools to backup the database that we use for the rest of our job. With Oracle, there are two main ways to back up a database: user managed backups and Oracle Recovery Manager (RMAN).

User Managed Backups of Oracle

User managed backups leave the database out of the backup equation. It’s up to the DBA and system administrator to figure out the best way to accomplish backup and recovery.

In the distant past, user managed backups required that the Oracle database be taken offline in order for the backup to occur. The database has to be in a consistent state; since the OS doesn’t know how Oracle is writing data, it can’t be trusted to copy files correctly.

Obviously, it’s not possible to take most databases out of production to take a backup. Oracle has a feature called a “hot backup”. In a hot backup, databases or tablespaces can be placed into backup mode. Once in backup mode a DBA or system administrator can use OS/storage tools to take a backup of the Oracle database. Writes can continue during this time, but Oracle changes its behavior to make it possible to get a consistent snapshot of the data.

As the name implies, user managed backups place the entire burden of managing database backups on the DBA. While this is more primitive than what most SQL Server DBAs are used to, the fundamental principle is the same – it’s up to the DBA to figure out when and how to backup the database.

Good backups are like good plumbing - you don't miss them until they're broken.
Good backups are like good plumbing – you don’t miss them until they’re broken.

Backing Up an Oracle Database With Recovery Manager

RMAN is the answer to your anguished cries of “There has to be a better way to back up a database!”

RMAN combines many aspects of automated user managed backups, but provides additional functionality and fail safe mechanisms. The overall upside is that RMAN ships with Oracle – there’s limited need to write custom software, instead DBAs configure RMAN to work in ways that make sense for the environment.

Effectively, here’s what happens: the DBA sets up RMAN with space to store backups, the fast recovery area in RMAN terms. The fast recovery area is where RMAN will store data file backups as well as archived redo log files. The idea behind the fast recovery area is that RMAN itself will manage backup retention based on policies that a DBA sets up. By having a fast recovery area present, it’s also possible to rapidly handle online restore – a DBA just has to tell RMAN a point in time for the restore and the software does the rest.

RMAN is a highly configurable tool – it supports many different types of backups (including the hot backups mentioned earlier), full backups similar to SQL Server full backups (data + some log), incremental backups, and even collapsing incremental backups so that a DBA has to restore fewer files. It’s relatively simple to start out with RMAN, but it provides a wealth of functionality that lets a DBA create the backup and recovery strategy the business needs.

Not everything is automatic: DBAs need to carefully analyze backup space requirements. RMAN handles backups, but if the fast recovery area fills up, the database will refuse writes until space is freed up.

By leveraging RMAN, DBAs can focus less on the technical details of backups and instead get to managing the business requirements of RPO and RTO while leaving tedious tasks to software.

How Should a SQL Server DBA Approach This?

From a SQL Server DBA’s perspective, RMAN is closer to a third party solution like Ola Hallengren’s maintenance scripts combined with a third party tool like Dell Litespeed or Red Gate SQL Backup. It handles many aspects of database backups, provides centralized reporting, and automates most tasks around backup and recovery. RMAN will seem more familiar to a SQL Server DBA, but some shops will still use user managed backups.

To get started learning more, check out the Oracle Database Backup and Recovery User’s Guide. It contains a number of detailed examples, syntax explanations, and considerations about how to best approach backing up an Oracle database.


Stabilizing Execution Plans: Plan Guides and NORECOMPUTE

Plan Guides are like duct tape
What could go wrong?

Sometimes you end up in a good plan / bad plan situation: an important query runs just fine most of the time. The query is parameterized, a good execution plan gets re-used, everything is cool.

But sometimes, a “bad plan” gets compiled and starts to be reused. This is “bad” parameter sniffing. “Bad plans” can come in a few varieties: maybe it’s slow some parameter combinations and can cause page timeouts sometimes. Maybe the “bad” query plan has a very large workspace memory grant that just isn’t needed, and it causes problems because lots of different queries are using it — then you get all sorts of nasty Resource Semaphore waits and everything gets slow.

Whatever the situation is, sometimes you want to stabilize a particular execution plan that’s “good” for all the different parameters that the query can run with.

Option 1: Change the code

The very best option is changing the code so you don’t have to resort to shenanigans behind the scenes. You can rewrite the TSQL, change indexes, or use hints to get a specific plan. But sometimes this is difficult to do: maybe it’s vendor code you can’t change. Maybe there’s a long code release process and it will take a very long time to get the code changed.

If you can tune the code, absolutely do it. If you can’t, at least get the request to fix the code noted by the vendor or software development team. Don’t skip it altogether, because the options I describe below aren’t all that fantastic.

Option 2: Plan guide that thing

Plan guides are like duct tape: it’s something you want to have on hand for emergency quick fixes, but you don’t want to rely on it long term as a building material. It’s also not suited for every kind of fix.

Plan guides let you do a few things:

  • Apply query hints like “optmize for value”, “optimize for unknown”, “recompile”, and “maxdop” to a query
  • Selectively turn on trace flags for a query, such as TF 4199 (performance optimizer changes), TF 9481(Older cost-based optimizer if running on SQL Server 2014), TF 2312 (newer cost-based optimizer if running on SQL Server 2014)
  • Add selected table hints, like forceseek and specific index hints. (You cannot add NOLOCK or change isolation levels, don’t get too excited.)
  • “Template” plan guides let you “force parameterize” a specific query, or enforce “simple parameterization” for a certain query if the database is using forced parameterization

But duct tape isn’t perfect. Here’s the biggest gotchas that I’ve found with plan guides:

  • I’ve found that trying to use an index hint in a plan guide can cause queries to silently fail. That’s awkward.
  • Plan guides don’t work with all types of queries. I haven’t been able to get them to work with temporary tables or table variables referenced in the query, for example.
  • Making sure that a plan guide is working and is picking up your query is tricky. Plan guides are very picky about matching query text exactly.
  • Plan guides can make code releases fail. If you’ve got a plan guide that references a stored procedure and something goes to alter it, SQL Server’s going to stop the ALTER with an error.

My biggest advice for plan guides: test them out on a non production system first. Verify that the plan guide is working and that the queries are doing exactly what you want before deploying to production. Treat the plan guide like real code as much as possible: put it into all environments, check it into source, use change control, and document it.

Option 3: Manually Force the “Right” Parameter Sniffing

If you can’t change the code and a plan guide doesn’t work, you can get a little creative. (By “get a little creative”, I mean that everything I’m about to describe can go horribly wrong.)

First, find the bad plan in cache. In SQL Server 2008 and higher, we get a nifty plan_hash for query plans. You can identify the “bad plan hash” that you don’t want to keep in cache. When it’s in cache, you then:

  1. Remove it from the cache. You can do this using DBCC FREEPROCCACHE and the plan_handle value (you can get this by running: sp_BlitzCache @results=’expert’). Or if it’s a stored procedure, you can use the sp_recompile procedure against the stored procedure to blow away the plan. (Thanks @DBArgenis for this tip!)
  2. Run a version of the query that puts the plan you want to be in cache. Usually this means running a version of the query with the parameters that give you the “right” plan.

You’ve got the burden of doing a some testing. Be careful with how you remove plans from cache: sp_recompile requires a schema level (exclusive) lock, so I don’t recommend running that against tables.

You need to generate the plan in a way that’s going to be re-used and make sure it works. You need to make sure that the plan you’re putting in cache really is good for re-use!

Stabilizing execution plans with NORECOMPUTE

NORECOMPUTE - flimsy tape
NORECOMPUTE – flimsy tape

If this doesn’t sound quite crazy enough for you, you can go a little farther and try to increase the chances of your “good” plan staying in cache longer. One tool you can use for this is NORECOMPUTE.

When you update statistics on a table with NORECOMPUTE, you tell SQL Server not to automatically update statistics on the table as data changes. This will automatically happen when approximately 20% of the rows in the table have been modified (the algorithm is more complicated, but 20% is pretty easy to remember). Updated statistics will cause the optimizer to consider a new execution plan for your query. So NORECOMPUTE reduces the chance of the “good” query being bumped out.

If you use NORECOMPUTE, be aware that this could have a negative effect on some queries and cause them to get a terrible estimate on queries that they’re running. You probably want to manually update statistics for the table at least once a day if data changes in it. You can do this using a built in command like sp_updatestats, custom code you write yourself, or Ola Hallengren’s free index maintenance scripts (see Examples B & D for two options). Just please don’t do it with a maintenance plan.

Document the heck out of this. It’s easy for people to have no idea it’s in place, or find it and change it without knowing what it impacts. If plan guides are duct tape, this is more like Scotch Tape.

These Are Emergency Fixes – Don’t Start Your Performance Tuning Process With These Techniques

A lot of times you don’t need any of this crazy stuff. Remember: many times you can fix these issues with good indexing or simple code changes. Safety first!

Learn More in Our Training

Our training class explains how to get an execution plan, how to read the operators, and learn solutions to common query problems.


Oracle Terminology for the SQL Server DBA

Oracle, SQL Server
12 Comments
translation-monster
The translation team hard at work.

At some point you’re going to be confronted with an Oracle installation or even just an Oracle DBA. Communicating with a DBA who works on a different product can be difficult, it’s like speaking US English and having a conversation with a native English speaker from Scotland. The words are the same, but they have different meanings.

While this is by no means an exhaustive list, it will help SQL Server DBAs have a meaningful conversation with their Oracle colleagues.

Database
Oracle refers to the database as the data files on a disk that store data.

Database instance
The set of memory structures and system processes that manage database files. Basically, the instance is executables and memory. Oracle has some different terms to separate out plan cache, buffer pool, and other concepts. But at a high level, executables and memory make a database instance.

So far things seem the same. Up until Oracle 12c, though, these two concepts were close to one in the same – one instance of Oracle housed one database (things like Oracle RAC not included). One thing to take note of – Oracle on Windows runs within one process, just like SQL Server. On Linux, however, there will be multiple Oracle processes each with a clearly defined purpose.

Tablespace
A tablespace is roughly analogous to a filegroup. You can create tables and indexes inside a tablespace. Like a filegroup, you can take tablespace backups separate from the rest of the database.

Unlike SQL Server, each tablespace can have many different options – some tablespaces can be logged while others are not. During tablespace creation, DBAs can manage a variety of features of each tablespace including a separate undo tablespace (see below), per user disk quotas, logging, or even on-disk block size (this can be helpful when dealing with LOB data).

In short, Oracle DBAs can customize database behavior at the tablespace level as well as at the database level. This can be useful for controlling archive data performance, blobs, or managing other aspects of storage.

This tablespace is vast and untouched.

Default tablespace
Every user is created with a default tablespace. The default tablespace defines where that user’s tables and indexes will be created unless a different location is specified. This is like setting up a default filegroup, but it can be set per user instead of per database, and it provides finer grained control. A default tablespace is not like a default schema in SQL Server – users can create objects with different schemas inside their default tablespace. This isn’t related to object ownership like schemas in SQL Server, it’s related to object placement on disk.

Temporary tablespace
You know how SQL Server has one tempdb? Within Oracle, database administrators can specify a different temporary work space on a user by user basis. Fast OLTP workloads can have access to SSD temporary tablespace while data warehouse queries and ETL jobs can have their own temporary tablespace that uses rotational disks. Heck, you could even allocate PCI-Express storage for executives’ temporary tablespace if they needed lightning fast joins or just wanted to foot the bill for PCI-Express storage.

Undo tablespace
Oracle uses MVCC by default (in SQL Server you’d call it READ COMMITTED SNAPSHOT ISOLATION). Row versions have to be stored somewhere, but there’s no tempdb. The undo tablespace is used to track changes that have been made and to put the database back into a consistent state if a transaction is rolled back. Although it is possible to create multiple undo tablespaces, only one undo tablespace will be used any single Oracle instance at a time.

If only one tablespace can be active per Oracle instance, why have multiple undo tablespaces? Oracle RAC can contain multiple Oracle instances reading the same database. Each of the Oracle RAC instances can have a separate undo tablespace. If this sounds confusing, don’t worry – Oracle RAC is complex and deserves a separate blog post.

Rollback
Once upon a time, Oracle DBAs had to configure the undo tablespace by hand. This was called the rollback segment. Poorly configured rollback segments led to “snapshot too old” errors and grumpy DBAs. If you ever encounter Oracle using a rollback segment, kindly ask the DBA why they aren’t using automatic rollback management (undo tablespaces).

Redo log files
It’s a transaction log file! A key Oracle difference is that everything gets logged, even the undo information. Redo log files are used just like SQL Server transaction log files.

Like SQL Server’s transaction log, Oracle can have multiple redo log files. These log files are written to in a circular fashion – the log files are written to in order and, when all log files are full, Oracle will circle around to the beginning again. Unlike SQL Server’s transaction log, you need to have multiple redo log files in Oracle. You can get by with two log files, but three or more is the preferred way to configure Oracle.

Unlike SQL Server, having multiple redo log files is the preferred way to manage Oracle logging. There are even multiple groups of redo log files, by default: two, but this can and should be configured, based on RPO/RTO needs.

Archived redo log files
These are redo log files that have been backed up. There are a number of ways to have Oracle automatically manage creating backups of redo log files that vary from manual to completely automated. If the disks storing these files fills up, Oracle will not be able to write to the data files – active redo log files can’t be archived any more. To ensure safety, writes are stopped.

Temporary tables
Oracle temporary tables are similar to SQL Server’s with one major exception – they’re statically defined. Even though an Oracle temp table definition will stick around until dropped, the data only persists for the duration of a session (or transaction if the table is configured that way).

The data inside a temporary table exists only for the current session – you can’t view data in another session’s temp table. The upside is that temp table metadata is always available for other users to query.

Backups
Oracle backups are very different from SQL Server backups – they’re both more simple and more complex than SQL Server at the same time. Many Oracle shops use a tool call Oracle Recovery Manager (RMAN) to handle database and redo log backups, archival, and even the expiration and deletion of backup files.


Our Senior DBA Training Class: Attendee Feedback

SQL Server
3 Comments

When we finish our courses, we ask attendees what they thought. Here’s what they said about our How to Be a Senior DBA class in Chicago:

“I’ve attended many trainings.  This is the most valuable I’ve ever attended.” – Tim Costello, Consultant

“ROI for training is always a gamble.  However, I felt like I received my money’s worth before lunch on the first day.  Outstanding!” – Zach Eagle, DBA

“The single best database class I’ve ever attended.  I feel challenged to step up not only my DBA game, but my presentation & training game as well.” – Ben Bausili, Consultant

Goat and Jedi not always included. But sometimes. Like in Chicago.

“I would tell people that this is the perfect course to take if you want to gain control of your environment and impress management.” – George Larkin, DBA

“This course is very in-depth and helpful to get information on the things you need to do in order to take your DBA skills to the next level.  The course is a bit overwhelming at times, but you need to have all of this detail.  Thanks to Brent and his team for answering any questions that came up and I would definitely recommend this course to others.” – Mike Hewitt, Software Engineer/DBA

“Outstanding training!  I knew very little about SANs & SSD.  I am now confident that I can troubleshoot on a higher level to determine if storage is ever our problem.  Thanks Ozar group!  You guys rock!” – Judy Beam, DBA

“Excellent format, content and team of presenters.  More like a conversation between peers than a boring lecture.  Fun and very meaningful.  You have a great team!” – Greg Noel, COO/CIO

“I came into the class with unfairly high expectations; Brent and Kendra somehow managed to exceed them.  Thank you guys!” – Ben Wyatt, DBA/Consultant

“How to be a Senior DBA is a consistently delivered training regimen that gives you useful tools and knowledge in a digestible and fun format.” – Luther Rochester, DBA

“Brent & the gang are approachable and easy to talk to.  They break down complex subject matter to easier to understand presentations.” – Kevin Murphy, Data Architect

“Far and away better than the MS courses.  The Ozar team knows their stuff and doesn’t pretend to know while they Google the answer on a break.” – Jon Worthy, IT

“This class is a must for every DBA.  All modules are well prepared & presented by two very well-respected SQL gurus in the community.  All questions & demos are answered & illustrated clearly.  I’ve learned a lot!” – Chai W., DBA

What will you say? Sign up now for the next one in Philadelphia this September or our Make SQL Server Apps Go Faster class in Seattle.


New sp_Blitz® v35 Checks for Unsupported and Dangerous SQL Server Builds

News broke recently of a dangerous data loss bug in SQL Server 2012 and 2014, and Aaron Bertrand explained which patch levels are affected. It’s kinda tricky, and I’m afraid most people aren’t even going to know about the bug – let alone whether or not they’re on a bad version.

I added build number checking into the latest version of sp_Blitz® so that you can just run it. If your build has the dangerous data loss bug, you’ll get a priority 20 warning about a dangerous build. If you’re running an out-of-support version, like SQL 2012 RTM with no service packs, you’ll get a priority 20 warning about that as well.

Other changes in the last couple of versions:

Changes in v35 – June 18, 2014:

  • John Hill fixed a bug in check 134 looking for deadlocks.
  • Robert Virag improved check 19 looking for replication subscribers.
  • Russell Hart improved check 34 to avoid blocking during restores.
  • Added check 126 for priority boost enabled. It was always in the non-default configurations check, but this one is so bad we called it out.
  • Added checks 128 and 129 for unsupported builds of SQL Server.
  • Added check 127 for unneccessary backups of ReportServerTempDB.
  • Changed fill factor threshold to <80% to match sp_BlitzIndex.

Changes in v34 – April 2, 2014:

  • Jason Pritchard fixed a bug in the plan cache analysis that did not return results when analyzing for high logical reads.
  • Kirby Richter @SqlKirby fixed a bug in check 75 (t-log sizes) that failed on really big transaction log files. (Not even gonna say how big.)
  • Oleg Ivashov improved check 94 (jobs without failure emails) to exclude SSRS jobs.
  • Added @SummaryMode parameter to return only one result set per finding.
  • Added check 124 for Performance: Deadlocks Happening Daily. Looks for more than 10 deadlocks per day.
  • Moved check 121 for Performance: Serializable Locking to be lower priority (down to 100 from 10) and only triggers when more than 10 minutes of the wait have happened since startup.
  • Changed checks 107-109 for Poison Waits to have higher thresholds, now looking at more than 5 seconds per hour of server uptime. Been up for 10 hours, we look for 50 seconds, that kind of thing.

Download the latest sp_Blitz®, or head over to the introduction page. Enjoy!


Monitoring SQL Server Transactional Replication

Replication
79 Comments
replication-latency
“It will catch up eventually. I hope.”

It was the best of times, it was the worst of times. I was a SQL Server DBA, and if something went wrong in Transactional Replication I needed to find out about it right away and help keep things healthy, day or night. Here’s what I learned from that experience about monitoring replication.

If you’re just getting started and need an introduction to transactional replication, head over here.

Tracer Tokens Aren’t Really Your Friend

“Tracer Tokens” were introduced in SQL Server 2005. They sound awfully good. Books Online explains that you can automate them using sys.sp_posttracertoken and report on them using sp_helptracertokenhistory.

There’s a big problem: tracer tokens are too patient.

Let’s say my replication is incredibly overwhelmed and I send out a tracer token. I won’t hear back until it reaches its destination or definitively fails. That could be a very, very long time. The fact that it’s potentially unknown means I don’t want to rely heavily on it for monitoring.

Don’t Rely Too Much on Replication Monitor (REPLMON.exe)

When replication is behind, it’s natural to turn to Replication Monitor. The first five links in “Monitoring Replication” in Books Online point to it, after all.

Replication Monitor isn’t all bad. But don’t depend on it too much, either.

  • Replication Monitor is a tool to help you answer the question “how are things doing right now?” It doesn’t baseline or give the kind of historical info that your manager wants to see.
  • Replication Monitor may run queries to count the number of undistributed commands that may take a while to run and be performance intensive (particularly when things get backed up in the distributor).

I’ve personally seem some cases where running more than one instance of Replication Monitor while a publication snapshot was being taken also caused blocking. Too many people checking to see “how much longer will this take?” actually caused things to take longer. It’s not just me, Microsoft recommends you avoid running multiple instances of Replication Monitor.

ReplMon protip: You can disable automatic refreshing for the Replication Monitor UI, and just refresh the data when you need it. More info in Books Online here. (Thanks to John Samson for this tip.)

Replication Monitor is useful, but you’re better off if people can get information on replication health without everyone having to run Replmon. You can do this fairly easily by using simpler tools to create dashboards to chart replication latency.

Easy Replication Monitoring: Alert on Latency with Canary Tables

It’s easy to build your own system for tracking replication latency for each publication. Here are the ingredients for the simplest version:

  • Add a table named dbo.Canary_PubName to each publication
  • dbo.Canary_PubName has a single row with a datetime column in it
  • A SQL Server Agent job on the publisher updates the datetime to the current timestamp every minute
  • A SQL Server Agent job on the subscriber checks dbo.Canary_PubName every minute and alerts if the difference between the current time and the timestamp is greater than N minutes

It’s very simple to extend this to a simple dashboard using a third party monitoring tool or SQL Server Reporting Services: you simply poll all the dbo.Canary tables and report on the number of minutes of latency on each server.

This simple process gets around the weaknesses of tracer tokens, and also gives you immediate insight into how much latency you have on each subscriber. Bonus: this exact same technique also works well with logshipping and AlwaysOn Availability Groups. Tastes great, less filling.

Medium Replication Monitoring: Notify when Undistributed Commands Rise in the Distribution Database

The distribution database is a special place for Transactional Replication. The log reader agent pulls information on what’s changed from the transaction log of the publication database and translates it into commands that hang out in the distribution database before the changes go out to subscribers.

If you have a lot of data modification occurring on the publisher, you can get a big backup of commands in the distribution database.

If replication performance is important, set up a SQL Server Agent job on your distribution server to regularly check the amount of undistributed commands. Have it alert you when the commands go above a given threshold.

Real world example: When I was the DBA for an environment with mission-critical replication, we would warn when undistributed commands rose above 500K and create a severity-1 ticket when they rose above 1 million. We did this after setting up dashboards to baseline replication latency and also baselining the amount of undistributed commands in distribution, so that we knew what our infrastructure could recover from and what might need DBA attention to recover in time.

Difficult Replication Monitoring: Alert When Individual Articles are Unhealthy

Here’s where things get tricky. It’s very difficult to prove that all articles in replication are healthy. The steps up to this point have tracked latency for the entire publication and bottlenecks in the distribution database.Things get pretty custom if you need to prove that individual tables are all up to date.

I once had a situation where a code release removed some articles from replication, modified the tables and data significantly, then re-added the articles to replication.

There was an issue with the scripts and one of the articles didn’t get put back into replication properly at the end of the process. Replication was working just fine. No script had explicitly dropped the table from the subscriber, so it just hung out there with stale data. The problem wasn’t discovered for a few days, and it was a bit difficult to track down. Unfortunately, the next week was kind of a downer because a lot of data had to be re-processed after that article was fixed.

Here’s what’s tricky: typically some articles change much more often than others. Monitoring individual articles typically requires baselining “normal” latency per article, then writing custom code that checks each article against the allowed latency. This is significantly more difficult for any large articles that don’t have a “Last Modified Date” style column.

(Disclaimer: in the case that you don’t have a “Last Modified” date on your subscriber, I do not suggest layering Change Tracking on top of the replication subscriber. If you are tempted to do that, first read my post on Performance Tuning Change Tracking, then go through all the steps that you would do if you needed to re-initialize replication or make schema changes on articles. You’ll change your mind by the end.)

Special Cases: The “Desktop Heap” is Used Up

This is a special case for replication. If you have a large amount of replication agents on a single server (such as 200 or more), you may run into issues where things just silently stop working due to desktop heap exhaustion. This is an issue that can be hard to identify because the agents just stop working!

Canary tables can help monitor for this, but you’ll need a lot of them since this can happen on an agent-by-agent basis. Read more about fixing desktop heap problem in replication in KB 949296. (Thanks to Michael Bourgon for suggesting we include this.)

Test Your Monitoring out in Staging

The #1 mistake I find with transactional replication is ignoring the staging environment. This is critical to supporting replication and creating effective monitoring for it.

The staging environment isn’t the same thing as development or QA. It’s a place where you have the same number of SQL Server instances as production, and the same replication setup as production. You test changes against staging before they go to production. You can also use it to test replication changes.

Staging is also where you confirm that your replication monitoring works. Data probably doesn’t constantly change in your staging environment, but that’s OK. Use canary tables and get creative to simulate load for test purposes.

Do You Have a Technique for Monitoring Replication Not Listed Here?

Tell us about it in the comments!