Get Top Resource-Consuming Queries
sp_BlitzCache™ will get the top resource-intensive queries in the plan cache. It’s safe to run on heavily loaded servers – it’s going to take a few seconds to run, but it won’t block execution of other queries.
This will not work on SQL Server 2005. You can download a legacy version of this script for your AMC Pacer.
How the query-cache script works
I encourage you to download the code and read through it to see how things work. Since you may not have the time to read through over 1,000 lines of T-SQL, here’s a quick overview of what’s going on in the query:
- The first several hundred lines of T-SQL build up dynamic SQL to execute – data is pulled from
sys.dm_exec_procedure_stats,sys.dm_exec_trigger_stats, andsys.dm_exec_query_statsand loaded into a temporary table. - There’s another hundred or so lines of updates to the temporary table to populate the extra columns like
PercentCPU. - Finally, there are two queries that produce the output of the plan cache analysis. One is a summary of the top problems found in query plans and the other displays the top poorly performing queries on the server.
- If you need to export it to Excel, just use the
@export_to_excel = 1parameter. This won’t include the execution plan, but that’s okay – you don’t want that in Excel anyway.
How to read the query-cache output
There are a lot of columns in this script, but they can be broken down into several categories: execution count stats, query data, CPU stats, duration stats, I/O stats, and query metadata.

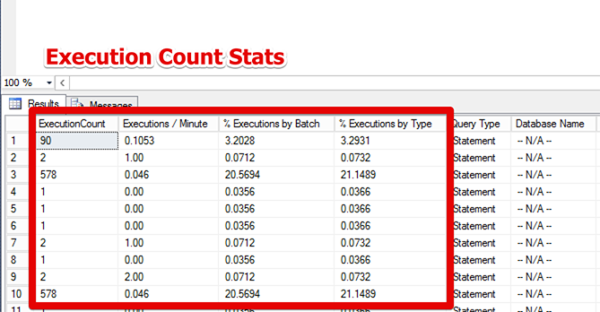
Execution Count Stats – this section includes self-explanatory information like ExecutionCount and Executions / Minute as well as some less than obvious columns like % Executions by Batch and % Executions by Type.
- The % Executions by Batch column computes the percentage of total executions for the batch of statements that resulted in this particular statement, procedure, or trigger. This gives you an accurate picture of how often a bigger chunk of code is running – if we didn’t aggregate by batch, a frequently executed procedure with 4 statements could dramatically skew results.
- The % Executions by Type shows how frequently this particular batch of queries has been run within its particular type of query (procedure, statement, or trigger). This helps you narrow down problem queries without having to modify the SQL used to generate the report.

CPU stats, duration stats, and I/O stats are all similar to the Execution Count Stats section. Each one features a Total, Average and two percentage based columns – one that’s the percentage of total recorded resources consumed and another that’s a percentage within a particular type of query.

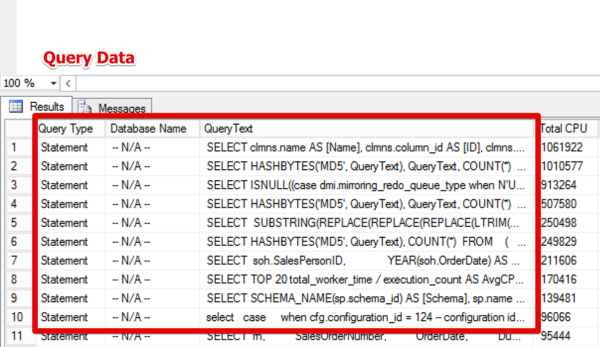
Query Data – this gives you some basic information about the query.
- Query Type will fall into one of three literal values: “Stored Procedure”, “Statement”, or “Trigger”.
- Database Name – Statements, unfortunately, do not report back the database that they’re running in – it’s up to you to look at the query text or execution plan to determine theDatabase Name.
- Query Text contains a copy of the query text with newlines, tabs, and extra whitespace removed. If you want to format the query, head on over to Format SQL (Flash required).

Query Metadata – exciting metadata about the plan in the cache.
- Created At lets you know when this plan was last compiled.
- Last Execution – when was the last time this query was executed?
- Plan Handle – can be fun for digging into plan stats from different DMVs.
- Query Plan – it’s a query plan.
The plan cache isn’t perfect; there are a number of reasons why queries won’t show up in the plan cache, or the same query might show up multiple times, each with its own resource counts.
Learn More in Our Execution Plan Training
Our How to Read Execution Plans Training explains how to get an execution plan, how to read the operators, and learn solutions to common query problems.

1 Comment.
[…] Source […]