Blog

Can deleting rows make a table…bigger?

Indexing
21 Comments

Michael J. Swart posted an interesting question: he had a large table with 7.5 billion rows and 5 indexes. When he deleted 10 million rows, he noticed that the indexes were getting larger, not smaller.

Here’s one way that deletes can cause a table to grow:

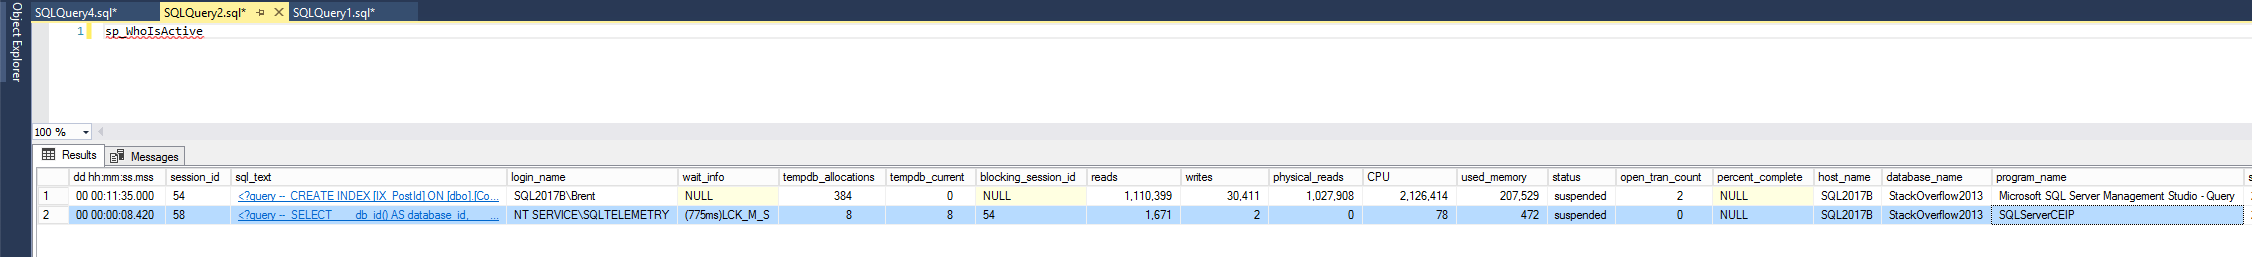
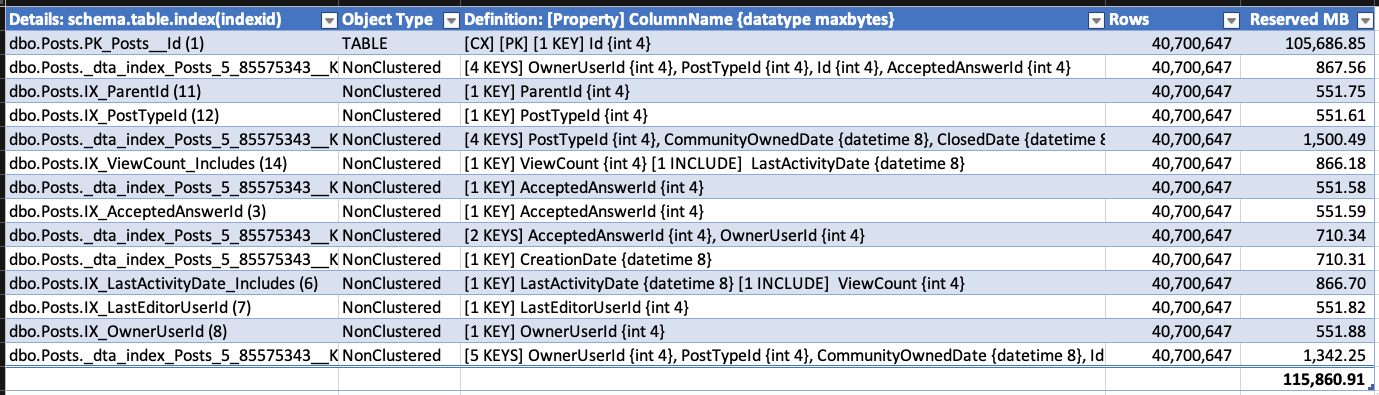
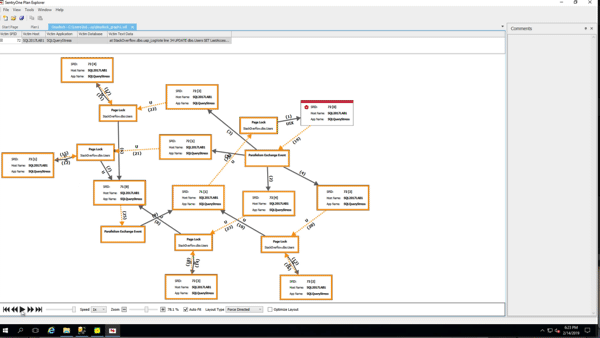
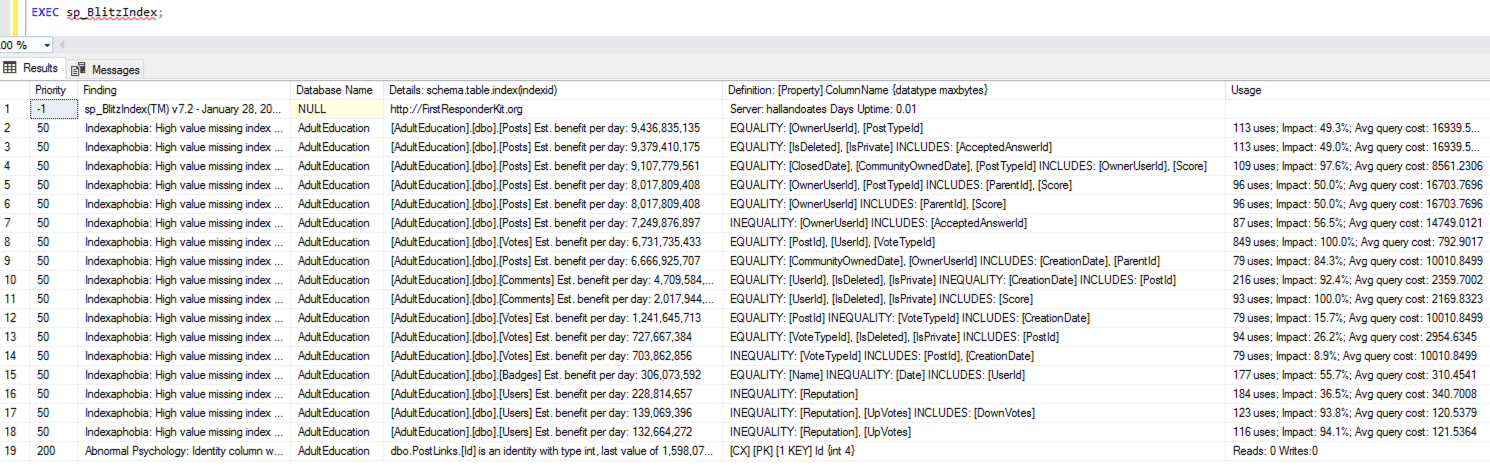
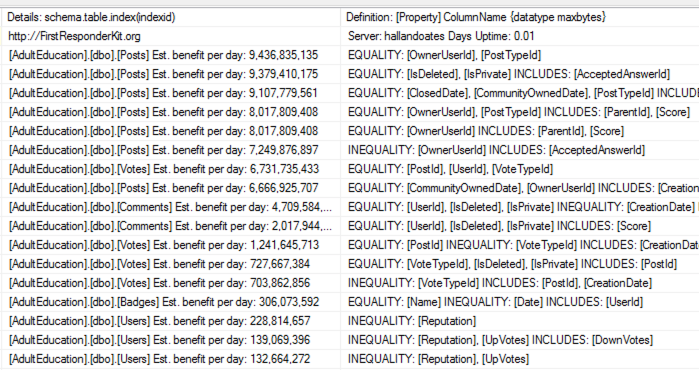
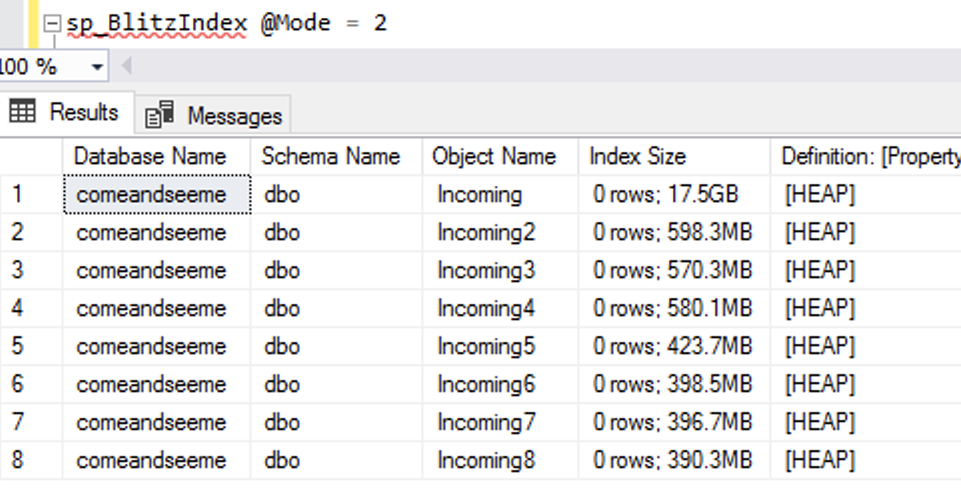
To demonstrate the growth, I took the Stack Overflow database (which doesn’t have RCSI enabled) and created a bunch of indexes on the Posts table. I checked index sizes with sp_BlitzIndex @Mode = 2 (copy/pasted into a spreadsheet, and cleaned up a little to maximize info density):

sp_BlitzIndex before

I then deleted about half of the rows:

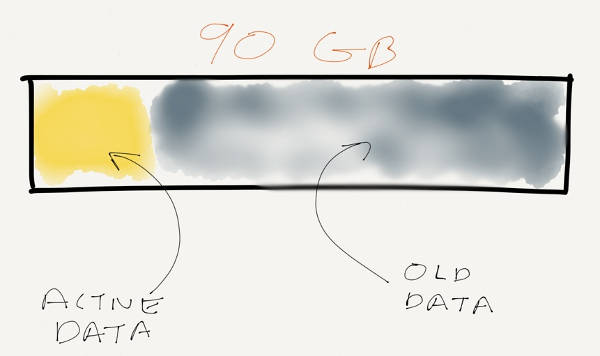
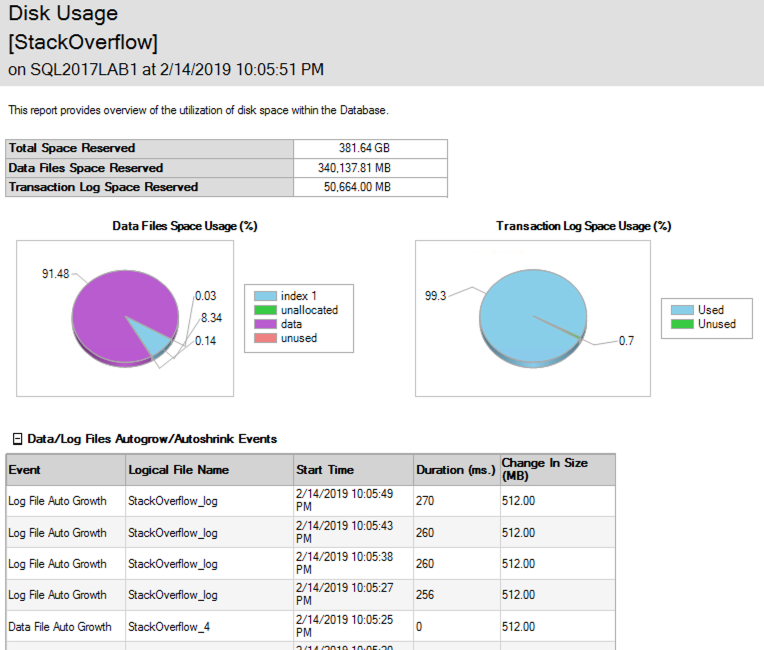
Amusingly, while the deletes were happening, the data file was growing to accommodate the timestamps, too! The SSMS Disk Usage Report shows the growth events – here’s just the top to illustrate:

SSMS Disk Usage Report

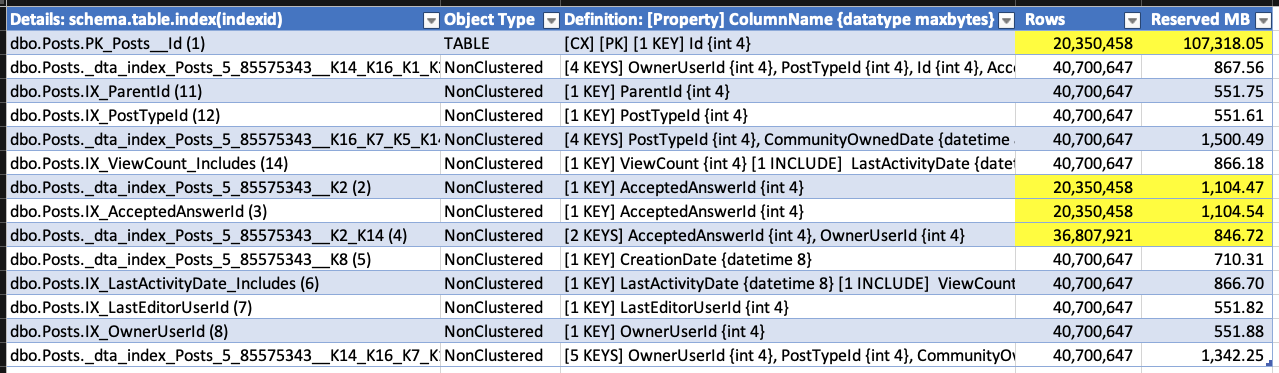
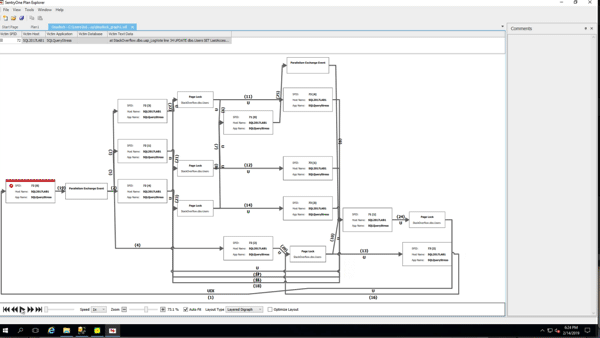
(Gotta love a demo where deletes make the database grow.) While the delete was running, I ran sp_BlitzIndex again. Note that the clustered index has less rows, but its size has already grown by about 1.5GB. The nonclustered indexes on AcceptedAnswerId have grown dramatically – they’re indexes on a small value that’s mostly null, so their index sizes have nearly doubled!

I don’t have to wait for the deletion to finish to prove that out, so I’ll stop the demo there. Point being: when you do big deletions on a table that was implemented before RCSI, SI, or AGs were enabled, the indexes (including the clustered) can actually grow to accommodate the addition of the version store timestamp.

Things you might take away from this:

  • RCSI, SI, and AGs have cost overheads you might not initially consider
  • After enabling RCSI, SI, or an AG, rebuild your indexes – not that it’s going to make your life better, it’s just that you can control when the page splits, object growth, fragmentation, and logged activity happens instead of waiting around for it to hit when you’re in a rush to do something
  • Offline index rebuilds seems to have a related effect too – Swart noted in a comment that when he tested them, they were rebuilt without the 14-byte version stamp, meaning that subsequent updates and deletes incurred the page splits and object growth
  • I have really strange hobbies

[Video] Demoing SQL Server 2019’s new Accelerated Database Recovery

SQL Server 2019, Videos
9 Comments

Wouldn’t it be nice if rollbacks just finished instantly? Wouldn’t you love for startup times to be near-zero even when SQL Server crashed just as someone in the middle of a transaction? How much would you pay for all this? (Well, I’m a little afraid to ask that, since we don’t know yet whether this is an Enterprise-only feature, but dang, I sure hope not.)

Here’s how Accelerated Database Recovery works in SQL Server 2019:

In the video, I’m using the Stack Overflow 2013 (50GB) database with this script:

You can learn about the internals in the Azure SQL DB documentation on that same feature.


New Objects, Columns, and Messages in SQL Server 2019 CTP 2.3

SQL Server 2019
6 Comments

Sure, there’s official documentation on what’s new in SQL Server 2019, but Microsoft’s notorious for slipping undocumented stuff in. Sometimes these new features become officially documented in subsequent preview builds, like CTP 2.2’s initial plumbing for Accelerated Database Recovery that went officially public in CTP 2.3, and other times they never see the light of day, like Snapshot Materialized Views.

To unearth this stuff, I use this linked server technique, joining between old & new versions of the product, and query the system tables for changes. Here’s what’s new in SQL Server 2019 CTP 2.3:

New objects in CTP 2.3:

New objects in SQL Server 2019 CTP 2.3

New columns in existing objects in master:

New columns in existing objects

New error messages:

  • 3644: Prefaulter task failed for file %ls with error %d.
  • 3868: Failed to start tempdb in Hekaton mode. Continuing tempdb startup in SQL mode.
  • 5153: OVERFLOW is not supported in Alter Database modify statement in Sql DW back door.
  • 5346: DATAFILETYPE option cannot be provided without WITH schema.
  • 5347: USE_TYPE_DEFAULT option cannot be provided without WITH schema.
  • 7439: Fail to read required information about %S_MSG pool %S_MSG.
  • 7440: Remote execution status: “%ls” .
  • 8677: Cannot create the clustered index ‘%.*ls’ on view ‘%.*ls’ because it does not aggregate results. Consider changing the view definition.
  • 8705: A DML statement encountered a missing entry in index ID %d of table ID %d, in the database ‘%.*ls’ due to an interaction with another transaction. If you continue to see this error, consider using Repeatable Read or higher isolation level.
  • 13784: Setting SYSTEM_VERSIONING to ON failed because column ‘%.*ls’ does not have the same sensitivity classification in tables ‘%.*ls’ and ‘%.*ls’.
  • 13785: System-versioned table schema modification failed because column ‘%.*ls’ does not have the same sensitivity classification in tables ‘%.*ls’ and ‘%.*ls’.
  • 13810: Column ‘%ls’ is of type ‘%ls’ which is not supported with file format ‘%ls’.
  • 13962: The alias or identifier ‘%.*ls’ is not the last node in a shortest path pattern. Only the last node in the path can be used with LAST_NODE().
  • 13963: Node table name or alias ‘%.*s’ refers to a derived table and cannot be used by the LAST_NODE function.
  • 13964: The two aliases ‘%.*s’ and ‘%.*s’ refer to different underlying objects in a LAST_NODE equality expression.
  • 13965: The table name or alias ‘%.*s’ must use the LAST_NODE function to reference the last node in a shortest_path expression.
  • 14173: Replication-%s: agent initialization failed. %s
  • 15807: Provided statement is not supported.
  • 15808: Schema cannot be determined from data files for file format ‘%.*ls’. Please use WITH clause of OPENROWSET to define schema.
  • 15809: No files found matching the name pattern(s) ‘%ls’.
  • 15810: Error trying to retrieve schema from the data file ‘%.*ls’. Make sure the file matches the ‘%.*ls’ format.
  • 15811: No columns found in the data file ‘%ls’.
  • 15812: Number of columns in the data file ‘%ls’ exceeds the maximum of %d.
  • 15813: Error reading external file: ‘%s’.
  • 15814: Column ‘%s’ of type ‘%s’ is not compatible with external data type ‘%s’.
  • 15815: External data type ‘%s’ is currently not supported.
  • 16115: Sensitivity classifications cannot be added to a history table directly.
  • 17206: File %ls, file number %d is successfully mapped.
  • 17209: File %ls, file number %d: File size is not configured multiple of the minimum size of a large page.
  • 19515: Database partner is missing during database restart.
  • 22301: DW FIDO mode is not enabled.
  • 22302: DW FIDO transaction context not found.
  • 22303: Updates are not allowed from a FIDO Scan transaction.
  • 22304: Reading or Writing to database files is not supported in FIDO DBs.
  • 22305: A NULL or unexpected value was retured by a FIDO ODBC call.
  • 22306: Only CCI tables are allowed in Fido mode.
  • 22307: Alter statements are only allowed from a FIDO Alter transaction.
  • 22308: Fido thread failed to acquire a lock.
  • 22309: Fido Cache DB not found.
  • 22310: Failed to create Fido DB with key: [%.*ls].
  • 22311: Generic Fido out of bounds error.
  • 22312: Failed to remap rowset with Id ‘%I64d’ on a Fido DB.
  • 22313: Failed to find Fido columns in rowset with Id ‘%I64d’.
  • 22314: Fido invalid ODBC connection.
  • 22315: Invalid Fido Transaction type %d.
  • 22316: Failed to acquire CSI Cache lock.
  • 22317: Fido invalid ODBC column.
  • 22318: Fido ODBC transaction failed a commit.
  • 22319: An invalid access to a Fido DB Rowset (DbId ‘%lu’, RowsetId ‘%I64d) was performed.
  • 22320: Fido DB (DbId:’%lu’, Name: ‘%.*ls’) can only be used under a Fido session context.
  • 22321: Fido DB (DbId:’%lu’, Name: ‘%.*ls’) cannot be used. Only DbId: ‘%lu’ is allowed.
  • 27803: Message reported from (%.*s) device on device Id (%I64d), code : %d, message : %.*s .
  • 27804: Query failed on HPC device Id (%I64d), with error code %d .
  • 33554: Encountered error 0x%08lx while waiting for encryption scan completion consensus. See the errorlog for details.
  • 33555: Unable to find the user-specified certificate [Cert Hash “%hs”] in the certificate store of the local computer or current user. Please verify if the certificate exists.
  • 33556: Invalid character in the thumbprint [Cert Hash “%hs”]. Please provide a certificate with valid thumbprint.
  • 33557: Invalid thumbprint length [Cert Hash “%hs”]. Please provide a certificate with valid thumbprint.
  • 33558: Encryption scan can not be resumed because no encryption scan is in progress.
  • 33559: Specified workload group does not exist. Retry with a valid workload group.
  • 33560: TDE Encryption scan suspended for database id [%d]. Will not auto resume. Please resume manually to restart.
  • 33561: Encryption scan can not be suspended because no encryption scan is in progress.
  • 33562: TDE encryption scan state cannot be updated for database id [%d].
  • 35513: compute
  • 37201: An instance pool could not be found with name ‘%.*ls’.
  • 37202: “An instance pool with name ‘%.*ls’ is busy with another ongoing operation.
  • 37203: An instance pool with name ‘%.*ls’ is not empty.
  • 37204: An instance pool with name ‘%.*ls’ does not have enough vCore capacity for given request.
  • 39112: Duplicate file specification supplied for platform ‘%.*ls’.
  • 39113: Number of file specifications exceeds the maximum of %d.
  • 40977: ‘%.*ls’ is not a supported timezone.
  • 41670: Cannot retrieve tempdb remote file lease order id.
  • 41871: Failed to recreate XTP non-durable tables during recovery of the database ‘%.*ls’.
  • 41935: Managed Instance has reached the total capacity of underlying Azure storage account. Azure Premium Storage account is limited to 35TB of allocated space.
  • 43037: An internal error was encountered when processing the restore request. This request has been assigned a tracing ID of ‘%.*ls’. Message is ‘%.*ls’, and details are ‘%.*ls’. Provide this tracing ID/Message/Details to customer support when you need assistance.
  • 45433: The specified family %ls is not consistent with the specified SKU %ls.
  • 45434: The point in time ‘%.*ls’ for restoration can’t be later than now.
  • 45435: The operation could not be completed. The requested sku update would cause the master server to have a larger max_connections value than its replica(s).
  • 45436: The operation could not be completed. The requested storage update would cause the master server to have a larger storage size than its replica(s).
  • 45437: The operation could not be completed. Replication is not enabled for the server.
  • 45438: The timezone cannot be changed on Managed Instance.
  • 45439: Cannot create a Managed Instance with timezone ‘%.*ls’. Please use timezone ‘UTC’ instead.
  • 45440: Cannot create a Managed Instance as there are not enough available ip addresses in the selected subnet.
  • 45441: Elastic server restore verification is not supported.
  • 47131: Create or Join availability group ‘%.*ls’ has failed because there is a system availability group. Remove system availability group, then retry the operation.
  • 49410: Change tracking is currently not supported in this version of SQL Server.
  • 49510: Managed instance is busy with another operation. Please try your operation later.
  • 49511: Unable to set one or more trace flags. Unsupported trace flag(s): %ls%ls%ls.
  • 49512: Session level trace flags are not supported on managed instance.
  • 49972: Cannot add tempdb remote file to local tempdb filegroup in transition to primary.
  • 49973: Cannot remove tempdb remote file to local tempdb filegroup in transition to primary.

No new rows in sys.configurations and no new Perfmon counters. Happy spelunking!


What was the first SQL Server concept that stumped you?

Processes and Practices
20 Comments

What’s the first thing you remember struggling with on SQL Server? Your first memory of, “Dang, I just can’t figure this out,” and then you had a Eureka moment later when it was so much more clear?”

I asked folks on Twitter, and the answers were great, so I had to round ’em up here to share ’em with you:

Oh, man, that was a stumper for me too. I remember having to whiteboard out a couple of tables and think through the logic to put it together.

I still struggle with those. I have to copy/paste from a starter script whenever I write those, because I just can’t remember the syntax.

The first time I saw SQL Server rewrite my query in a different order, I wanted to bang on the box and go, “THANK YOU, WHATEVER MAGIC GENIE IS INSIDE HERE!”

Active Directory groups did that to me too at first – as in, “Wait, this person isn’t listed anywhere in the server, how on earth were they able to do that?” Especially when they’d been later removed from the group.

Itzik’s demos are always chock full of those moments for me. He’ll show something, and it’ll vaguely register, but if I’m facing a particular problem at the moment, I’ll learn something new every time.

That constantly surprises people in classes, too!

https://twitter.com/Kevin3NF/status/1098940501636644865

When I query msdb.dbo.backupset, I still have to remind myself, “Oh yeah, D isn’t Differential.”

UNSUBSCRIBE


Where do I file bugs and feature requests for Microsoft Data Platform products?

It’s not just you: it’s hard for all of us to figure out where to go when we find a bug or want to add a feature. Here’s a quick rundown:

  • Azure Data Studioopen an issue in the Github repo. While you open an issue, Github helps by searching the existing issues as you’re typing, so you’ll find out if there’s already a similar existing issue.
  • Azure SQL DBfile feedback requests here. However, the search functionality is pretty terrible: before you open a request, try searching Google with the site:https://feedback.azure.com/forums/217321-sql-database parameter, like this search. That restricts your search results to just that portion of Azure Feedback.
  • Azure SQL DB Managed Instancesfile feedback requests here.
  • Power BIfile ideas here.
  • SQL Serverfile feedback requests here.
  • SQL Server Management Studio – right now, this one is kinda in flux. If you click Help, Technical Support in SSMS, it takes you here, but that’s the same feedback forum as SQL Server. There’s also a SQL Server Tools forum at MSDN monitored by Microsoft staff, but it’s not kept up to date – for example, the top pinned note talks about where to submit defect reports, and it still refers you to Connect, which has been dead for over a year.
  • SQL Server Data Tools – like SSMS, this one’s in flux, and your best bet is the SSDT forum on MSDN.

There’s a bottleneck in Azure SQL DB storage throughput.

Azure SQL DB
82 Comments

As you pay more for Business Critical Azure SQL DB servers, they’re supposed to get more storage throughput. The documentation on this is kinda hard to read, but boiling it down, for every core you add to a Gen5 server, you’re supposed to get 2,500 IOPs. That should scale linearly: insert speed should go up evenly with each added core.

The bottom line of this screenshot shows the IOPs going up linearly from 16 cores at 40,000, up to 200,000 IOPs for 80 cores:

The bottom line

But can an 80-core server
write any faster than a
16-core server? Well…no.

Sounds like a trick question, doesn’t it?

Let’s start with the Stack Overflow database, which has a 104GB Posts table – 18GB of which is off-row text data because Lord knows y’all like to write some long questions and answers. Then we’ll run this simple query to copy that Posts table to a new one:

The query will go parallel, using more cores for the reading & writing – so will more cores help? Plus, when you move from an 8-core Azure SQL DB to an 80-core one, you get more memory, and theoretically, more storage throughput.

Drum roll please:

  • 8 cores, $1,991 per month: 64 minutes
  • 16 cores, $3,555 per month: 32 minutes (and interestingly, it’s the same speed with zone redundancy enabled)
  • 80 cores, $18,299 per month: 32 minutes
  • Just for reference: 8-core AWS EC2 i3.2xl VM, $1,424 per month with SQL Server Standard Edition licensing: 2 minutes (and I don’t put that in to tout AWS, I just happen to have most of my lab VMs there, so it was a quick comparison)

You can spend five times more,
but you hit a wall at 16 cores.

So why don’t more cores equal dramatically more speed? Your first thought is probably, “Well, Brent, that query isn’t CPU-bottlenecked” – and you’re only partially right, but also pretty wrong. Here’s the Azure Portal showing performance metrics on the 8-core setup while the insert is running:

The very light-colored line banging up against the top at 100% is the transaction log IO percentage. Our workload is simply limited by how much Azure is willing to write to disk at any one time. The CPU percentage is 6%, and the read IO is 7%. Even with only 8 cores, we’re paying for CPUs that are sitting around bored.

Upgrade the server from 8 cores to 16 cores, and the load speeds double – which is great! Now, what’s our bottleneck – here are the load metrics on the 16-core box:

We’re still transaction-log-file-bottlenecked at 100%, and the only way to get more transaction log throughput is to buy more cores. So throw 80 cores at it, and:

The only thing happening here is that the CPU load is going down, but storage throughput isn’t getting faster. Our workload completes in the same 32 minutes.

This also leads to some interesting MAXDOP behavior. On all of the servers, restricting the query to MAXDOP 1, 2, 4, or any other number didn’t seem to affect the query’s runtime at all. The storage limit is the storage limit, full stop.

The takeaway: bottlenecked on transaction log IO?
Right now, over 16 cores is a waste of money.

Just because sys.dm_db_resource_stats shows that you’re hitting a resource limit, and the documentation says that the limit will go up linearly as you add more cores, don’t trust that it will. You’re going to have to experiment with your workload and different Azure SQL DB sizes in order to find the sweet spot for how much you pay for how fast your query will go. Trust, but verify.

You might be spending more money, but hitting the same limits a 16-core server is hitting!

The old-school DBAs out there will say, “Yes, but if the transaction log file is your limit, you shouldn’t add more CPUs – you should be adding storage.” That’s the problem: in Azure SQL DB, you simply can’t. The documentation says you can by adding more CPUs, but as of this writing, it just isn’t true. I don’t have any inside information here, but there seems to be a problem with Azure SQL DB’s storage scalability. Either there’s a bug in the storage limits that were set, or the documentation isn’t right, because the throughput isn’t simply rising once you get to 16 cores.

Update 2019/02/26 – clarified that we’re talking about the transaction log file, not the error log file, per the discussion on Reddit.


Building SQL ConstantCare®: Europeans, what do you want to see in a cloud-based monitoring product?

SQL ConstantCare
24 Comments

About a year ago, with GDPR enforcement looming, we decided to hit the brakes on EU sales because we weren’t confident enough in the third party app ecosystem’s compliance capabilities, or the EU’s ability to police the regulation effectively.

In the time since, it’s been interesting to see that:

  • Few folks requested their data or the right to be deleted
  • Among others, Google got hit with a GDPR fine
  • The compliance ecosystem has gotten marginally better, but still not great
  • Brexit (or maybe not, who knows)
  • The EU’s working on a new copyright filter law (Julia Reda’s writing on that has been phenomenal)

Looking at that list, it’s not that I’m suddenly filled with an overwhelming confidence that it’s easy and cost-effective to build a product with GDPR compliance, AND to defend a company against an EU country’s GDPR inquiry. However, I do think that it’s time to start looking at what it would take to sell SQL ConstantCare® in the EU. I specifically mean to sell it though – not just what it would take to be compliant, but have a cloud product that Europeans would open their wallets for. (And I’m not even sure that’s a possibility yet, thus the post.)

Brent Ozar at the Porsche Museum
I’d like to house the EU’s most prized possessions in a United States garage, specifically mine

As we go down that road, I’m curious about Europeans’ opinions to a few questions:

  • Would your company even be open to a solution like that?
  • What kinds of objections have your managers raised about cloud-based products?
  • Have you tried to implement a cloud-based product, and failed? Or succeeded?
  • Between Amazon’s regions (Frankfurt, Ireland, London, Paris, and Stockholm), is there one that your company absolutely insists that its data must be stored in? (Strictly speaking, EU data residency isn’t a technical requirement, but companies often have political requirements.)

Let me know what you think in the comments. I’m not making promises that we’ll sell to the EU by the end of the year – but it’s something that we’re starting to consider.


What should you do about memory dumps?

A SQL Server monitoring tool is warning you that you’re getting memory dumps, and you’re wondering what that means.

This isn’t normal: you’re encountering a situation where SQL Server is so freaked out that it’s unable to proceed normally with a query. In order to help you (and really, Microsoft) debug the problem, it’s calling a time-out, writing the contents of some of its memory to disk, and then proceeding.

Think of it like going to a gas station, getting a questionable hot dog, and then realizing that you need to make an urgent trip to the bathroom to … undo that decision. So reading a dump file is kinda like…actually, this analogy is more apt than I’d originally thought!

Start by querying sys.dm_server_memory_dumps. Run this query:

That’ll tell you how many times it’s happened, and where the dump files live:

sys.dm_server_memory_dumps

If you’re comfortable with a debugger, read the post Intro to Debugging a Memory Dump by Microsoft’s Adam Saxton. Adam writes:

Having some development experience is also helpful. While you may not need to look at Code directly in a dump, you are looking at the results of code. The concept of Pointers is sometimes hard for someone to grasp that doesn’t necessarily have a programming background, but when dealing with a memory dump, or debugging, the understanding of how Pointers work can be very helpful. Even when we are debugging a Managed (.NET) application instead of a Native (C++ or non-managed) Application. Another good book is Windows via C/C++ by Jeffrey Rickter and Christophe Nasarre.

Don’t feel bad if that sounds terrifying – it’s terrifying to me too. I don’t read dump files either.

If you’re not comfortable with that, patch your SQL Server, then call Microsoft. I dunno about you, but I’ve never been particularly good with a debugger, and I certainly don’t wanna learn when I’m facing a production SQL Server that’s freaking out so badly that it’s dumping memory contents to disk.

Hit up SQLServerUpdates.com to grab the latest patch for your SQL Server and apply that. You’d be pleasantly surprised at how often Microsoft fixes bugs that cause memory dumps, and the bug you’re hitting has probably already been fixed. (I’d hate to have you waste money on a support call only to hear that the bug is already fixed.)

After applying the patch, if the memory dumps continue, open a support case with Microsoft. I know: you may have had rough support experiences in the past where you were told to defrag your turn signal fluid and reboot the firewall, but repeated memory dumps are different. Memory dumps are much easier for them to analyze because they see ’em more often, and they have more specialized tools at their disposal. (For a brief moment in time, you could upload your memory dumps for free in SSMS, but Microsoft took that down due to GDPR security concerns since the dumps can contain personally identifiable information like queries and data.)

Don’t dilly-dally: memory dumps are not a small deal. You wouldn’t wanna be making repeated trips to the bathroom after multiple gas station hot dogs – that’s no way to live your life. Your SQL Server deserves better.


You know what your deadlock graphs need? Animation.

Deadlocks
8 Comments

In SQL Server Management Studio, plain ol’ deadlock graphs look like this:

Two thumbs down, would not lock the dead again

BOOOOO-RING. That’s why I prefer opening deadlock graphs in SentryOne Plan Explorer, which presents a much better visual in the form of a circle…a circle, let’s just stop there:

Deadlock graph in SentryOne Plan Explorer

And Plan Explorer even has several different ways it can visualize deadlocks – hit the Layout Type dropdown at the bottom to choose:

Collect the whole set

However, during the last Mastering Index Tuning class, @Dan_Clemens pointed out the Play button at the bottom – somehow I’d totally missed that over the years! Check this out:

Playing the circular deadlock dance

And all of the layouts support playback, too! Here’s playback in the Force Directed layout:

And in the Layered Digraph:

Somehow, that makes troubleshooting deadlocks suck just a little less. Thanks, Dan!


Updated First Responder Kit and Consultant Toolkit for February 2019

I hereby christen this the Rich Benner Memorial Release. He’s still alive, it’s just that we’ll always remember him for the work he put into this month’s version. (I’m kidding, of course. We won’t remember him. (I’m kidding. Rich will appreciate the humor in that.))

You can download the updated FirstResponderKit.zip here, and Consultant Toolkit customers can grab their updated version in their My Accounts page. EU customers – check your email for the updated version.

Across-the-Board Changes

  • Improvement: you can now call the procs with @VersionCheckMode = 1, and they’ll just set their version number & date output variables, then immediately return without doing any work. (#1949, thanks Jeff Chulg for the great idea and implementation.)

Here it is in action:

And the code for your copy/pasta delight:

sp_Blitz Changes

  • Improvement: new check for SSAS, SSIS, SSRS services running. (#1943, thanks Rich Benner.)
  • Improvement: added Azure SQL DB’s POOL_LOG_RATE_GOVERNOR as a poison wait. (#1971.)
  • Fix: updated out-of-support version list to mark that SQL 2012 pre-SP4 is now an unsupported build. (#1967, thanks Rich.)
  • Fix: typo in check IDs where check 222 was reporting that it was 114. (#1964, thanks Rich.)
  • Fix: typo in documentation where checks 203 and 224 were swapped. (#1966, thanks Rich.)

sp_BlitzCache Changes

  • Improvement: autocorrect for sort orders. If you pass in something that’s kinda-sorta-near a real sort order, we correct it. (#1945, thanks Rich Benner.)
  • Improvement: Azure SQL DB and Hyperscale compatibility. (#1935)
  • Fix: faster performance when you have a lot of missing indexes. We were missing a field in a join between two temp tables. (#1956, thanks Ron MacNeil for the eagle eye.)
  • Note: in this release, #1935 also renamed all of the ##bou_ temp tables without bou, so just ##BlitzCacheResults. This was done to reduce the BOU branding in the Consultant Toolkit in case your customers start reading the scripts.

sp_BlitzFirst Changes

  • Improvement: in the headline-news result set, batch requests/sec and wait time per core per second are now shown as decimals instead of integers. (#1940, thanks Rich Benner for being the perfect class attendee who actually improves the tools during the class.)
  • Improvement: added Azure SQL DB’s POOL_LOG_RATE_GOVERNOR as a poison wait. (#1971.)

sp_BlitzIndex Changes

  • Improvement: better index naming – removed the table name from the index to tighten up execution plan visualization. (#1938, thanks Rich Benner for doin’ it again.)
  • Fix: to work around a bug in sys.dm_db_stats_histogram and sys.dm_db_stats_properties, we now only show statistics for tables when your database context is the same as the database you’re analyzing. This means if you wanna examine stats, you’ve gotta be in the same database as the object you want to analyze. (#1947, thanks Morten Abrahamsen.)
  • Fix: works again with Azure SQL DB. (#1933, thanks Jacob Golden.)
  • Fix: output to table works again. (#1952, thanks Aram Pendley for the bug report and Matt Monroe for the bug fix.)
  • Fix: compression information truncation error for over 900 partitions. (#1973.)

Power BI Dashboard: Deprecated

You can totally keep using this, but you’re on your own for making improvements. Sadly, Power BI + source control = terrible nightmare. It’s a binary file, so it’s damn near impossible to deal with code contributions from outsiders.

Putting Power BI files in Github is bad for customers because when we update the Power BI file, you have to take it whole-hog, as-is. You can’t make your own tweaks, and then keep those tweaks with each release. You have to redo all your tweaks in their new version.

Putting Power BI files in Github is bad for open source maintainers because when someone wants to contribute changes, either they have to give you step-by-step instructions as to how to make the changes inside the PBIX file, or else you have to take their changed PBIX file as the new source of truth for your project. It’s like trying to source control Excel files when multiple people around the world are making changes.

The PBIX isn’t going away – it’s just moving into the Deprecated folder in Github. It’s still open source under the MIT License, so folks are absolutely welcome to take it and go start their own open source projects.

For Support

When you have questions about how the tools work, talk with the community in the #FirstResponderKit Slack channel. If you need a free invite, hit SQLslack.com. Be patient – it’s staffed with volunteers who have day jobs.

When you find a bug or want something changed, read the contributing.md file.

When you have a question about what the scripts found, first make sure you read the “More Details” URL for any warning you find. We put a lot of work into documentation, and we wouldn’t want someone to yell at you to go read the fine manual. After that, when you’ve still got questions about how something works in SQL Server, post a question at DBA.StackExchange.com and the community (that includes us!) will help. Include exact errors and any applicable screenshots, your SQL Server version number (including the build #), and the version of the tool you’re working with.

You can download the updated FirstResponderKit.zip here, and Consultant Toolkit customers can grab their updated version in their My Accounts page. EU customers – check your email for the updated version.


What does Azure SQL DB Automatic Index Tuning actually do, and when?

Azure SQL DB, Indexing
24 Comments

Azure SQL DB’s Automatic Tuning will create and drop indexes based on your workloads. It’s easy to enable – just go into your database in the Azure portal, Automatic Tuning, and then turn “on” for create and drop index:

ENGAGE

Let’s track what it does, and when. I set up Kendra Little‘s DDL trigger to log index changes, which produces a nice table showing who changed what indexes, when, and how:

Contents of Kendra’s logging table (click to zoom)

I wanted to do that because the documentation is a little hand-wavy about when these changes actually take effect:

You can either manually apply tuning recommendations using the portal or you can let Automatic tuning autonomously apply tuning recommendations for you. The benefits of letting the system autonomously apply tuning recommendations for you is that it automatically validates there exists a positive gain to the workload performance, and if there is no significant performance improvement detected, it will automatically revert the tuning recommendation. Please note that in case of queries affected by tuning recommendations that are not executed frequently, the validation phase can take up to 72 hrs by design.

To give my Azure SQL DB some horsepower to crank through these truly terrible queries, I gave it 8 cores, then fired up SQLQueryStress to run 20 simultaneous queries against it, and let it run for a day.

Setting up my workload

I took the queries from lab 2 in my Mastering Index Tuning class. We start with the Stack Overflow database with every table having a clustered index, but no nonclustered indexes at all. Students run a workload with SQLQueryStress, which populates the missing index DMVs and the plan cache, and then you have to put the pieces together to figure out the right indexes. Needless to say, it’s a Mastering class, and it’s purposely designed with pitfalls: if you rely on Clippy’s missing index recommendations, you’re gonna have a bad time.

I didn’t expect Clippy to be a master by any means – this automatic tuning feature is included with your Azure SQL DB bill at no extra charge. It’s free index tuning. I’m pretty much happy with ANY index improvements when they’re free! It’s a great feature for businesses that can’t afford to have a professional performance tuner hand-craft the finest artisanal indexes. (Also, those folks make mistakes.)

After letting the workload run overnight, here’s what Azure SQL DB’s performance metrics looked like:

100% CPU and 100% IO – for those of you who are new to performance tuning, the idea isn’t to score 100 points out of 100. (At the same time, it’s not to score 0 either, because then you’re overspending on resources.) We definitely need some index help – and good news, sp_BlitzIndex reports lots of opportunities for tuning:

Zooming in a little:

Plenty of opportunities on the Posts, Votes, Comments, Badges, and Users tables.

What did Automatic Tuning PLAN to do?

Over in the Azure portal, you can see what recommendations Automatic Tuning came up with:

I love it! All three of those look like good choices. I’m not disappointed that it only picked indexes on 3 of the 5 tables, nor am I disappointed that it picked so few indexes – I would always much rather have it err on the conservative side. That’s great!

That page in the portal doesn’t show the index includes, but if you drill down a level on each index, the includes are shown:

You can even click “View script” to get the creation T-SQL. I do wish they’d name ’em with the fields they’re on, but I understand that might be challenging given that folks may use really long field names. I can live with these names.

The Badges and Users indexes exactly matched the missing index DMVs’ recommendations. However, the Votes index was different, and it’s different in a way that gets me all tingly inside. Here were the missing index recommendations on the Votes table:

And here was the recommendation from Azure:

Azure managed to merge the first two recommendations together in a way that works successfully! Neither of the DMVs had included all 4 of those fields in a single index, but Azure did. Oh, Clippy, I love you, you’ve gone off to boarding school and passed high school chemistry. (Or maybe this is Clippy’s big sister, and I’m falling in love. Look, let’s not get bogged down in this metaphor.)

What did it ACTUALLY do, and when?

The above screenshots imply that this create-index statement is executing right now. The documentation says “Executing” means “The recommendation is being applied.” but that definitely isn’t true: the Users index shows as “Executing” as of 10:03PM, but hours later, the index still wasn’t there, and no create-index scripts were running.

I guessed maybe Azure was waiting for a lull in the load (love it!) so I stopped the load test and waited. About half an hour later, the index on Users magically appeared. I say “magically” because the DDL trace on index creations didn’t capture what Azure did. That is a bit of a bummer because it’ll make tracking what happened just a little bit harder. We’re going to have to use one mechanism (DDL triggers) to track user-modified indexes, and another mechanism to track Azure-modified indexes.

Azure exposes its tuning actions in sys.dm_db_tuning_recommendations:

Buckle up: the state and details columns are…JSON. Here are the example details for an index. <sigh> Developers love JSON because they can change the contents without having to change the database structure – they can just name a column “details” and then stuff it full of hot garbage without any forethought. I know, it’s not normalized stuff like you’re used to with the DMVs, but stay with me – this will come in handy a few paragraphs from now.

I happened to catch one of the indexes as it was being created. Here’s the live query plan in PasteThePlan:

It’s building the index with the Power of Dynamic SQL™. Here’s the query it’s running – it’s parameterized, but I switched the parameters into a declare, and ran it through format-sql.com to make it easier to read:

Interesting. That means the script you get in the portal isn’t exactly the same index creation script that Microsoft is actually running – note that this one is terminated with a semicolon, for example, but the portal’s version wasn’t.

How did that affect the server while it ran?

Regular readers may recall our recent adventure, How fast can a $21,468/mo Azure SQL DB load data? In that, I kept bumping up against transaction log throughput limits that seemed strangely low, like USB thumb drive slow.

Well, this is only an 8-core (not 80-core) server, so I did expect index creation (which is a write-heavy activity) to bump up against the log limits hard, and it did. Here’s a screenshot of a 60-second sample of sp_BlitzFirst while the Votes index creation was happening:

A few notes:

  • Log file growing – this strikes me as really odd because I’d loaded this entire database from scratch recently, going from 0 to 300+ GB. The log file shouldn’t have been small, and there hadn’t been write activity in the last half-hour before the index creations. There should have been plenty of space in the log file – which leads me to think that Microsoft is actually – and I hope you’re sitting down for this – shrinking the log file. For shame. That’s a real bummer, causing customer slowdowns for something that we all know is a terrible anti-pattern.
  • CXCONSUMER waits with an average of 467 seconds each? Each?!?
  • INSTANCE_LOG_RATE_GOVERNOR – ah, our throttle friend.
  • Physical write volumes (bottom of the screenshot) – the 8-core instance was able to write about 2GB of data in 60 seconds. Again, terrible USB thumb drive territory, but…not that much worse than the 80-core instance, which really makes me question what’s happening with the scalability of the IO in Azure SQL DB. (I’ve got a blog post coming up on that, and the short story is that while the documentation says IO scales linearly per-core, it…doesn’t. Not even close.)

After the index creations finished, I fired up my workload again.

How Automatic Tuning validates its changes

After the workload started again, the Azure portal showed the measurements it was taking for each of the indexes:

Badges index savings

This Badges index seems to have paid off well with huge DTU savings, although one of my queries regressed. (I’m curious how they’re measuring that given that many of the queries in my workload are joins across multiple tables, 3 of which got new indexes in this last round of index tuning.)

The Users table didn’t fare quite as well, only seeing minor improvements:

DTU savings on dbo.Users

In a perfect world, I’d love to be able to click on “Queries with regressed performance,” see the queries involved, and figure out how to hand craft better indexes for them. Unfortunately, while you can go to Query Insights, you’re left to start over with the filtering, trying to figure out which queries were involved.

The portal doesn’t do that, but…we might be able to, someday. Remember how I said that the JSON data in sys.dm_db_tuning_recommendations would come in handy? Well, for the automatic-plan-forcing part of Azure’s Automatic Tuning, the improved & regressed query plan IDs are stored in the JSON, and Grant Fritchey wrote a query to fetch ’em. There’s no reason Microsoft couldn’t do that same thing with the improved & regressed queries for the automatic index tuning – after all, they made the Details column a generic JSON dumping ground. They could add the query data in there, and here’s a feedback request to make that happen.

About six hours later, 2 of the 3 indexes showed as validated. Here’s the validation for the Votes index:

I feel so validated

Note that 2 queries got better, and 1 query got worse – but I can’t tell what that one query is. Again, no drilldown on “Queries with regressed performance,” and the Query Insights tab just takes you to the database’s overall insights, leaving you to start searching from scratch. Sure would be nice to have this here feature.

Summary: I love it.

Things I love:

  • It’s conservative
  • It’s doing deduplication, merging recommendations together
  • It’s not trying to apply the indexes during peak loads
  • It does a way better job of validating its changes than most DBAs

Things I don’t mind:

  • The execution scheduling is opaque
  • The index names aren’t great
  • The indexes take a long time to apply (but that’s an Azure SQL DB storage limitation, apparently)

Things I don’t like:

  • The validation report doesn’t show me which queries got worse or better (and I know Azure knows)

This feature is really appealing for the classic use case of a database server that doesn’t get any tender loving care from a database administrator. I’m sure the deeper I look at it, the more edge cases I’ll find, but…who cares? I have that same feeling about Clippy’s missing index recommendations, but I still rely on those every day as a starting point when I parachute into a new server. Used wisely, they can help you do a better job of tuning and let you focus more on the hard edge cases.


Building SQL ConstantCare® Version 2: Easy-to-Afford Monitoring

SQL ConstantCare
10 Comments

tl;dr – SQL ConstantCare® is now just $59 per month, or $495 per year.

As we were building SQL ConstantCare®, I wanted it to be mentoring, not monitoring. I wanted to take daily data samples, trend them over time, and give you big-picture advice on what tasks you should focus on to make your SQL Servers faster and more reliable.

I envisioned it having two parts:

  • Our robots would give you daily tactical advice
  • I’d check in weekly to give you bigger-picture strategic advice

Over the last year, I learned a lot!

Our robots are keeping you pretty busy. The basic care and feeding of a production SQL Server is more challenging than most folks expect. (For example, over the last week, 391 servers have databases with no recent corruption checks, and 168 servers have databases without a full backup.)

Our robots are getting smarter, too. Over the last couple of months, we’ve been gradually rolling out query plan advice. If you’re sending in query plans, then each Monday, we tell you which queries to focus on tuning, and what changes you need to make.

Implicit conversion warning

For example, if we detect that your most resource-intensive queries are suffering from implicit conversion, we tell you, and we include the query plans attached to the email so you can see exactly which ones to fix.

That’s still in early access because we still have work to do on that front. For example, early access user feedback noted that:

  • We need to add the database name in the query plan file name to make it easier to know which queries can be ignored (like from 3rd party apps, or known in-house tools)
  • We need to filter out commonly known queries & databases (for example, you can’t really tune Ola Hallengren’s maintenance scripts, or by popular monitoring tools)
  • We need to filter out really low-impact queries (because some servers are just flat out bored, and there’s no return-on-investment in tuning them)
  • We need to let you quickly mute specific queries (as in, yes, I know that query is terrible, and we have no plans to fix it because the person who wrote it left, and we’re replacing that part of the app)

You don’t necessarily need the video training bundled in. A lot of folks know what a particular warning means, and for warnings they haven’t seen before, they have plenty of resources available in the more-info links in each email anyway. We could save them money by not bundling the video training if folks don’t need it.

You don’t necessarily need the active mentoring, either. In a lot of shops, even the most basic robot alerts are keeping your hands so full that you don’t need to hear me check in. In many others, the servers just aren’t having bad performance problems, so there’s no sense in spending time diagnosing them – users just bought SQL ConstantCare® to keep an eye on the server’s overall health.

So we’re relaunching it: simpler, with an even lower price.

SQL ConstantCare® is now just $59 per month, or $495 per year.

That’s one easy-to-digest price that covers daily monitoring of all of your SQL Servers, regardless of their location. As always, it’s priced by email address that we send the alerts to – and we’ve found that most shops are just sending the alerts to a single distribution list email, and that keeps their costs down.

Then, if you need to step up to mentoring, you’ve got plenty of options: the Recorded Class Season Pass (and a team version), live training classes, or consulting with me.

As existing subscribers approach their renewal date, their subscription renewal pricing will automatically be updated to the new lower price in the my-account page. (Europeans, fret not: we’re working on a GDPR-friendly release, and I’ll write about that in next week’s post.)


[Video] How to Capture Baselines with sp_BlitzFirst

Everybody tells you to capture baselines – but what exactly are you supposed to capture? Which Perfmon counters matter? How do you track which data files are growing, and which ones are slow? How can you track which queries are using the most resources?

All you have to do is install the free, open source sp_BlitzFirst and sp_BlitzCache from our First Responder Kit, create a database to hold your results (I like to call mine DBAtools), and then set up an Agent job to run it every 15 minutes:

I show you how to do it and query the baseline data in today’s webcast:


Should you run SSAS/SSIS/SSRS on the SQL Server?

When you’re building a new SQL Server, you’re going to see a few intriguing checkboxes during setup.

SQL Server installation wizard
It’s all free, right? Check everything!

The services are all free, right? You can just check the boxes for Machine Learning Services, R, Python, Data Quality Services, PolyBase, Integration Services, Analysis Services, and Reporting Services – it’s not like you have to put more coins in the front of the server. So what’s the drawback? Why not collect ’em all? What are the pros and cons?

The more you install, the harder performance troubleshooting becomes. They all drink from the same pool of available CPU, memory, storage, and network throughput. When one of them is performing slowly, you’ll be constantly asking questions like:

  • “Is this slow because one of the other services are using all the power?”
  • “Is this service’s power consumption affecting other critical apps?”
  • “How can I monitor which one is using CPU/memory/etc at any given time?”

Patching and upgrades are harder, too. If your team actively uses these services, then at some point, they’re going to want to patch or upgrade just a portion of the services. Classic example: the BI team wants to move to a newer version of Analysis Services to support a cool new reporting tool, but the main app developers can’t certify their app on a newer version of the relational engine yet. If everything’s on the same box, this gets a lot harder. (Coordinating downtime is especially tricky.)

Uptime management is harder. If you want to make any of these services highly available, then you need to get clusters, load balancers, and things like Always On involved. Each of the features has its own unique ways of building high availability, and when you pile them into the same box, you’re not making your job easier.

However, Standard Edition licensing is easier. If you just bought enough licenses to cover this one VM or physical box, then you probably want to consolidate these services all onto that same box. You probably can’t afford to split them out across multiple boxes. (On the other hand, if you’re using Enterprise Edition and licensing per VM host, then you’re much better off splitting these into different VMs for the reasons we mentioned above – it’s not like it’ll cost you more for SQL Server licensing.)

Piling lots of services into the SQL Server does indeed have its costs – even when licensing is “free.”


How fast can a $21,468/mo Azure SQL DB load data? (Updated)

Microsoft Azure
30 Comments

Update March 19: Microsoft has since acknowledged a hidden limit, then documented it, then raised it – but it’s still disappointingly slow.

In my last post, I explored how fast a $5,436/mo Azure SQL DB Hyperscale could load data. I’d had a client who was curious about spinning up their dev environment up there to see how query plans might look different. Well, as long as I was running this test, I thought – “How does this compare with Azure SQL DB?”

There are 3 different products with similar names: Azure SQL DB, Managed Instances, and Hyperscale. In this post, I’m specifically talking about Azure SQL DB – not Managed Instances or Hyperscale. Managed Instances have a way easier method to ingest data – simply restore a database backup – so that one isn’t really worth exploring. There are a bunch of similar restore-a-backup requests for features to make restores easier in Azure SQL DB, they don’t exist today, so we’re stuck with the same options we had with Hyperscale:

To do this quickly and easily, I went with the first option (as I did in the last post with Hyperscale.)

Attempt #1: 80 cores, $20,088 per month.

The Data Migration Assistant and its documentation strongly suggest that you shouldn’t start small: you should over-provision your Azure SQL DB during the migration process:

"Microsoft strongly recommends that you temporarily change your Azure SQL Database to performance level P15 during the migration process for the optimal migration experience."
“Microsoft strongly recommends that you temporarily change your Azure SQL Database to performance level P15 during the migration process for the optimal migration experience.”

That seems fair – a P15 is 4,000 DTUs and up to 4TB storage. I was using the new Business Critical vCore model, though, so I maxed it out at 80 cores, 408GB RAM, $20,088 per month:

Gen 5, 80 cores, 408GB RAM, $20K USD per month

Note that it sys up to 200,000 IOPs, 1-2ms latency – that sounds like a pretty good target for data ingestion. Nothing in the wizard (or the documentation that I could find) seemed to tie data size to storage throughput – which is surprising, because I’ve seen that kind of relationship all over the cloud – but since it wasn’t mentioned, I just left it at 400GB (my database is 340GB.)

I fired up the Data Migration Assistant and let ‘er rip:

Migration in progress, one table done

You can’t read anything into the time numbers on this screenshot compared to the last post because the Data Migration Assistant doesn’t load tables in the same predictable order every time, and the times represent the point-in-time in the total load at which the table completed.

Why couldn’t it go faster? sp_BlitzFirst makes it easy to find out:

Maxed out

Note the “Database is Maxed Out” lines at the bottom, and in the details at the far right, we were bumping up against the max allowed log write percent. Ouch. The Azure portal showed writes maxing out too:

Log writes maxing out at 100%

Well, that was disappointing. (Note that in these screenshots, you’ll see server & database names switch around – that’s because I tried these tests with several different servers and instances in the hopes of getting past the log throughput limits.)

Attempt #2: 80 cores, 4TB storage, $21,468 per month

In the Azure portal provisioning wizard, I only had one remaining slider, and I cranked it as far to the right as I would go, upsizing my storage to 4TB (even though I only needed 340GB for the database) – hoping it would upsize my log rate throughput:

This one goes up to 11, and by 11, I mean 4

One of the awesome things about the cloud is that you can make these kinds of changes on the fly, and sure enough, it took less than 3 minutes for Azure to report that my storage upsize was complete.

Except I was still banging up against the log rate governor:

Maxed out my wallet

There are several interesting things to note in that screenshot:

  1. At the time of this screenshot, queries are waiting on writelog waits (but you can’t rely on point-in-time checks of individual queries)
  2. I’m hitting my DTU limits, and I’m getting poison LOG_RATE_GOVERNOR waits
  3. I’m averaging 96.85% of my allowed log throughput – not peaking at, but averaging
  4. Log backups are happening at the same time, which is probably also affecting my log rate throughput, but I can’t blame Microsoft for taking log backups
  5. In a 60-second sample, 4GB of data was read from the logs (most likely the log backups)
  6. In that same sample, 1.6GB was written to the data file, and 1.7GB to the log file, and averaged a nice and tidy zero milliseconds for the log file writes (very nice) – but in 60 seconds, that’s a only 28 megabytes of data per second to the log file. That’s USB thumb drive territory.

Eventually, it finished in 3 hours, 52 minutes – remarkably similar to the Hyperscale speeds:

And at first you’re probably saying, “Well, Brent, that means you’re bottlenecked by the source. Both Hyperscale and Azure SQL DB had the same ingestion speeds, and they have something in common: your data source.” That’s what I thought too, so…

Attempt #3: synthetic local loads

Just in case there was a problem with something with my Azure SQL DB instance, I blew it away and started again from scratch. I also took the Data Migration Assistant and networking completely out of the equation. I created a new 80-core Azure SQL DB, maxed out on storage, and loaded a table with junk contents from sys.messages – this way, I didn’t have to worry about any cross-server communication at all:

Waits while that happens:

Synthetic load test

We’re not hitting the log rate governor, but we might as well be. In any given 60-second sample, we waited for hundreds of log file growths, and we managed to write less than 2GB to the log file. 30MB/sec of write throughput is simply terrible – even if we’re growing out a 2GB log file, that’s just terrible for $21,468 per month. You really could do better with a USB thumb drive.

To really stress things out, I started 8 sessions all running that same insert query (with different table names.) I started hitting the log rate governor again, while still only writing about 1.5GB per minute:

Wait stat during 8 simultaneous loads

And then all of a sudden, my wait stats dropped to nothing! Things were flying, because…uh…wait a minute…

Well, that’s not good

Huh. All my queries had crashed at once. That’s not good, and I’d dig deeper to do a repro query, but…the beach is calling.

They left the database in a bit of an odd state, too – the tables were there, with pages allocated, but no rows, indicating they’d all rolled back:

Empty heapsj

That’s…not ideal.

Summary: Azure SQL DB’s log throughput
seems kinda slow for $21,468 per month.

This is faster.

You measure storage with 3 numbers:

  • How many operations you can perform (often abbreviated as IOPs)
  • The size of each operation (operations * size = total throughput, usually measured in MB/sec or GB/sec)
  • Latency of each operation (how long individual operations take to complete)

The latency was great – fast and predictable – but the log rate governor is capping throughput. It means you can’t do too many things at once – but boy, those few things you can do, they sure are fast. Having reliably low-latency operations is great for day-to-day transactional workloads that only do a few writes per user transaction, but…for data ingestion, it makes for slow going.

For imports, I really wish Azure SQL DB would have a mode to let you temporarily optimize for ingestion throughput rather than low latency. I don’t need sub-millisecond latency when I’m dealing with insert commands coming from another machine (especially less-than-optimized commands like the ones from Data Migration Assistant, which even ran into blocking problems during my loads, blocking themselves across threads.)

Have any of you migrated a sizable database (at least 100GB) into Azure SQL DB? If so, did you measure how long it took, like how many GB per hour you were able to import? Any tricks you found to work around the log rate governor?

Update March 9: Microsoft
acknowledged & documented the limit.

Microsoft contacted me, agreed that there’s a limit, and that it wasn’t documented for the public. They’ve now updated a few pages:

  • Single database limits – now shows the transaction log is limited 20 MBps for General Purpose, and 48 MBps for Business Critical.
  • Those limits are reached at 8 cores for GP and BC Gen4, and 16 cores for BC Gen 5.
  • Log limit workarounds – like load data into TempDB or use a clustered columnstore index for compression.

Ouch. 48 MBps really is bad, especially at $21,468 per month. This is such a great example of understanding the limitations of a product before you make that leap.

Update March 19: Microsoft raised the limit.

Within a few days of documenting the limit, Microsoft must have realized that it was just set entirely too low, and quietly raised it:

It’s twice as high now – 96 MB/sec – but…still uncompetitive with modern USB 3.0 thumb drives. Good to see that it’s moving in the right direction.


How fast can a $5,436/mo Azure SQL DB Hyperscale load data?

Hyperscale
16 Comments

A client asked, “How quickly could we spin up a full copy of our database in the new Azure SQL DB Hyperscale?” Their database size wasn’t too far off from the 340GB Stack Overflow database, so I decided to migrate that to Hyperscale to see how the experience went.

Hyperscale is Microsoft’s intriguing competitor to Amazon Aurora. Hyperscale gives you most of the SQL Server compatibility that you’re used to, but a wild new architecture under the hood. Let’s see how that new design affects ingestion rates.

Setting up Azure SQL DB Hyperscale

Hyperscale’s setup in the Azure portal is a little easier since it’s a new product: you just pick how many cores you want and how many replicas, and that’s it. You don’t have to define the database size ahead of time because, uh, this isn’t 2005. (Seriously, can we just talk for a minute about how archaic it is that Azure SQL DB makes you pick a maximum size, yet it doesn’t affect the pricing? They’re just handing you an uncooked chicken breast with their bare hands. You just know that’s going to come back to haunt you later.)

Azure SQL DB Hyperscale in the portal

I maxed out my core count for the database migration – I can always downsize it later after the ingestion finishes. About pricing – Hyperscale is in preview right now, and I wanna say preview prices are half of general availability prices, but don’t quote me on that.

Attempt #1: firing up the Data Migration Assistant
(but in an AWS VM)

You can’t just hand Microsoft a database backup and restore it into Hyperscale. (Azure SQL DB suffers from this same limitation, but Managed Instances do not.) If you wanna move a SQL Server database into Hyperscale, you have the same options that you have with Azure SQL DB:

I didn’t want to hassle with transactional replication just to get a development database up to the cloud, and I didn’t care about downtime, so I went with the first method, and followed the instructions to maximize performance during my move (except for one thing that I’ll mention at the end, and why it didn’t seem to matter.) If this was a production migration scenario, I’d probably spend a lot more time digging into the last option, but my eyes started glazing over in the documentation once I learned I had to set up custom VNets, and I had limited time to pull this project off.

I ran the Data Migration Assistant, and dear reader, let’s pause for a moment to give Microsoft a round of applause for that app. It’s delightfully easy to use, full stop. Connect to the source server, connect to the target, pick the stuff you wanna move, it warns you about problems, and we’re off to the races. It’s just powerful enough to get the job done, but easy enough that I can see a lot of just-barely-technical admins stepping through it. Nicely done.

And off we went.

However, the load speeds were…not what I was hoping. 20 minutes into it, I realized the database was going to take several hours, and I didn’t really wanna leave a $5,436 per month server running for a day. Plus, if anything broke about the migration, and I had to start over, I would be one angry fella. The DMA doesn’t have a resumable way to keep going if something goes wrong midway through loading a big table, although at least I can pick which tables I want to migrate. (That’s where the Azure Database Migration Service makes so much more sense for production workloads, and I’m gonna be honest: after the ease of use of the Data Migration Assistant, I’m really tempted to spend some time with the Database Migration Service just to see if it’s as elegantly simple.)

Good news: no artificial log write throttling!

I monitored performance with sp_BlitzFirst on both the SQL Server source and the Hyperscale target. The SQL Server source was all local solid state NVMe storage, so it wasn’t a read performance bottleneck. The Hyperscale wait stats were interesting though:

Before you read too much into this – note that wait stats changed dramatically during the loads. Having said that, annotated notes:

  1. At the time of this screenshot, queries are waiting on PAGEIOLATCH waits, reading data pages from data files, but you can’t rely on point-in-time checks of individual queries. Those 200-300 millisecond delays are a bit of a bad foreboding of what’s to come, though.
  2. A log file is growing – that’s something I saw repeatedly during my tests, and that makes perfect sense given that I’m ingesting ~340GB of data.
  3. Top wait type is ASYNC_NETWORK_IO, which makes sense given that we’re moving data across networks. This is a case where I wish the Data Migration Assistant pushed data across even more threads because I don’t think we’re bottlenecked on the target write side. However, the storage waits – PAGEIOLATCH – are kinda concerning, especially with the THREE TO FOUR HUNDRED MILLISECOND delays. Those are not small numbers.
  4. In a 60-second sample, we only managed to write 1GB to the data file and 1.5GB to the log. Even combined, that’s only 41.5 MB/sec – that’s USB thumb drive territory. Log file latency at 4ms is great given Hyperscale’s storage architecture, though.

Here’s another screenshot from a different point in the loads – note that this time around, we have similar storage throughput (2.7GB written in total in 60 seconds) yet near zero storage waits:

Hyperscale waits

Note what’s not in either screenshot: any governor waits. From the wait stats side at least, it didn’t look like we’re being throttled from writing more data. To drill deeper and examine sys.dm_db_resource_stats directly to see if we’re hitting the avg_log_write_percent limits:

sys.dm_db_resource_stats

Not even close to being throttled. That’s fantastic!

So was attempt #1 faster? No, but…

The Hyperscale FAQ notes that:

The transaction log with Hyperscale is practically infinite. You do not need to worry about running out of log space on a system that has a high log throughput. However, the log generation rate might be throttled for continuous aggressive workloads. The peak and average log generation rate is not yet known (still in preview).

I love that wording – it’s like they discovered a new species, not like they wrote the code themselves. My guess, and this is just a guess, is that the throttle limits are set artificially high right now while they figure out the best place to set the limits.

  • The good news is that loads weren’t being artificially throttled
  • The bad news is that they might implement throttling as we approach GA (but hey, live for today)
  • The great news is that if I put work into performance tuning this migration, I’d likely be able to ingest data way faster

Well, I’m curious, and my client was curious, so let’s do this.

Attempt #2: nearby Azure L8 VM as source

My original source SQL Server was in Amazon because that’s where the client keeps their stuff today too, but given the lack of log write throttling in Azure SQL DB Hyperscale, I decided to try with an Azure VM source.

My Hyperscale target database was in West US 2, so I spun up an Azure VM in that same region. To give Hyperscale a faster/closer source, I used an L8s v2 VM – that’s 8 cores, 64GB RAM, and over 1TB of local (ephemeral) NVMe storage. Most production database workloads aren’t run on ephemeral storage since of course you can lose the database when the VM goes down, but you can mitigate that with a lot of defensive scripting and Availability Groups. That is left as an exercise for the reader. For today, YOLO.

I logged into the newly created VM, downloaded the 340GB Stack Overflow database via BitTorrent, deleted the former tables in Hyperscale, installed the Azure Data Migration Assistant, and started the migration again. Full disclosure: because the import had gotten maybe 10% finished on attempt #1, some of the log file growths were already out of the way. (I deleted the Hyperscale tables rather than deleting the entire database and starting over.)

And…Hyperscale still maxed out at about 1.6GB in any given 60-second sample:

Still about 1.6GB per minute

And sys.dm_db_resource_stats still showed nowhere near the log_write_percent limits, whatever they’re set to:

sys.dm_db_resource_stats

Hmm. Disappointing. Well, as long as we’re here…

Attempt #3: synthetic local loads

Just in case there was a problem with something with my Hyperscale instance, I blew it away and started again from scratch. I also took the Data Migration Assistant and networking completely out of the equation. I created a new 80-core Hyperscale database, maxed out on storage, and loaded a table with junk contents from sys.messages – this way, I didn’t have to worry about any cross-server communication at all:

I ran that same query across 8 sessions, but with different table names on each so they wouldn’t conflict. Log write volumes did about double, doing about 3.6GB of log file writes in 60 seconds:

And no, we weren’t anywhere near the limits:

But now I’m pretty sure the “limits” are set to an imaginary number just to let the hardware do as many writes as it can. I like that. I also like the Autobahn.

Attempt #4: letting it run overnight

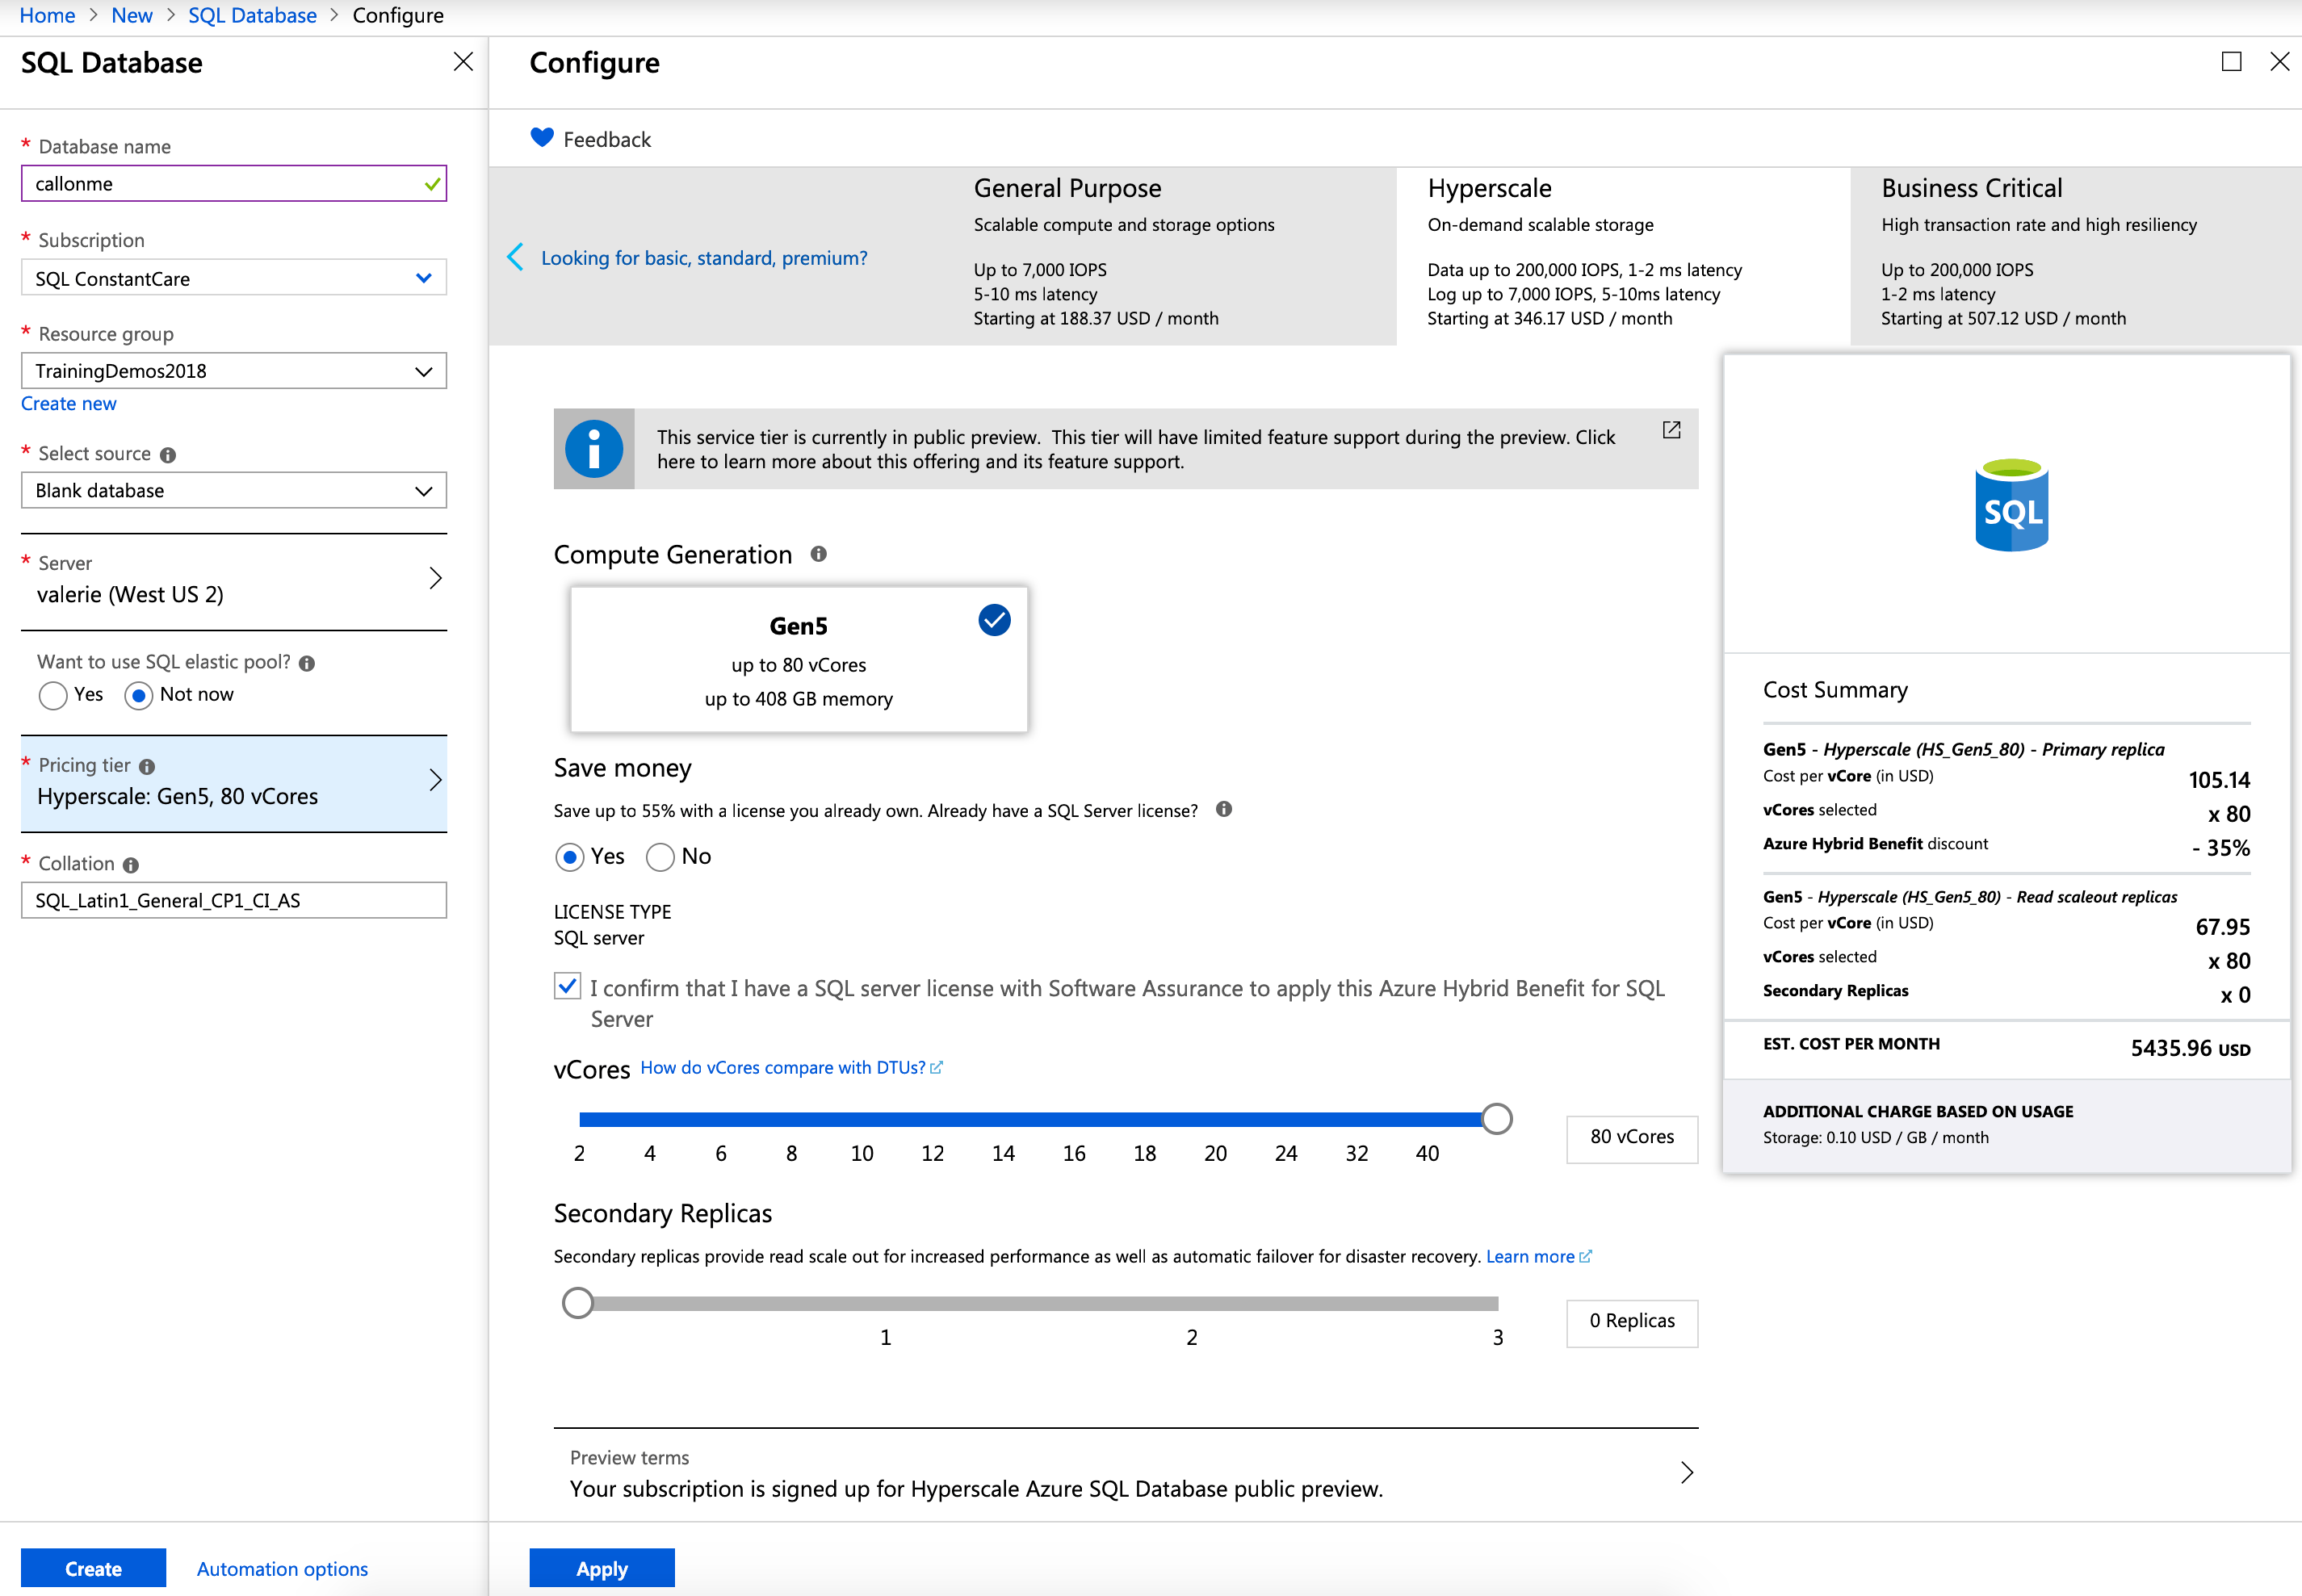
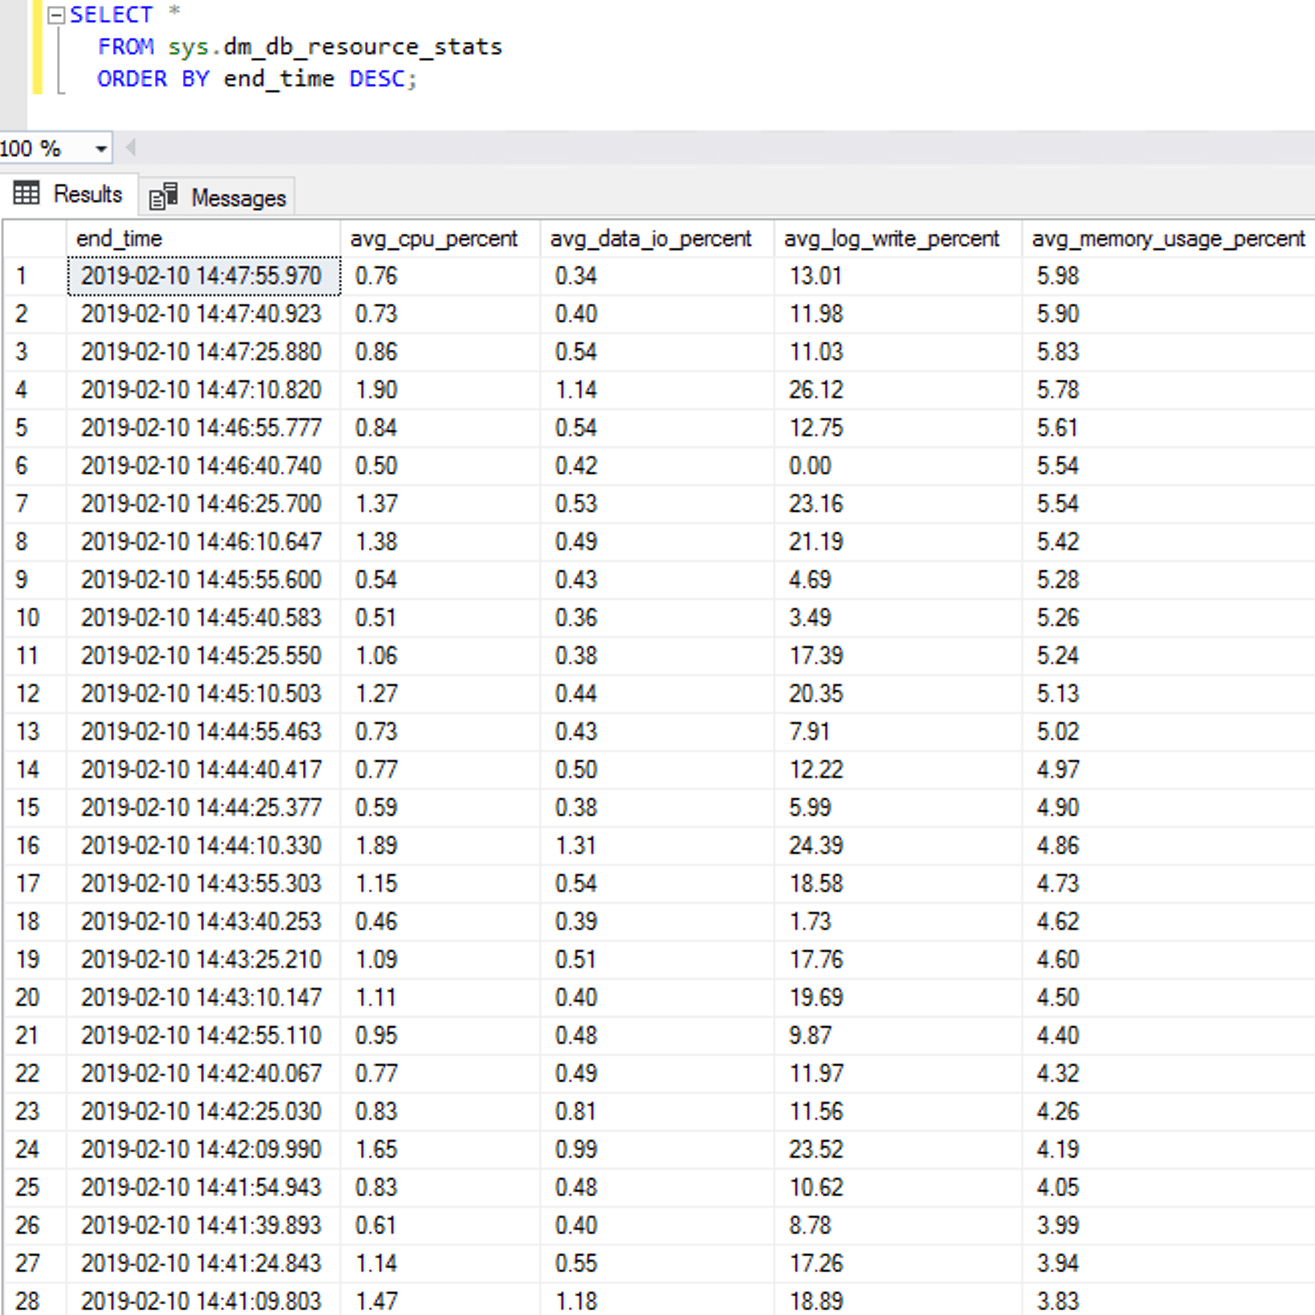
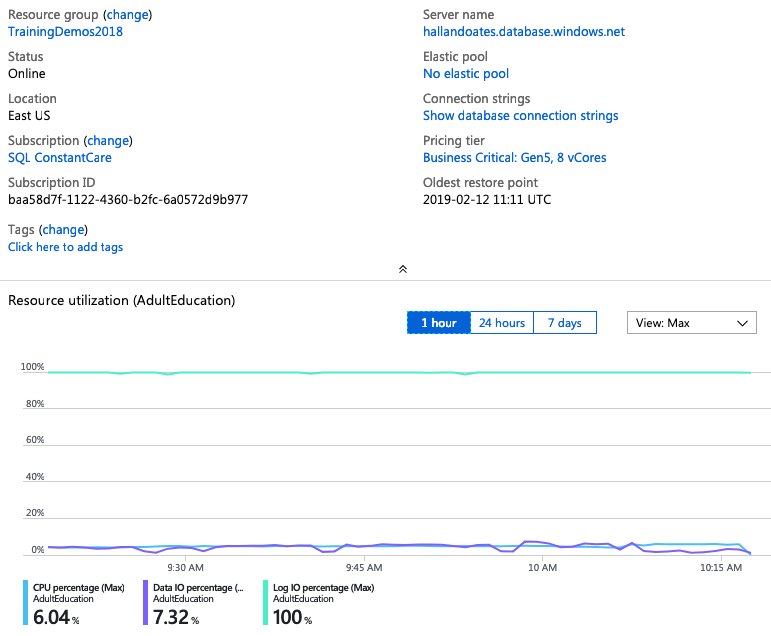
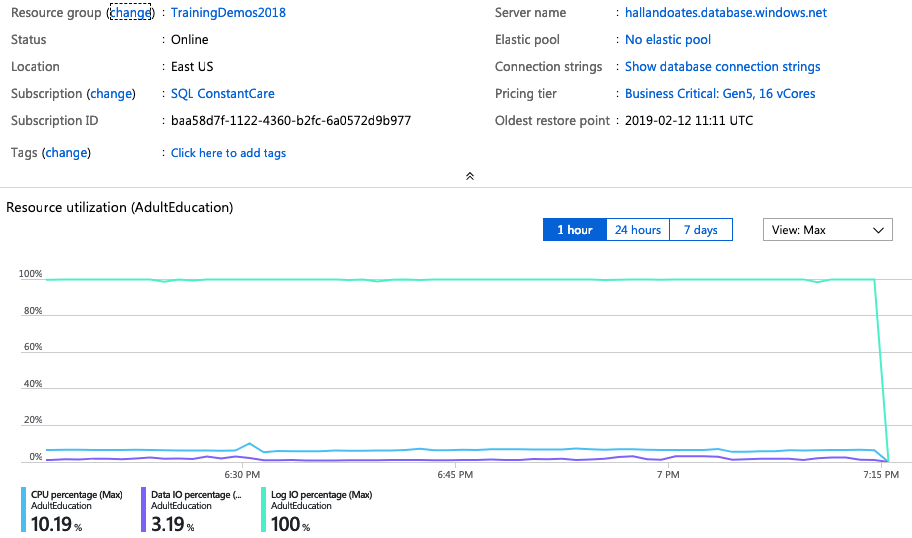
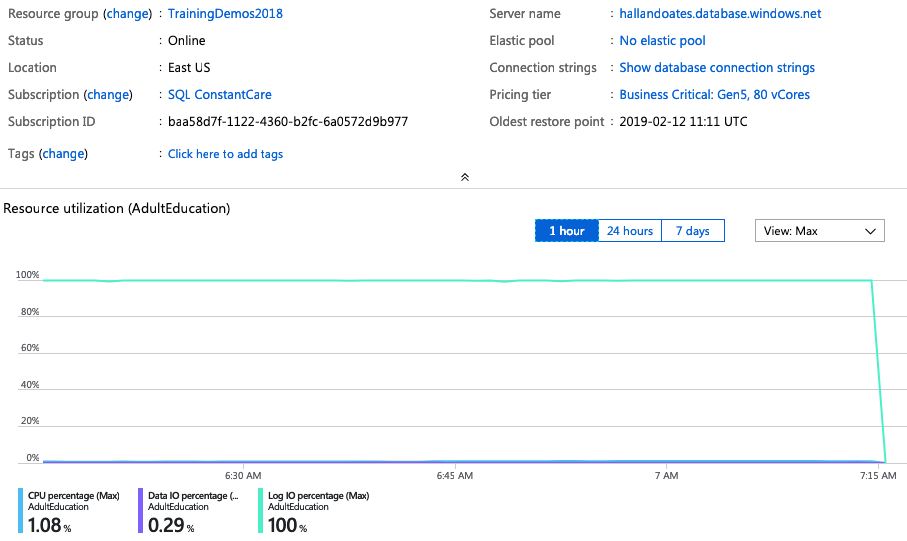
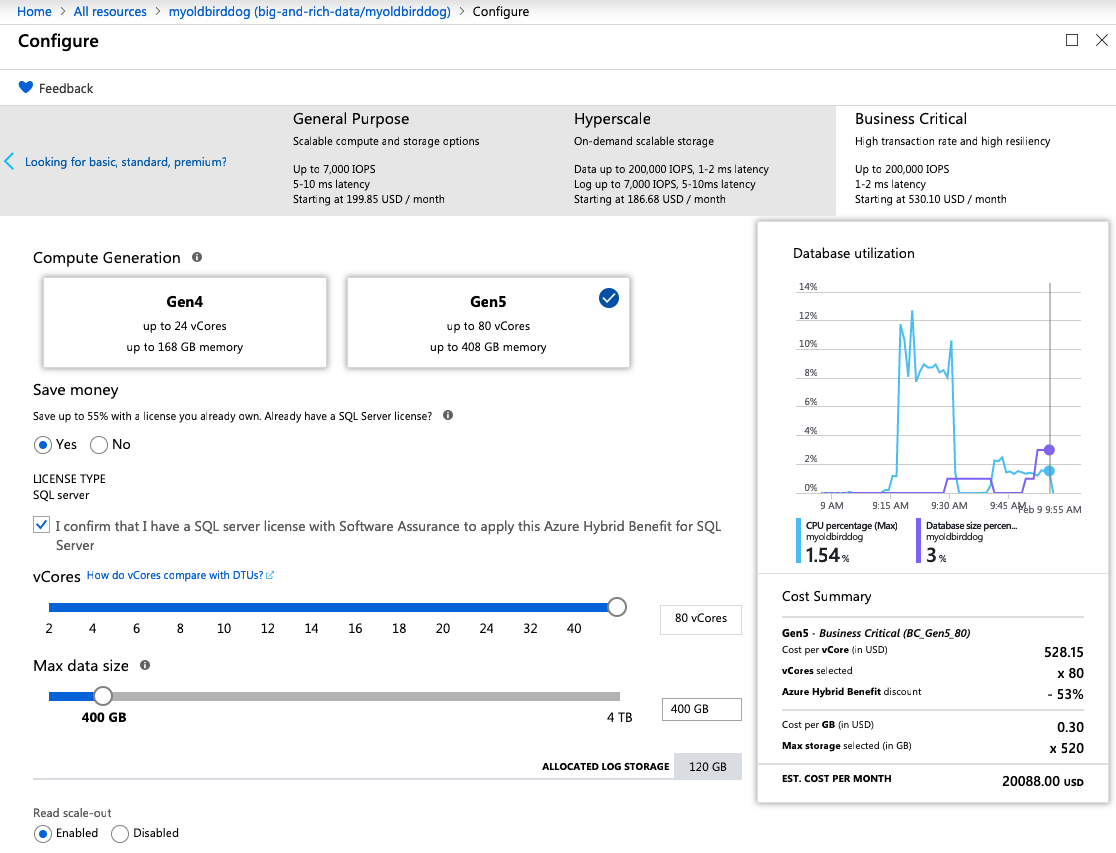
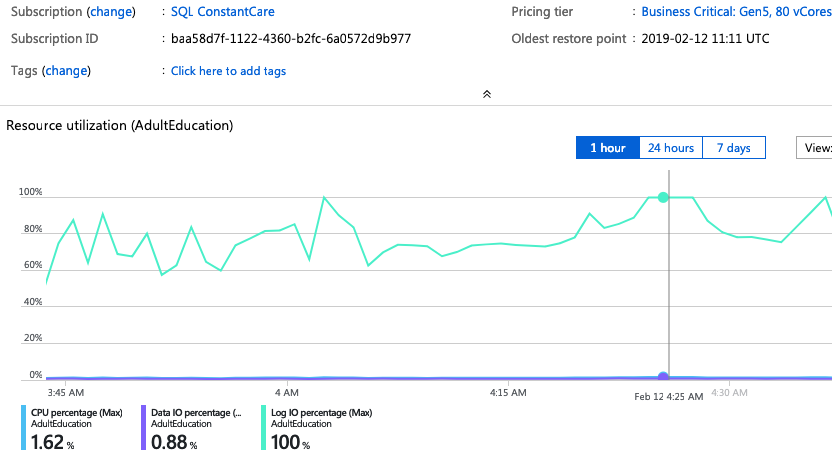
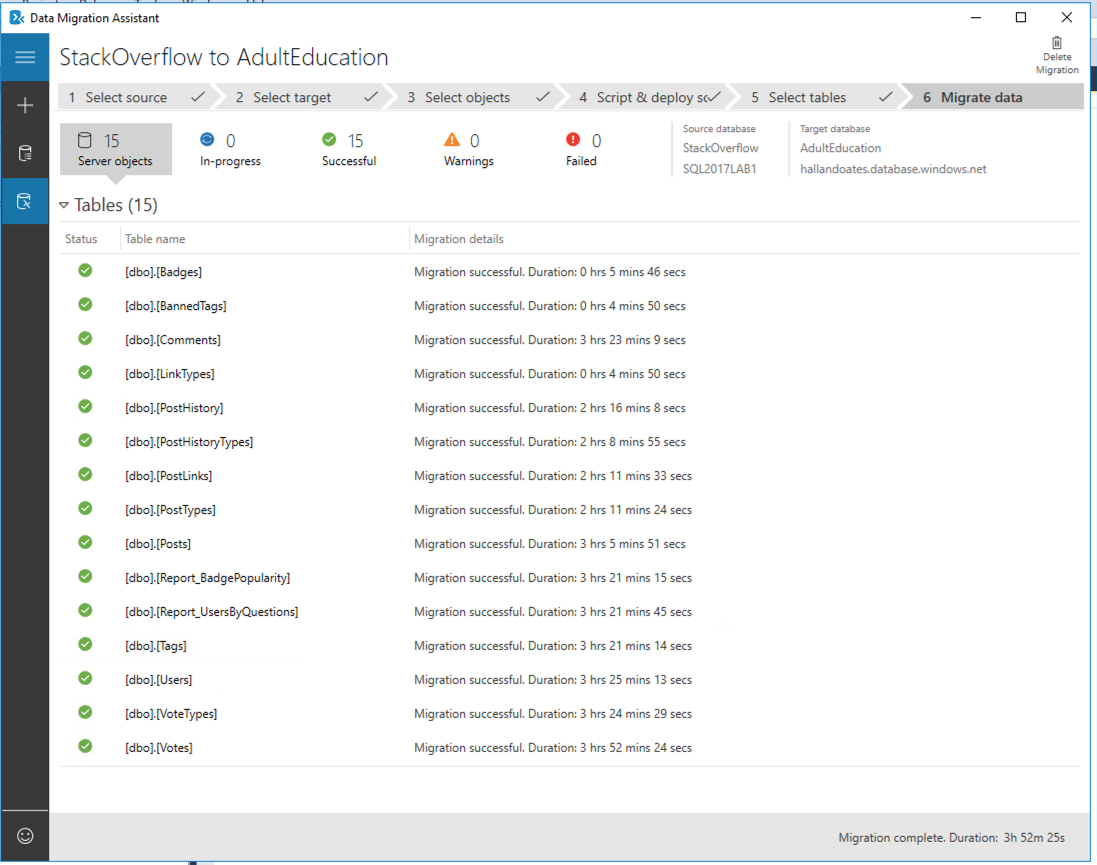
I spun up another 80-core monster – this time in East US – and again, can I just take a second to high-five Microsoft for completing an 80-core Hyperscale deployment in 3 minutes, 19 seconds? This is probably the biggest reason I get excited about the cloud: operational flexibility.

Then, I fired up the Data Migration Assistant and just let it run overnight, rackin’ up charges, moving the ~340GB Stack Overflow database (with no indexes) from an AWS East VM to my Hyperscale database. (Granted – not the best case scenario for Hyperscale – but in reality, most folks are probably looking at moving from on-premises, not Azure to Azure.) The deployment finished after 4 hours and 47 seconds:

Hyperscale import complete: 4 hours, 47 seconds

~340GB in 4 hours is about 85GB per hour, or 1.4GB per minute. After the load finished, the Azure portal showed that my peak log consumption was 39.43% of the limits. Based on that, we can extrapolate that the limits are somewhere around 3-4GB per minute. (Actually achieving those limits is another matter, though, as I noted during the synthetic testing.)

Summary: not bad for this test scenario.

Hyperscale is a brand new product, and I wasn’t exactly giving it the best case scenario for ingesting data:

  • I was importing across clouds
  • I was using a non-performance-tuned app (Data Migration Assistant is easy, but it’s no SSIS)

But I think this represents a pretty good sampling of what customers are likely to try as they dip their toes into Hyperscale. In my next post, I’ll look at how an $21,468/mo Azure SQL DB fares under this same test.


[Video] An Introduction to GitHub for DBAs

Development, Videos
10 Comments

Distributed source control is really intimidating: branches, pull requests, merges – will somebody just take my code, for crying out loud? Why does it have to be so complicated and involved?

I’m with you: I hated GitHub. For years, I struggled with it, but I’ve come to a gradual truce. I’m not a GitHub pro by any means, but in about an hour, I can explain the most important terms to you in a way that’ll make sense for non-developers. I’ll show you how to contribute to someone else’s open source project, and how to get started putting your own scripts under source control.

The resource links:


What Queries Does Microsoft’s CEIP Service Run On Your SQL Server?

Monitoring
88 Comments

You’ve seen the CEIP Service on your SQL Server, and you’re wondering what queries it runs and how it sends that information back to Microsoft. I was wondering too, because I started seeing queries running that I didn’t expect:

sp_WhoIsActivelyRunningTelemetryQueries (click to see full size)

Ah-ha, the telemetry service, also known as SQLCEIP! Starting with SQL Server 2016, your database server phones home to Microsoft by default. I clicked on the sql_text to see what query was running:

Brent Ozar in a tin foil hat
The trick is blocking the mind control waves while still letting the headphones get a signal

Well, whaddya know: that’s where my lock wait times were coming from. The SQL Server telemetry service was trying to query system objects using the default isolation level, which means they would get blocked. (We avoid that problem in sp_BlitzIndex with SET TRANSACTION ISOLATION LEVEL READ UNCOMMITTED.)

That got me to thinking – why not run a trace on SQLCEIP?

I captured a trace for a few hours after SQL Server started up. Here’s the 1MB trace file (trc) output readable with Profiler, and here’s a 1MB SQL Server 2017 database backup with the trace output stored in table. If you use the table version, this will help you analyze the queries involved:

Some of the interesting queries include…

The CEIP Service gets your top 30 user database names.

They don’t return the size, but they do pull the database names with this query:

That query really surprised me because I hadn’t expected Microsoft to bring back database names – the rest of the queries seemed to take extra steps to only get database IDs or group data together by databases, but not this one:

Databases by size

Huh. I gotta think that’s an oversight. I have clients who consider database names to be confidential data since they have their client names or legal matters as part of the database name. (Not that that was a great design, but that ship has sailed.)

Few – but very few – of the other queries also return database names, like this one:

Most of them work more like this, just returning database ids:

I wouldn’t be surprised if, after this gets published, somebody goes through the telemetry queries looking for database names, and changes those queries to use something like the database-class approach used in other queries below. (Not to mention fixing the default read-committed isolation level bug that started me on this whole hunt – some of the telemetry queries use read uncommitted, and some don’t.)

CEIP searches for SharePoint, Dynamics, and…AdventureWorks?

They’re categorizing databases by name:

The output looks like this:

I was kinda hoping AdventureWorks would be shown as “economy class”

I love this – if you’re going to analyze which customers are using SQL Server features, you want to avoid false positives. The sample databases like AdventureWorks use all kinds of features, so you wouldn’t want to count those as customers actually leveraging, say, spatial data. These database names are also specific enough that they’re going to avoid most false positives.

Most of the CEIP Service’s queries are uncommented,
but the security ones seem to have comments.

The queries that return data about encryption, certificates, and the like usually seem to have comments. I’m guessing that was done on purpose, trying to assuage folks’ fears. If I told a manager, “Microsoft’s telemetry is sending back what kind of encryption you’re using, how many columns are encrypted, whether your backup is encrypted, etc.,” they would probably sit up a little straighter in their chairs. I’m guessing the comments were left in to make people feel a little better about what encryption config data is leaving the building.

The CEIP Service checks your storage speed.

Storage speed is one of the classic database admin complaints, especially around 15-second IO warnings. They’re aggregating it by TempDB (interesting that they used spaces and called it “Temp DB”), user databases, and system databases.

SQLCEIP checks to see if your databases are encrypted.

In each database, they’re checking for encrypted columns:

And if you’re using SSMS’s Data Classification feature to classify data as personally identifiable, they’re inventorying that:

They’re also analyzing the backups you took in the last 24 hours, how long they’re taking, how big they are, and what kind of encryption type you’re using:

Can You Disable the CEIP Service?

I was disappointed when Microsoft first announced that you can’t turn off telemetry in Developer and Express Editions. I understood the value of having telemetry is on by default, but not allowing developers to turn it off struck me as ridiculous because that’s probably the least valuable telemetry you could gather.

Stopped the CEIP trace, back to rocking out

Now that I see these queries, I wonder even more.

Is Microsoft really making decisions based on how fast a developer’s laptop performs with encrypted backups, or how columnstore deltas are keeping up on her laptop? Or do they segment out the Developer Edition data?

And if they segment it out, why not let people turn off telemetry? Why gather so much ill will from SQL Server’s mandatory phoning-home of that near-useless data?

Normally I’d end this post with a link to the feedback item requesting it, but Microsoft has closed it and erased all votes on it, saying:

Microsoft has no current plans to change the model for how usage data is emitted.

Update 2019/02/08 from Conor Cunningham

Microsoft’s Conor Cunningham pointed out a few things in the comments:

  • These are indeed queries that SQLCEIP is running
  • However, that data may not actually be going back to Microsoft
  • In order to figure out if it’s going back to Microsoft, customers are expected to follow these steps
  • Even when customers do follow those steps, you have to repeat that process continuously because “Microsoft can and does adjust the queries we evaluate over time” – meaning, you might think they’re not gathering database names today, and they can turn right around and gather them in the next Cumulative Update.

I’m stunned that Microsoft still won’t just publish a list of data that they’re gathering from customers’ SQL Servers. What are they so afraid of? Surely they’ve got a written list of data they’re gathering, right?


The Next Mastering Series is About to Start. Wanna Save $2,000?

Company News, Conferences and Classes
0

Ever wanted to take my Mastering series of classes? I recommend that you take ’em in a specific order because each class builds on the next. If you try to parachute in out of order, you’re gonna have a bad time.

The next rotation is about to start:

  1. Fundamentals of Index Tuning – Feb 13
  2. Mastering Index Tuning – March 4-6
  3. Mastering Query Tuning – April 1-3
  4. Mastering Server Tuning – May 1-3

It’s not a cheap investment, I know: the Mastering classes are $2,995 each. That’s why a lot of folks choose the Live Class Season Pass which lets you attend all of ’em for a year straight – so you can re-take classes when work gets in the way, or when you wanna take your game up a notch.

There’s a new less expensive option:
save $2,000 by skipping the lab VMs.

During the Mastering classes, you get your own private lab VM in the cloud to follow along during the labs. You’re tasked with a series of tough assignments, and they help you reinforce the concepts that you’ve been seeing during the lectures. You get a lunchtime lab, and an afternoon/overnight lab as homework.

However, some students don’t use their lab VMs – they have a pesky day job that interferes. During the lunch & afternoon breaks, they work on their day job stuff instead, answering emails and doing help desk tickets.

Since the lab VMs are pretty expensive, I’d rather pass the savings on to you. So starting today, you can pick up a Live Class Season Pass for just $3,995. Enjoy, and see you in class!