Blog

Parameter Sniffing in SQL Server 2019: Adaptive Joins

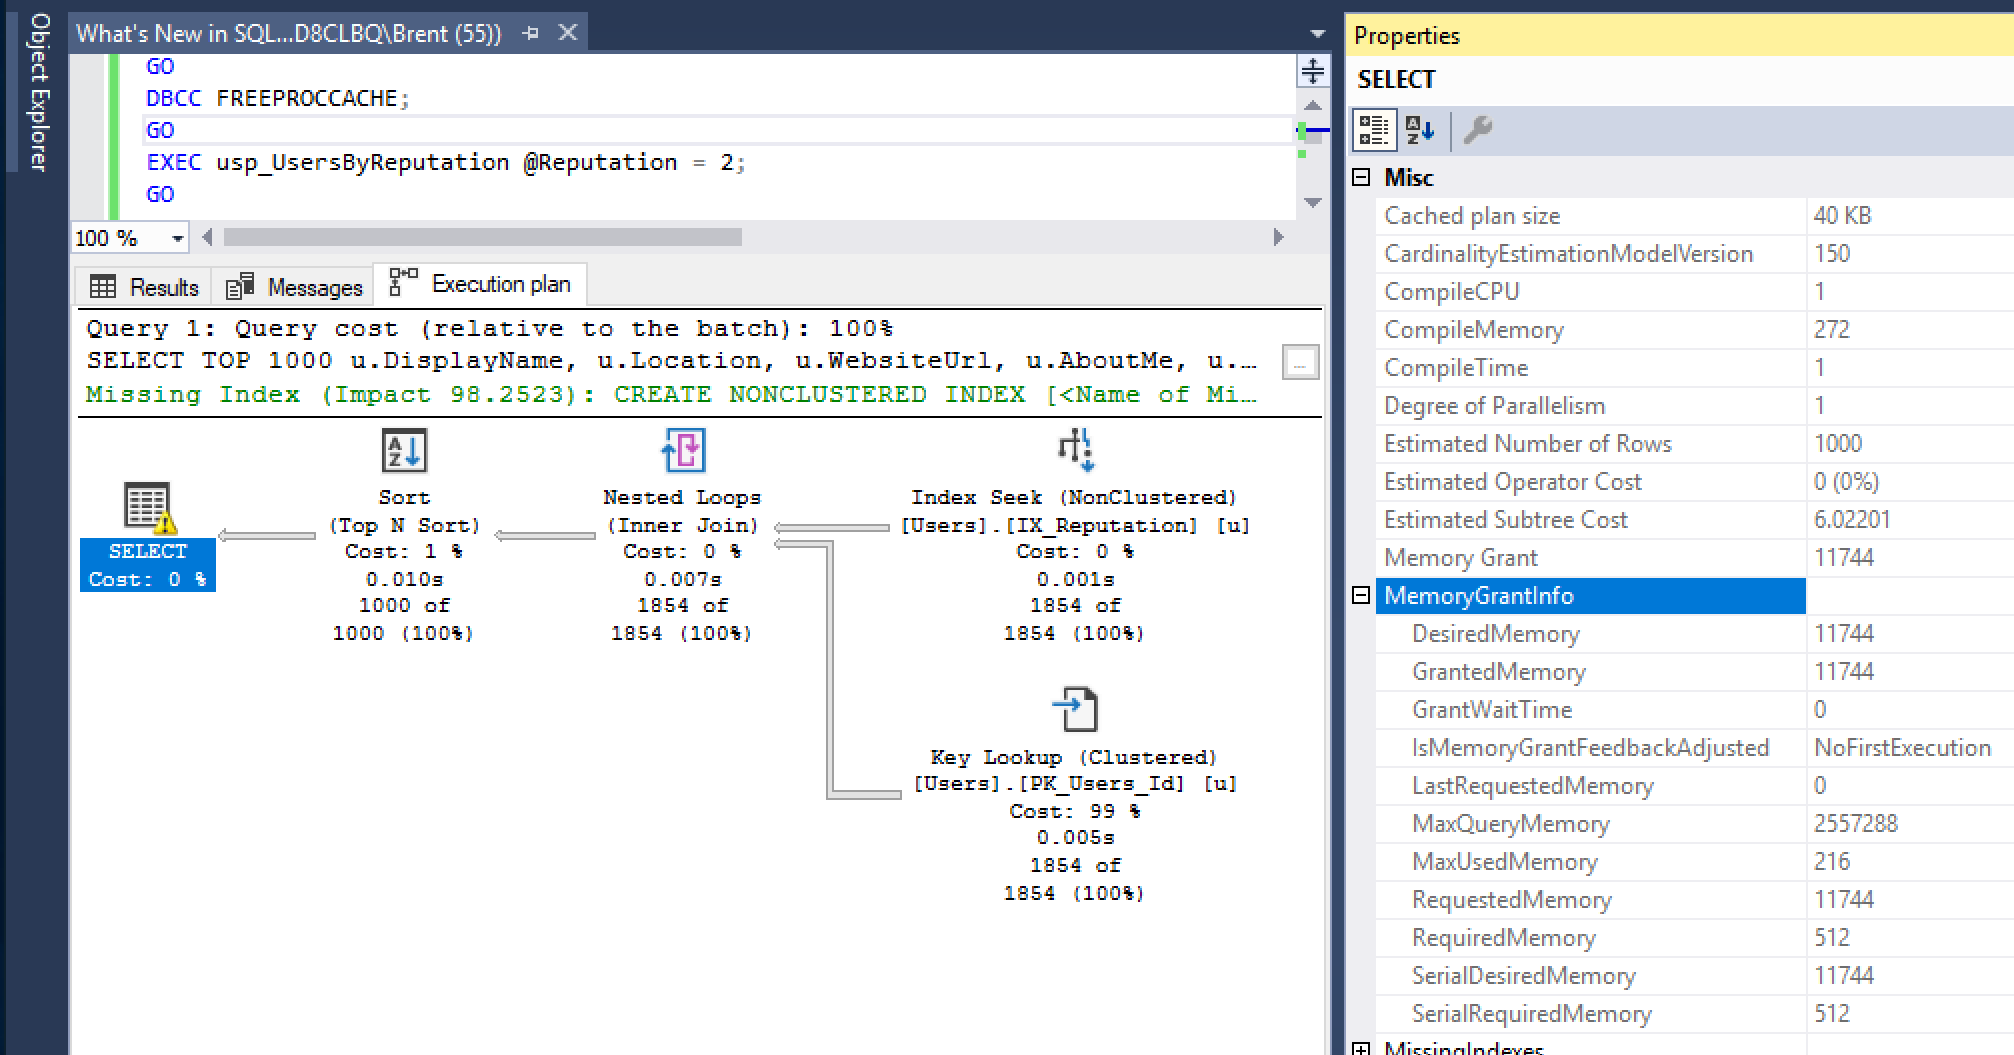
So far, I’ve talked about how adaptive memory grants both help and worsen parameter sniffing, and how the new air_quote_actual plans don’t accurately show what happened. But so far, I’ve been using a simple one-table query – let’s see what happens when I add a join and a supporting index:

(Careful readers will note that I’m using a different reputation value than I used in the last posts – hold that thought. We’ll come back to that.)

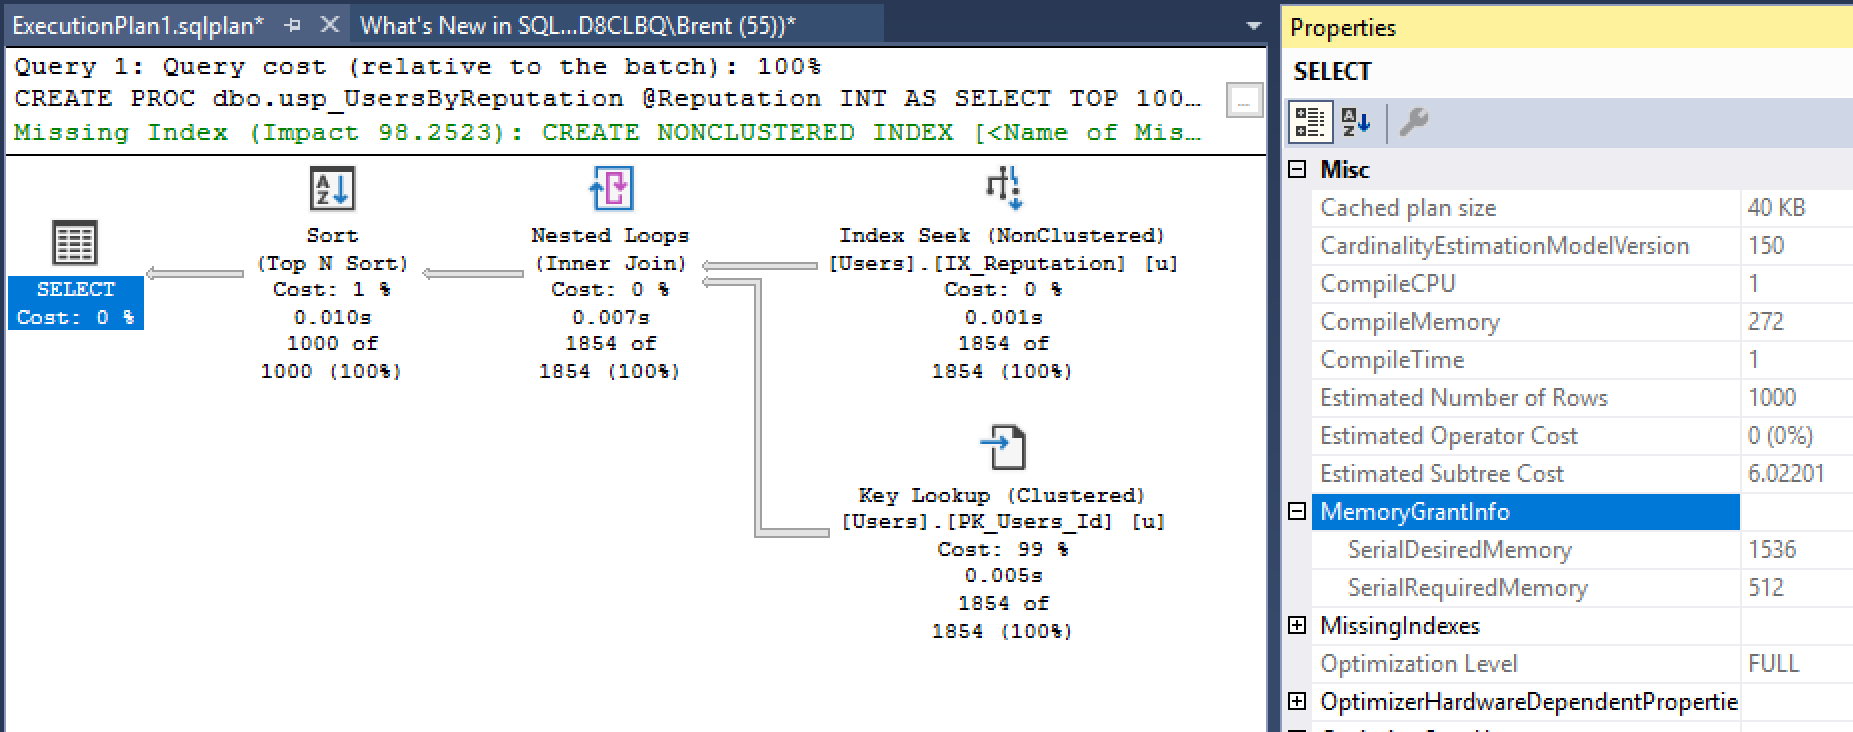
The execution plan leverages a new 2019 feature, adaptive joins for rowstore tables. They were available to queries with a columnstore index in 2017, but this is a new icon to see in a rowstore-only plan:

In this query plan:

  1. SQL Server started with a clustered index scan on Users, and produced 50k matching rows.
  2. It then had to decide how to use the index on Posts.OwnerUserId. For low numbers of rows (in this case, 36,700 or less, a threshold visible in the plan’s tooltips), it would have preferred an index seek for each matching row. For higher numbers, it would prefer to scan that index.
  3. Because our number of rows exceeded the adaptive threshold, it went with a scan.

I can hear you cheering because this is awesome. It means your plans are less susceptible to parameter sniffing problems because now SQL Server can cache one plan that adapts to more input parameters.

Narrator: “Sadly, the reader was incorrect.”

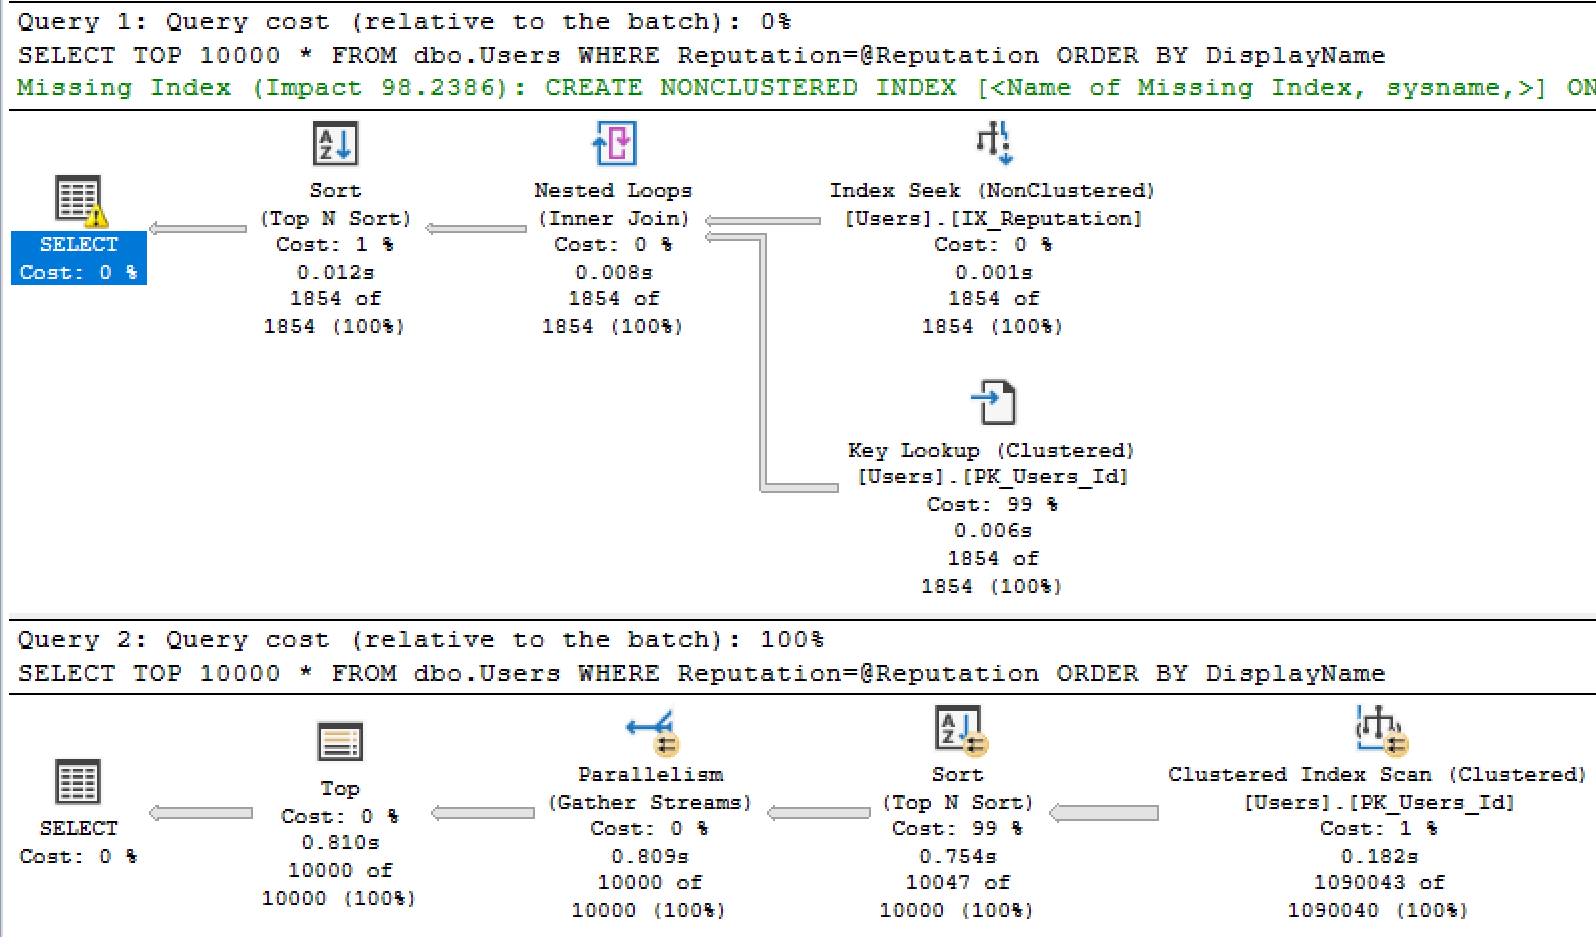
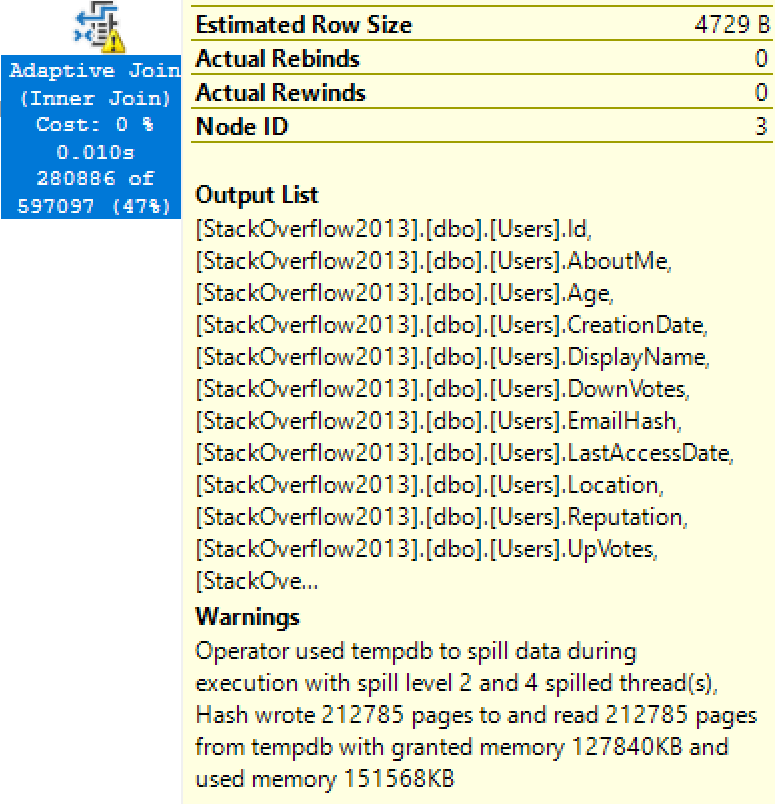
Now run it for @Reputation = 1. As we saw in earlier posts, @Reputation = 1 produces a lot more data – about 1M rows in this case – so it’s not surprising that something goes wrong. In this case, the adaptive join didn’t grant enough memory, so it spills 12,880 pages to disk:

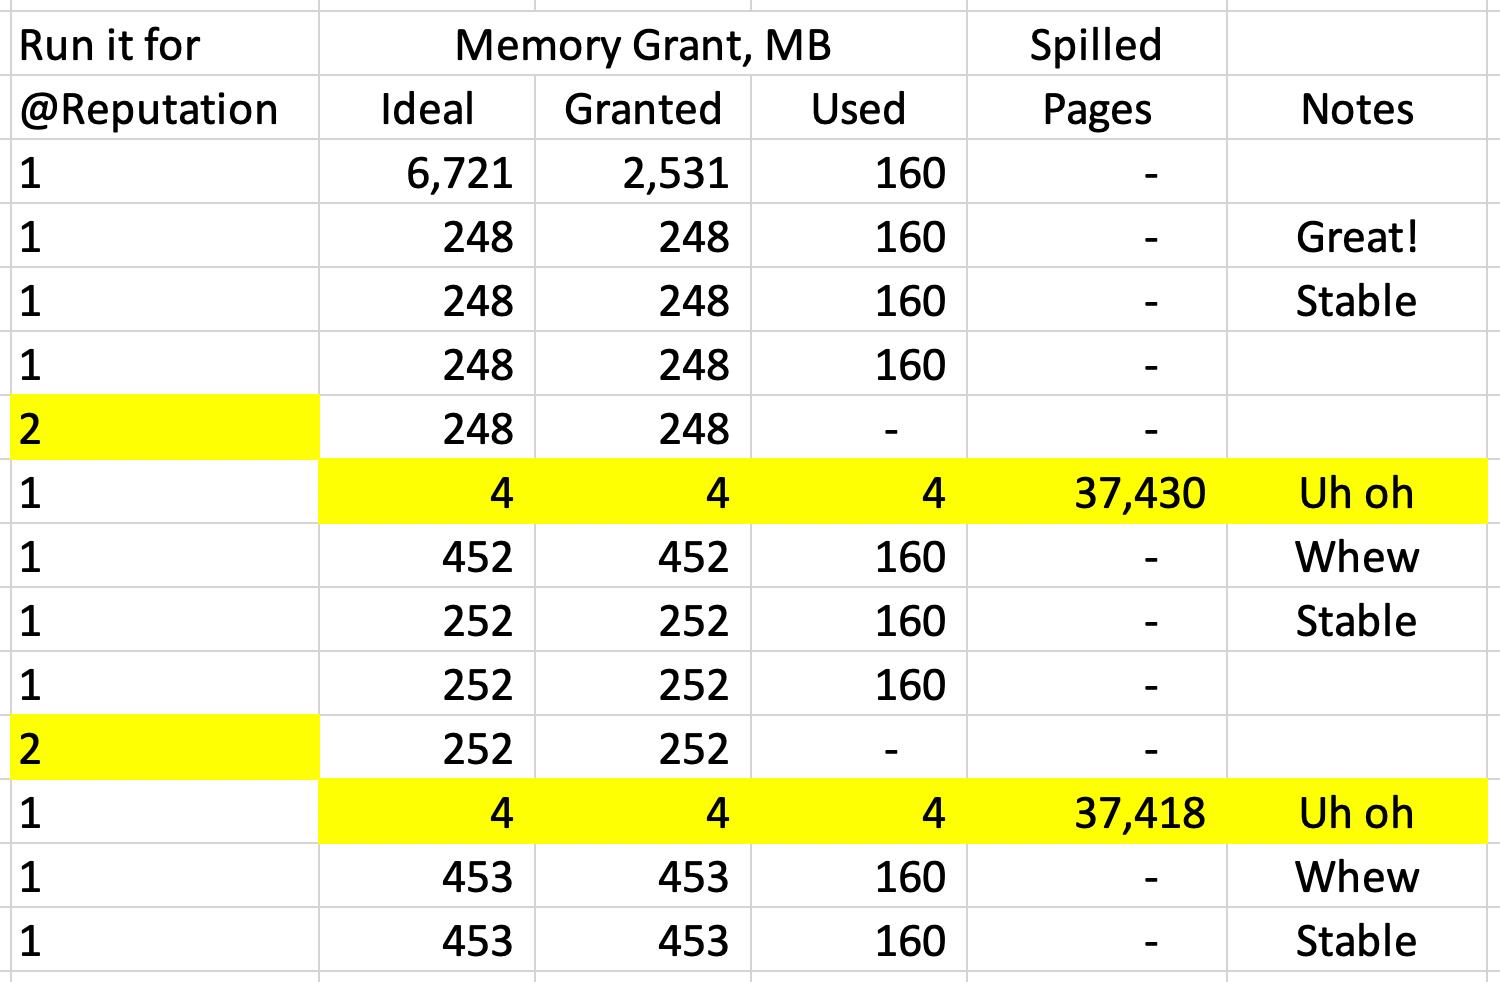
That in and of itself isn’t really all that bad, though – and if I continue executing @Reputation = 1 several times in a row, adaptive memory grants kick in and stabilize memory at 288MB. The query stops spilling to disk, and it goes faster.

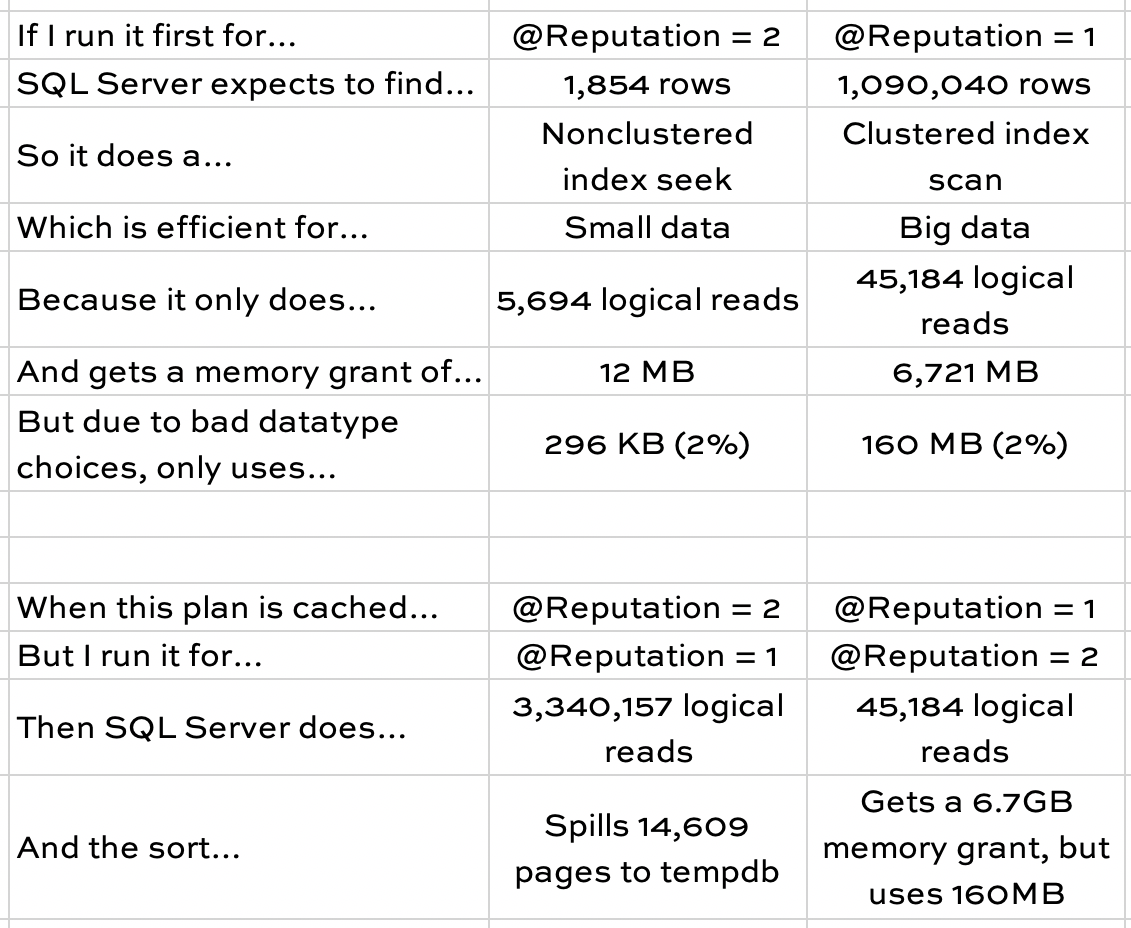
Until I run it just once for @Reputation = 2, at which point the memory grant starts dropping – and it can drop down to just 7MB. You saw in the first post how that story ends: the memory grants swing back and forth, constantly basing a query’s memory grant on the parameters used the last time the query ran, not the current parameters.

Heaven forbid I run it for @Reputation = 1 right after I run it for @Reputation = 2:

Spill City
Welcome to Spill City, population 212,785

And remember: if you try to diagnose why this query took >10 seconds, you can’t see spills in the new air_quote_actual plans in 2019 yet – but they’re hopefully coming for RTM.

So what’s a good plan for @Reputation = 1, then?

Oh, dear reader. Oh, sweet friend. Let’s run it for @Reputation 1, 2, and 3, all with recompile on so we can see what plan will get put into cache when each variation happens to run first:

1 query, 3 parameters, 3 different plans

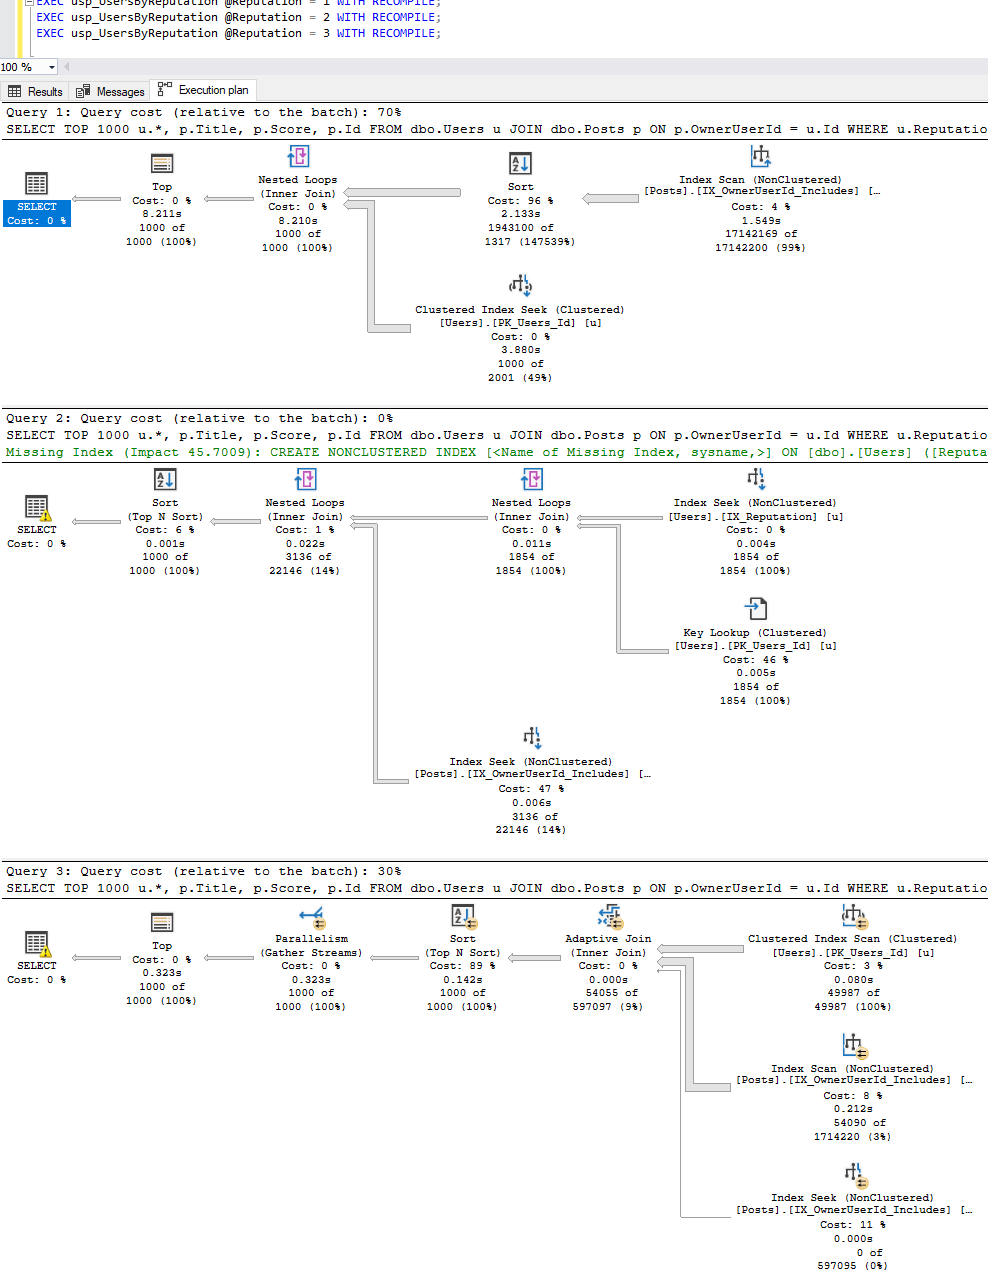
For a simple one-join query with only one parameter, three different-shaped plans are cached for three different input values, and they effectively produce 4 different plans since one of those is an adaptive join.

  • @Reputation = 1 caches a plan that starts with a Posts index scan in batch mode
  • @Reputation = 2 caches a plan that starts with a Users index seek, and does everything but the sort in rowstore mode
  • @Reputation = 3 caches an adaptive join plan that either scans a Posts index in batch mode, or seeks it in rowstore mode
Deploying the new Charcoal Estimator (CE)

This isn’t a new phenomenon because complex queries can often produce wildly different plans, but SQL Server 2019 just makes it happen more often, with even simpler queries, because now we’ve got the option of adaptive joins and batch mode. SQL Server has exponentially more plans to choose from, and in the early days of 2019, some of these to backfire, hard.

Parameter sniffing isn’t getting easier with 2019.

It’s getting harder.

Much, much harder, to the point where it’s getting to be time for a mind shift amongst query authors. In theory, we have to stop asking, “Why was this query slow the last time I ran it?” and start asking, “How can I change this query to be more predictably fast?” I just don’t see that mind shift happening anytime soon, though. That’s not the way humans work. We’re all about shipping a good enough query, quickly. It’s a miracle that our queries even compile, let alone produce accurate results, let alone perform well.

SQL Server tuning work ebbs and flows.

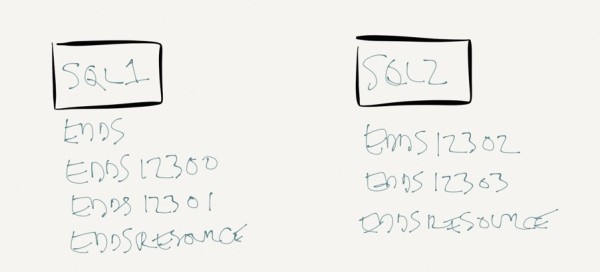
In some SQL Server versions, the job of performance tuning gets easier. SQL Server 2016 comes to mind: for many SPs and CUs, many of which got backported to 2012 and 2014, we were blessed with a continued stream of diagnostic data improvements that made it way simpler to diagnose complex problems like memory grants, spills, and poison waits like RESOURCE_SEMAPHORE and THREADPOOL.

In other versions, SQL Server adds new features faster than the supporting diagnostic infrastructure can keep up. SQL Server 2014’s new Cardinality Estimator, In-Memory OLTP (Hekaton), and updated columnstore indexes were good examples of that: you could use ’em, but boy, they could backfire without warning.

Microsoft’s obviously going to say that SQL Server 2019 is in the make-life-easier category because the robots do more for you. However, the robots have brand new, untested, not-very-well-documented choices that they’ve never had before, and it’s much harder for you to see what they did after the fact.

Based on my time with 2019 so far, I think it’s going to be a lot like 2014. People are going to:

  1. Put 2019 in their testing environment
  2. Test their worst queries under 2019 compatibility level, and be pleasantly surprised
  3. Go live with 2019 (but they won’t enable Query Store because they don’t know why or how, and the defaults don’t make sense)
  4. Have their server catch fire with unexpected query plan regressions
  5. Not have the time to figure out if the problem is adaptive grants, adaptive joins, or batch mode (and especially not have the time to understand that any of those could cause problems with any query)
  6. Switch their databases back to 2017 compatibility level (which is thankfully easy)

But instead, I really wish they would:

  1. Enable Query Store today, and start building up a history of good query plans that you can use to fix regressions
  2. Go live with 2019, but stay in 2017 compatibility level, again, building up a good history
  3. After a couple/few weeks, try 2019 compatibility level – but don’t be afraid to switch back if the work is overwhelming
  4. If the work isn’t overwhelming, use Query Store to regress specific plans, but inventory them
  5. For each regressed plan, start working with your developers to identify what behavior is causing a problem, and modify those queries or their supporting indexes to remove the requirement for the plan guide

That last step is so important because sooner or later, your developers are going to ship a new version of that query. They’re going to add a comment, tweak the query, or add a join, and as soon as they do, the plan guides will no longer be relevant. Remember, Query Store’s plan guides only work for exactly similar prior queries. SQL Server can’t automatically regress a query to a prior plan if you’ve never had a good plan for that exact query.

And oh, are your plans about to change, bucko. Tomorrow, we’ll discuss the biggest change of them all: automatic inlining of user-defined functions.

Hey, while you’re here – I built a whole series of classes around parameter sniffing. It looks so easy, but it gets so hard – and backfires so hard. The first class: Fundamentals of Parameter Sniffing. Conquer that, and you can move on to Mastering Parameter Sniffing.


Parameter Sniffing in SQL Server 2019: Air_Quote_Actual Plans

My last post talked about how parameter sniffing caused 3 problems for a query, and how SQL Server 2019 fixes one of them – kinda – with adaptive memory grants.

However, the post finished up by talking about how much harder performance troubleshooting will be on 2019 because your query’s memory grant is based on the last set of parameters used, not the current set.

So let’s imagine that you just got an emergency phone call: the boss says their query was slow just now, and they wanna know why.

In theory, you’ll use the new sys.dm_exec_query_plan_stats.

Microsoft’s Pedro Lopes unveiled this feature last week, and in theory, it sounds pretty easy:

  1. Enable trace flag 2451
  2. Get the query’s plan handle
  3. Get the “actual” plan by running SELECT query_plan FROM sys.dm_exec_query_plan_stats (your_plan_handle)

Let’s start our adventure by running usp_UsersByReputation for @Reputation = 2, which gets the tiny memory grant. Here’s the real actual plan from running the query:

Real actual plan for @Reputation = 1

The real actual plan is full of rich details: the degree of parallelism, how long the plan compilation took, and something very important for this particular issue, the amount of memory grants. In this case, the query desires 11.7MB.

Normally, all those details will be lost in time, like tears in rain. Enter sys.dm_exec_query_plan_stats – we’ll use sp_BlitzCache to show the plan handle, and then pass that to the new DMF to get the most recent “actual” plan:

And at first, things look promising – click on the query_plan, and you get:

“Actual” plan from sys.dm_exec_query_plan_stats for @Reputation = 2

IT’S AN ACTUAL PLAN! FOR A QUERY THAT RAN IN THE PAST! You can tell it’s an actual plan because the numbers below each operator are the actual numbers of rows that returned from each operator. This is a huge step forward because it enables you to see where the query plan’s estimates went wrong: where it thought that only a few rows would come back, but in reality, way more did. But before you pour the champagne, dig a little bit deeper.

But…there’s a whole lot missing from the details.

And one of the most important things there, desired memory, is completely wrong.

The memory grant numbers don’t show what the query executed with – they show the desired memory grant for the query’s next execution! To see it in a painful way, run it again, this time for @Reputation = 1, and here’s the real actual plan:

Real actual plan for @Reputation = 1

Again – rich details, especially for the sort. That yellow bang warning on the sort is absolutely priceless, and when you hover your mouse over it, you get a tooltip showing how many pages spilled to disk.

And a whole lot of them did – because the desired memory for this query is just 1.5 MB! Ring a bell? That’s the desired memory from the supposed last “actual” plan, which wasn’t actual at all. So let’s go query sys.dm_exec_query_plan_stats and see what this query supposedly had for an “actual” plan:

“Actual” plan from sys.dm_exec_query_plan_stats for @Reputation = 1

“It desired 209MB.” THE HELL IT DID. That’s the grant for the next time this query runs!

Henceforth, I shall refer to these plans as air_quote_actual plans.

In practice…well, it’s only CTP 2.4, but…

To recap what I’ve shown so far this week:

  • Adaptive memory grants mean your query’s memory is based on the prior execution’s parameters
  • The air_quote_actual grants in sys.dm_exec_query_plan_stats are based on the query’s next execution

I can see why this is hidden behind a trace flag, and isn’t practical for mainstream distribution. If this shipped to the public as actual plans (no airquotes), it would hurt more than it would help. They don’t include:

  • A lot of details about memory grants (granted, wait time, used, etc) – and what it does show is wrong
  • Degree of parallelism
  • IO statistics (reads)
  • Wait stats
  • TempDB spills – although Pedro reports those are coming soon:

That means the air_quote_actual plans really just serve as clues that will require a trained performance tuner detective to solve. Just like you’ve seen for years in Watch Brent Tune Queries, your mission is to start at the top right of the query plan, review the estimated versus actual numbers to see where they went awry, and then change the query or the supporting indexes to guide the optimizer down a better path. Air_quote_actual plans serve as a tool in that investigation, but you have to know which parts are true – and which parts are lies.

<sigh>

I do like it – just like I like adaptive memory grants – but it’s another sign that this is going to be a 2014-style release. More on that in the next post when we explore another new SQL Server 2019 feature to mitigate the perils of parameter sniffing: adaptive joins. This one really does work as designed, eliminating parameter sniffing issues while building a resilient plan that works for all kinds of parameters.

(What? That was too obvious? You really are sharp. You’ve always been my favorite reader, you. We really get each other.)

Hey, while you’re here – I built a whole series of classes around parameter sniffing. It looks so easy, but it gets so hard – and backfires so hard. The first class: Fundamentals of Parameter Sniffing. Conquer that, and you can move on to Mastering Parameter Sniffing.


Parameter Sniffing in SQL Server 2019: Adaptive Memory Grants

This week, I’m demoing SQL Server 2019 features that I’m really excited about, and they all center around a theme we all know and love: parameter sniffing.

If you haven’t seen me talk about parameter sniffing before, you’ll probably wanna start with this session from SQLDay in Poland. This week, I’m going to be using the queries & discussion from that session as a starting point.

In this week’s posts, I’m using the 50GB StackOverflow2013 database (any size will produce the same behaviors, just different metrics.) I’ve got an index on Reputation, and I’m using this stored procedure:

Setting the stage: how SQL Server works today

When you call it for @Reputation = 2, you get an index seek + key lookup plan optimized for tiny amounts of data.

When you call it for @Reputation = 1, you get a clustered index scan plan optimized for large amounts of data.

Plans optimized for different reputations

The easiest way to tell the sad story of plan reuse is with a table:

Parameter sniffing metrics

Neither the @Reputation = 1 or @Reputation = 2 plans are good for the other value. When SQL Server caches the scan plan, it runs into RESOURCE_SEMAPHORE issues due to unused large memory grants when other parameters run. When it caches the seek + key lookup, @Reputation = 1 performs poorly.

Note that this works the same way in SQL Server 2019, too, as long as your database is in 2017 compatibility level. (All of these screenshots & data were done on SQL Server 2019.)

This query presents three problems.

There’s no one right way to read the data. A nonclustered index seek + key lookup is fastest for small numbers of rows, but there’s a tipping point where a clustered index scan is more appropriate.

There’s no one right memory grant. The query uses between 296KB and and 160MB, a huge range. Even worse, because the data types are much larger than the average population actually uses – and because SQL Server doesn’t know that until runtime – the grant varies between 12MB and 6.7GB.

The index recommendation is flat out wrong. Clippy suggests that the user create an index on DisplayName, and then just include all of the columns on the table. If that’s created, it does solve the read problem, but we just doubled the size of our table, and it doesn’t fix the memory grant problem because we still have to sort 1,090,040 rows by DisplayName every time the query runs.

Until SQL Server 2019, the typical solution was to create an index on Reputation, DisplayName, and then living with the 10,000 key lookups (which really isn’t a big deal.) However, most people just can’t figure that solution out because Clippy’s missing index recommendation is on Reputation, and then just includes all the fields.

SQL Server 2019’s adaptive memory grants aim to solve one of them.

I wrote about adaptive memory grants a few months ago when the announcement first dropped, and the short story back then was that I liked it. In SQL Server 2019, when databases are in the 2019 compatibility level, the memory grant changes over time as the query runs.

I love this feature so much because it’s the kind of thing end users kind of expect that the database is doing already. When I demonstrate parameter sniffing to them, their usual response is, “Wait, what the hell do you mean that the database server doesn’t allocate different amounts of power to work with different parameters?” That’s an awkward moment. Adaptive memory grants help SQL Server catch up to user expectations.

In my work since then, I’ve gotten a little more nervous. I still like it, but…I’m getting nervous for the end user questions that are going to start coming in.

Your query’s memory grant is based on the LAST PERSON’S PARAMETERS, not yours.

I’ll demonstrate by running the proc a few times in a row, documenting its memory usage each time, showing how it adapts:

Changing memory grants

I’ll translate this into a support call:

  • User: “Hi, I just ran the sales report and it was really slow.”
  • Junior Admin: “What parameters did you use?”
  • User: “I ran the national report for the last 3 years.”
  • Junior Admin: “Oh yeah, you’re working with large time spans, it’s slow the first time you run it, but it’s really fast after that.”
  • User: “What?”
  • Junior Admin: “Yeah. I’m not sure why it seems to really pick up speed after the first time. But if you wait a while, it slows back down again. Maybe it has something to do with caching.”

Or maybe a more senior admin handles the call:

  • User: “Hi, I just ran the sales report and it was really slow.”
  • Senior Admin: “What parameters did the person before you use?”
  • User: “What?”
  • Senior Admin: “Yeah, see, your report speed is based on the parameters the last person used. SQL Server gives you the right amount of memory for their parameters.”
  • User: “What?”
  • Senior Admin: “If you want it to go fast, you have to run it a second time. The second time you run it, it’ll have the right amount of memory for what you asked for last time.”
  • User: “What?”
  • Senior Admin: “Unless someone else sneaks in and runs it at the same time. So yeah, your best performance will be if you run it twice when no one else is around.”
  • User: “Okay.”

Or maybe it gets escalated all the way to our best staffer:

  • User: “The other two admins don’t know why my query is slow. Can you run it and see what’s going on?”
  • Señor Admin: “No.”
  • User: “What?”
  • Señor Admin: “Every time you run a query in SQL Server 2019, it can get a different memory grant based on the prior execution or lack thereof. If I run it for you now, it might be blazing fast, or unfairly slow.”
  • User: “Was SQL Server 2017 like this?”
  • Señor Admin: “Silence. Rather than looking at SQL Server’s behavior, we need to look at your query’s design and the supporting indexes. We need to look at the shape of the plan, understand why it’s getting that shape, and see what we can do to change your query to get a predictably better plan shape.”
  • User: “That sounds like a lot of work. Can’t we just go back to 2017 compatibility mode where the grants were predictable?”
  • Señor Admin: “I liked you a lot better before you went to SQLSaturday.”

Fortunately, Microsoft saw this coming, and adaptive memory grants give up when grants keep swinging around with no sign of relief, settling back on the original grant that they started with for the first compilation. However, the clock resets whenever you rebuild indexes, update statistics, or the plan gets dropped out of cache – which means that support call will get even worse. That poor admin is probably going to be right back to the old recommendation of, “Rebuild the index and then run the query again, and it’ll be super-fast” – all because it’s getting a plan customized for that incoming set of parameters.

<sigh>

Like I said – I love this feature, but I’m getting nervous. I’m going to have to put some serious thought into the First Responder Kit scripts to make this easier to diagnose. In the next post, I’ll cover a new SQL Server feature that’s designed to help.

That’s why I built a whole series of classes around parameter sniffing. It looks so easy, but it gets so hard – and backfires so hard. The first class: Fundamentals of Parameter Sniffing. Conquer that, and you can move on to Mastering Parameter Sniffing.


What You Said You’re Going to Do About SQL Server 2008

Last week, I asked you what you were going to do about SQL Server 2008’s fast-approaching end-of-support date.

Countdown clock at SQLServer2008.com

Here were some of my favorite responses from blog comments and Twitter. Terry’s been doing a good diligent job, but struggling to keep up:

Like Andrew we’ve been working on retiring/migrating off 2008 (to mostly 2014 or 2016) for 1.5 years. We started with 25 instances and are down to 3. They’ll be done by the EOL date. Then a couple year breather before we rinse and repeat with 2012 (EOL 7/12/2022).

Trav wrote:

if you’re my company you ignore the dbas who have been warning about this for 2 years and then get mad when we point out that time is up.

But Pittsburgh DBA responded with something that I heard from a lot of commenters:

Who cares? It works fine, and it’s been working fine for a hell of a long time. This panic attack going on around the country about 2008 is hilarious.

I don’t know that I’d say it works fine because I usually reserve the time fine for things like art and dining. If SQL Server 2008 was a restaurant, it’d be more Mickey D’s and less Top Chef – but I get where he’s coming from.

Similarly, Alen points out:

my old employer still has some 2005 servers. They still work. there is no money to upgrade them. When i worked there i called MS maybe 2-3 times in many years for SQL support.

I’ve heard that remark about support from several clients, too, as in, “We don’t call them for support anyway. That’s why we have you, because we got burned by a few bad support experiences.” I try to gently remind them that I don’t have the capability to write patches for bugs.

Mark Freeman’s servers are on life support:

We have four 2008 R2 instances that I’ve been asking to upgrade for almost 2 years. The answer has always been, and continues to be, that they are supporting a legacy application that we intend to retire Very Soon Now and therefore we don’t want to put any resources into an upgrade project. That legacy application is, in fact, being replaced and the replacement (using Azure SQL Database) is rolling out over the next two years. Meanwhile, the legacy version (not in Azure) is responsible for supporting 80% of revenues. That going out of support doesn’t seem like an optimal situation.

John Cas points out that even Microsoft’s apps have those problems:

Greg Low reminded me of something I’d (happily) forgotten about:

Core based licensing shock was the #1 reason most don’t want to move from 2008 R2.

And on a related note, Jeff G reminds you that the upgrade money might come from the same pocket that pays your salary:

In the industries I have worked in (casino vendor, transportation, construction), the idea of upgrading because Microsoft stopped supporting the software is laughable (as in I was laughed at when it was suggested to upgrade). But on the same token, these guys do not see technology as a revenue generator but more as a revenue black hole. No matter how I explain it, the sticker-shock is too great. Since these were smallish companies, I don’t necessarily blame them. “As vote of hands, who would rather have bonuses this year and who would rather run software that is supported by Microsoft?” Software always loses in that case. Now if I am a 1000+ person company with multiple data centers (and cloud instances) then the sell is far easier (at least it was for me). This was due to rolling it into the master licensing agreement (you know for all the Windows licenses, Office 365 licenses, and server licenses) which was a yearly expense that was already budgeted for. To give you my opinion, if the support of 2008/2008 R2 doesn’t cost too much, then I would leave it in.

Tony’s company is thinking big because they’re tired of this hamster wheel:

Expired versions of ERP & integrated engineering systems (running on 2008R2) have to be dealt with first before turning off old OS & SQL is possible. Work is *finally* underway (6 years ago I came to this job to do this), but these systems will probably hang on for another 2 years. And maybe longer, if it’s decided to keep them running as reference. Infrastructure team wants to airlift the data center into cloud, which at least takes hardware failure off the risk list (7 years old and counting).

John C wrote:

we plan to make the leap to 2019 by end of Q3… but considering 2017 in case the RTM launch of 2019 delays to end of Q2.

It’s easy for me to say this from an armchair perspective, but I think Microsoft made a mistake with the 2019 launch timing. They used to make a lot of noise that they were going to ship a new version every year on a “fast train” of releases, but 2019 is taking longer to ship than 2017 did. I know the MS folks will say, “But 2019 has so many big features and we can’t rush it” – that just means someone got the scoping wrong, and should have shipped a smaller incremental set of features earlier.

On a related note, Rowdy Vinson tweeted:

https://twitter.com/RowdyVinson/status/1111036254928453633

I had to laugh at that. I love 2017 and I use it every day, but I gotta confess that when I wrote the post Which Version of SQL Server Should You Use, the 2017 advantages weren’t quite as awesome as I’d have hoped. But wasn’t I just saying MS should ship a smaller set of improvements, more often? 2017 is what that would look like, and it’s fine. No, not fine as in…<sigh> Moving on.

Shaun Austin wrote:

I think the apathy from some organisations comes from not really understand what a lack of support means. I work for an ISV and our software runs on SQL Server 2008 or later. I’ve been encouraging our customers to upgrade SQL Server for the last 12 months or so. The typical conversation goes like this:

Customer: “what do you mean when you say our version of SQL Server won’t be supported from July?”

Me: “I mean Microsoft won’t provide critical security updates and bug fixes. Nor will they provide technical support in the event of a serious problem, nor will it be guaranteed to run on later versions of Windows Server.”

Customer: “Huh….but your software will still work…right?”

Me: “Well…as it stands….yes…so long as SQL Server is able to run…our software will continue to work. There are other performance and feature benefits too of course”

Customer: “Hmm…ok…well…I don’t have a problem now, and an upgrade to SQL Server seems really expensive…I’ve also heard about that cloud thingy which is going to save me a chunk of cash and I’m definitely going to look into that…..hmm….I’ll get back to you.”

Or as Dcariboo summed up:

Business dictates to IT what technology we use, hence why we still have an app around that requires sql server 2000. 8\

Andrew Miller summed up the life of an admin:

We’ve been migrating DBs from 2008/2008R2 to 2016(preferred) or 2012 for the past 1.5 years. We are down to 4 applications still running on 2008/2008R2. We plan to be complete by next week. At which time, we’ll start planning the migrations from 2012 to 2019.

But I think Jeff Moden’s comment was my favorite:

I’m tickled!!! It means that 2008 is finally STABLE!!! ? ? ?


Building a SQL Server app? Start with Azure SQL DB.

Azure SQL DB
21 Comments

No no, April Fool’s was yesterday.

Hear me out.

Azure SQL DB’s feature limitations are a good thing. It doesn’t support everything that SQL Server supports, like CLR, cross-database transactions, database mail, linked servers, and OPENQUERY, but…frankly that feature-limitation page reads like a list of my favorite things to tell developers to avoid. You shouldn’t be using most of that stuff in a new application today. You might need it down the road, but…if you don’t, don’t get started using it on day 1. Stick with the basics, and Azure SQL DB supports those, plus more.

Azure SQL DB has optimistic concurrency. You get Read Committed Snapshot Isolation (RCSI) by default, which avoids most common readers-blocking-writers and writers-blocking-readers problems. Sure, you can still get into blocking problems – but this just avoids a lot of ’em right out of the box.

Azure SQL DB will force you to handle errors. A good developer will listen for things like deadlock errors and build retry logic into her application – but let’s face it, most of us aren’t that diligent. Azure SQL DB kinda forces you to do it by giving you transient errors when your database is under too much load. The better our developers realize that yes, even the best databases can throw transient errors, the better.

No, seriously, not a data dumpster fire, stop saying that
And stop seeing the official icon as a data trash can where the inside contents are on fire

Azure SQL DB confines the blast radius of bad queries. In a traditional shared SQL Server environment, a poorly written application can wreak havoc on the performance of unrelated applications that share the same guest or host. With Azure SQL DB, your performance really is confined to just your database – so poorly-written queries show up on the radar, fast. Managers get a much better idea of how much bad code will cost on a monthly basis.

In fact, if you’re a database administrator reading this, I bet Azure SQL DB is exactly the kind of system you’d want to force your developers to use when building a new app.

Stop thinking of Azure SQL DB as a limited product, and think of it as a database platform managed by strongly opinionated DBAs.

DBAs just like you.


Registration Open for My SQLSaturday Sacramento Workshop

Performance Tuning in 21 DemosI’m coming to Sacramento this year for SQLSaturday #885. On Friday, I’ll be teaching a one-day pre-con:

Performance Tuning in 21 Demos – You’re a developer or DBA who wants to tune indexes and queries to make your application go faster. You don’t like learning by watching slides or reading white papers – you want to jump right into the code and see what happens. You’re the kind of person who loves watching YouTube videos that start with, “Hold my beer and watch this.”

Attendees get their choice of a Recorded Class Season Pass or a Consultant Toolkit – so the pre-con pays for itself! Learn more and register now.

Can’t make it to Sacramento? Here’s where to find me this spring:


Should we use stored procedures or queries built in the app?

T-SQL
70 Comments

A client asked a great architecture question that deserved its own blog post:

Should we use more “stored procedures” for select, insert, update, delete or should that just be sent as queries from the application?

If you ask a junior database administrator where to put something, she’ll probably say “in the database” because that’s the thing she has control over. That’s fair – DBAs love having control over stuff. However, let’s step back a little.

If your shop lacks T-SQL expertise, but has a lot of sharp senior application developers, then it may be easier to keep the queries in the app. If you simply make a mandate that “all queries come from stored procedures,” but you don’t give your staff the training necessary to write fast, scalable stored procedures, then the result won’t perform. Database administrators love to bash the queries written by ORMs like Entity Framework and nHibernate, but the reality is that these days, those tools write better queries than untrained developers. Sure, in a perfect world, we’d all be perfectly trained on all of the tools we use, but….

If your shop is good at testing & source controlling app code, but doesn’t have that same level of expertise for testing & source controlling stored procedures, then you’ll probably find versioning and deployment easier when the queries are built into the app code. In the year 2019, testing & source controlling database objects like stored procedures and functions still isn’t quite as easy as app code. It’s getting better, but it’s not there yet.

If you’re good at measuring app code performance, like if you’re good with code speed tools like New Relic that instrument every step of your application code, then you’ll be able to more naturally track down slow queries with those tools. However, if you’re not good at app performance monitoring, you may find it easier to track down slow queries with plan cache tools like sp_BlitzCache.

If you have predictable performance needs, like your business has the same exact workload for months straight, then you can keep code in the application tier. When you start to see performance issues, you can make gradual changes to the code, test that as part of your regular testing processes, and gradually deploy those changes out through your normal release process.

T-SQL Fundamentals by Itzik Ben-Gan

However, if your business has extremely unpredictable performance needs, like a sudden high volume of transactions every few months, and if you don’t do a great job of performance testing ahead of time, then stored procedures can be a better fit. In the heat of a performance emergency, it can be easier to change and deploy a new stored procedure than deploy an entire new build of your application. For example, during one client’s emergency, I implemented this bizarro stored procedure caching technique because it meant the difference between making money, versus their online store being…not online.

In this client’s case, with a team of sharp app developers, none of which had database training, and no database developers or DBAs on the team, the answer was clear: keep the queries in the code. I do try to give folks an avenue to up their game if they want, though – and in your case, if you’ve got developers who want to level up, start them on Itzik’s classic, T-SQL Fundamentals.


What Are You Going to Do About SQL Server 2008?

SQL Server
98 Comments

Last week, you used SQL ConstantCare® to analyze 2,396 SQL Servers across a variety of versions:

Alas, poor SQL Server 2008
  • 15% (362 instances) of SQL Server 2008 and 2008 R2
  • 18% (438) SQL Server 2012
  • 27% (650) SQL Server 2014
  • 32% (777) SQL Server 2016
  • 7% (169) SQL Server 2017

That means 15% of your servers are going to be out of support in about 106 days: SQL Server 2008 & R2 both end support on July 9th.

So I’m curious:

  1. What does your company plan to do about that?
  2. If the answer is “nothing,” what have you tried to convince them otherwise? Or have you?
  3. What’s the single biggest thing stopping you from moving to a supported version?

I’m asking because it influences how we support these older versions in the First Responder Kit, SQL ConstantCare, and Consultant Toolkit. For years, I’ve said, “If Microsoft can’t support it, neither can we,” but given the relatively high market penetration of these old versions, I’m not sure I can still say that. (After all, if I look at the market numbers, it’s more profitable to support 2008 and R2 right now than it is to support 2017!)


What happens when you cancel or kill a resumable index creation?

Indexing
22 Comments

SQL Server 2019 adds resumable online index creation, and it’s pretty spiffy:

Those parameters mean:

  • ONLINE = ON means you’ve got the money for Enterprise Edition
  • RESUMABLE = ON means you can pause the index creation and start it again later
  • MAX_DURATION = 1 means work for 1 minute, and then gracefully pause yourself to pick up again later

If you decide you want to pause the index, run this command in another session:

When you do that, the index creation’s session fails with a bit of an ugly error:

Aborted index creation

Okay, well, that’s not exactly what I’d expect from “pausing” something, but that’s okay. There’s a new DMV, sys.index_resumable_operations, that shows the paused index creation:

sys.index_resumable_operations

It shows the syntax used to create the index, the percentage complete, when it was last paused, and more. If you want to give it a happy ending or abort it, it’s your choice:

So far, so good.

The first catch: a paused index is stealthy.

It doesn’t show up in sys.indexes, nor does it show up in the Object Explorer list of indexes on a table. That makes it sound like it’s harmless, but it’s not. I can’t drop the table:

Resumable index operation error

Nor can I create any other index – same error:

Index creation error

Tricky. New stuff for developers to watch out for in their deployment scripts.

The next catch: killing or canceling an index creation, doesn’t.

In SSMS, you’re used to being able to click the “Cancel” button on your query, and having your work rolled back.

You’re also used to being able to kill a query, and have it automatically roll back.

Neither of those are true with resumable index creations. In both cases, whether you kill the index creation statement or just hit the Cancel button in SSMS to abort your request, your index creation statement is simply paused until you’re ready to come back to it. (Or, it’s ready to come back to haunt you, as we saw above.)

So you’ve learned your lesson, right? Don’t use the resumable parameter if you don’t specifically need it. As long as you don’t ask for it, you should be fine…right? Wrong.

The final gotcha: you might get resumable even when you don’t ask for it.

SQL Server 2019 adds these database-level configuration options:

This means whenever you create an index, it’ll default to online creation and resumable even when you don’t specify it as part of your index creation statement! Translation: whenever you go to create any index, if you decide it’s a bad idea and click Cancel, your index creation is still left online partway done, lying in wait to disrupt other operations.

That’s why I’ve added an sp_Blitz check for resumable index operations that have been left behind. It’s in the dev branch now, and it’ll be in the April release. Enjoy!


Updated First Responder Kit and Consultant Toolkit for March 2019

This month, just half a dozen bug fixes, plus a new parameter for sp_BlitzCache to search the plan cache for specific strings. To get the new version:

Consultant Toolkit Changes

  • Improvement: new “CPU Now” tab shows the last few hours of CPU % along with a chart.
  • Improvement: more query plans without deep dive. By default, if you run the app without the deep dive switch, as long as it’s running quickly (less than 3 minutes), it’ll populate more of the plan cache tabs. It uses sp_BlitzCache’s @SkipAnalysis = 1 parameter, so the plans are gathered, but we don’t run the time-intensive analysis rules to tell you what’s wrong with each plan. If you want all the tabs & columns populated, use the deep dive switch.
  • Fix: size tab now populates even if user database collations don’t match system databases.
  • Fix: uptime tab no longer shows “RTM” for patch level on 2017/2019.
  • Plus all of the First Responder changes below:

sp_Blitz Changes

  • Fix: ignore backups-on-same-drive rule on Linux since it’s harder to detect mount points over there. (#1995, thanks UCJonathan for the bug report and Brandon (bsquidwrd) for the code.)

sp_BlitzCache Changes

  • Improvement: new @SlowlySearchPlansFor parameter lets you look for strings in the plan cache. Useful for when you wanna figure out what query is asking for a particular missing index, find out which query is using an index, or which query is calling a function. This one’s very new and untested, so if you find stuff, drop us a line in a new issue. (#2000)

sp_BlitzFirst Changes

  • Fix: when calling sp_BlitzCache, it was passing an invalid @SortOrder parameter, and since sp_BlitzCache started purposely throwing sev 16 errors in the #1945 enhancement, that caused the sp_BlitzFirst Agent jobs to fail.(#1983, thanks Bill Mrazik for the bug report.)

sp_BlitzIndex Changes

  • Fix: saving results to table was broken in last month’s release. Doh! (#1988, thanks Matthew Monroe for the report & fix.)
  • Fix: simplified missing index recommendations – they no longer say “with high impact” or “with low impact.” (#1991)

sp_DatabaseRestore Changes

  • Fix: the @StopAt value was not being honored when @ContinueLogs = 1. (#1986, thanks Troy Jennings for the report & fix, and ZLThomps1 for the assist.)
  • Fix: if you asked to restore diffs and logs, but no diffs were taken yet, the logs were being skipped too. (#1998, thanks Frederik Vanderhaegen.)

For Support

When you have questions about how the tools work, talk with the community in the #FirstResponderKit Slack channel. If you need a free invite, hit SQLslack.com. Be patient – it’s staffed with volunteers who have day jobs.

When you find a bug or want something changed, read the contributing.md file.

When you have a question about what the scripts found, first make sure you read the “More Details” URL for any warning you find. We put a lot of work into documentation, and we wouldn’t want someone to yell at you to go read the fine manual. After that, when you’ve still got questions about how something works in SQL Server, post a question at DBA.StackExchange.com and the community (that includes us!) will help. Include exact errors and any applicable screenshots, your SQL Server version number (including the build #), and the version of the tool you’re working with.


How to fix the error “String or binary data would be truncated”

Development
81 Comments

To fix this error, patch to SQL Server 2016 SP2, CU6 or newer (including SQL Server 2017), and then turn on trace flag 460. You can enable it at the query level or at the server level.

First, let’s see the error happen: let’s create a table with small fields, and then try to insert more data than it holds.

Baby’s car is longer than 20 characters, so when the insert statement runs, we get an error:

String or binary data would be truncated

That sucks because we have no idea which field is causing the problem! It’s especially terrible when you’re trying to insert lots of rows.

If you’re on SQL Server 2019+,
here’s how to fix it.

Run this in the database where you want specific truncation warnings, and it takes effect right away:

Another way you could fix it is to upgrade your database’s compatibility level to 2019+ (150+), but that causes a whole bunch of other things to take effect too, like adaptive memory grants, and it’s going to require a whole lot more testing with your code. Just keep it simple for now and run the above if all you’re trying to do is know which column & row is being truncated.

If you’re on SQL Server 2016-2017:
to fix it, turn on trace flag 460.

Trace flag 460 was introduced in SQL Server 2016 Service Pack 2, Cumulative Update 6, and in SQL Server 2017. (You can find & download the most recent updates at SQLServerUpdates.com.) You can turn it on at the query level, like this:

And now when the query runs, it shows you which column is getting clipped, and which row, too. In our case, we’ve only got one row – but in your real-life data, you’ll be much happier knowing which row’s triggering the error:

You can turn on this trace flag at the query level as shown above, or at the server level:

That turns it on for everybody, not just you – so get everybody on your team to agree before you turn it on. This changes the error message number from 8152 to 2628 (as shown above), which means if you’ve built error handling based on the error number, you’re suddenly going to start getting different behavior.

I’m a fan of turning this trace flag on while I’m doing troubleshooting, and then once I’ve found the culprit, turning it back off again:

In our case, once we’ve identified that Baby’s car is too large, we either need to change his car, or change the datatype in our table to make it bigger, or cast the data on the way in to explicitly strip the extra length off his car. A data chop shop, if you will.

Don’t leave this trace flag enabled.

There’s at least one bug with it as of today on SQL Server 2017 CU13: table variables will throw errors saying their contents are being truncated even when no data is going into them. Andrew Pruski reports:

Sadly, that behavior is NOT fixed, and here’s the simplest repro script I could build:

SQL Server 2017 CU13 still reports that the string will be truncated even though the insert doesn’t run:

Switch out the table variable for a temp table, and it works fine, as expected:

If you want to follow progress on that bug getting fixed, it’s here. Such a great example of why I’m not a fan of using trace flags by default – sure, they can fix issues, but they can also introduce unpredicted, unwanted behaviors. (And, uh, not a fan of table variables either.)

Update 2019/03/25 – the above bug is fixed in 2017 Cumulative Update 14. Yay!


Registration Open for My SQLSaturday Boston Pre-Con

Conferences and Classes
0

Performance Tuning in 21 DemosI’m coming to Boston this year for SQLSaturday #877. On Friday, I’ll be teaching a one-day pre-con:

Performance Tuning in 21 Demos – You’re a developer or DBA who wants to tune indexes and queries to make your application go faster. You don’t like learning by watching slides or reading white papers – you want to jump right into the code and see what happens. You’re the kind of person who loves watching YouTube videos that start with, “Hold my beer and watch this.”

Attendees get their choice of a Recorded Class Season Pass or a Consultant Toolkit – so the pre-con pays for itself! Learn more and register now.

Can’t make it to Boston? Here’s where to find me this spring:


Poll Results: What Conference Schedule Did You Prefer?

Last week, I asked you a couple of questions:

When you attend a 1-day conference like a SQLSaturday or SQL Relay, what is your preferred session schedule?

You said:

  • 31.8% (211 votes): 6 60-minute sessions
  • 31.3% (208 votes): A mix of 45-minute and 90-minute sessions
  • 25.3% (168 votes): 7 45-minute sessions: 25.3%
  • 11.6% (77 votes): 5 75-minute sessions

Other ways to think about that:

  • 88.4% do not want 75-minute sessions
  • 56.6% want 45-minute sessions as building blocks, and most of those voters want some of the sessions to be double-length

I know that’s frustrating for some presenters to hear because presenters want all of the time they can get, but the reality is that during a 1-day conference, attendees want more variety.

When you attend a 2-3 day conference like the PASS Summit or SQLbits, what is your preferred session schedule?

You said:

  • 50.2% (333 votes): A mix of 45-minute and 90-minute sessions
  • 20.2% (134 votes): 6 60-minute sessions
  • 18.2% (121 votes): 5 75-minute sessions
    (or to put it another way, 81.8% of voters do not want this)
  • 11.4% (76 votes): 7 45-minute sessions

I expected the numbers to be different during a longer event (thus the two separate questions), and they were – but in both cases, they were a strong vote against the default 75-minute session length of many events.

Attendees like 45 minute blocks, not 75.

This confirms something I’ve found when polling my own training class attendees who told me things like:

  • 75 minutes is too long to listen to one speaker without a break
  • Speakers try to cover too much ground, trying to bring people from 100-level to 300-level in a single session
  • When given a 75-minute slot, speakers leave too much time for Q&A – when instead they should take questions during the break, next to the podium, after the session completes

As a presenter, my first reaction was to fight the attendees – to tell them they don’t understand what presenters are trying to do, or how we as presenters could do better, or how we need to adapt their expectations.

That doesn’t work.

Attendees are the customers, and we presenters need to spend some time listening and adapting our work to meet the customers’ requests. They want shorter sessions, and they want us to deliver more knowledge in less time.

If you’re a presenter, this means your abstracts need to clearly define your ideal session attendee, then stick to it. As you plan your abstract, write down what the ideal session attendee already knows, and don’t try to cover that stuff in the session. Write down what’s going to be out of scope too – you simply can’t take someone from 100 level to 300 level inside a single 75-minute session. (You certainly can’t do it in 45, either – and if conferences listen to attendee feedback, shorter sessions might start becoming the new normal.)

In my own classes – both one-day pre-cons and multi-day classes – I’ve taken this feedback to heart by aiming to teach in 45-60 minute modules rather than 60-75 minutes. At first, it felt like a more stuttered agenda, taking a 15-minute bio break every 45 minutes, but it does seem to result in more focused attendees that are more able to digest material through the entire day.


What are students saying about my latest round of classes?

Company News
6 Comments

Mastering Index TuningMastering Index Tuning has a fresh set of reviews from the latest students.

Levente Kalotai wrote:

Absolutely loving it. The class, Brent style, everything. I have to admit, I had my reservations before the class, but boy I was wrong about it. Less than 5 minutes in the first lab anyone can see the insane amount of work what was put into the class. This admiration only grows through the 3 days as everything is marching toward the last lab. I am really grateful to Brent and his team to use their extensive real-life knowledge and put this class together. Cannot wait till Query Tuning starts, probably I will start the previous recordings ?

Katie Walsh wrote:

This class was just top notch. Brent is very entertaining and he explains the material in such a clear and concise manner. I learned a ton. Looking forward to the next class

Jay Taylor wrote:

Thorough and entertaining. Brent hits Sql Server indexing’s high points, low points and all points in between. Then he gives you a lab to do the work to let the lecture sink in. During the lab, he’ll help you out, in real time. And later you can watch the session again and do the labs again, on your own. It’s a great way to learn. I wish there were similar courses for C#, Angular and Javascript.

Mohammad Darab wrote:

Brent’s way of teaching is unmatched! This class is an absolute must for SQL Server professionals. Perfect amount of lecture, lab time, and Q&A.

Michael DeMore wrote:

The Master Index Tuning class is great. From the way the material is presented, to working the labs I really enjoyed this class. In fact, I have take 4 of Brents classes and they all are wonderful. I do highly recommend. And since I purchased the season pass, I look forward to the next class I take.

Joe D’Aquila wrote:

Excellent! Informative and entertaining. There was the right amount of structure and freedom. The lab machines and tools were top notch. I left the session eager to index tune. I am very much looking forward to the rest of the training classes in this series. Thank you Brent!

Wanna join in on the fun? Here are my upcoming classes:

Wanna take ’em all? Check out my Live Class Season Pass. Most of my students get this so they can take all of my classes for a year straight, and even re-take classes multiple times depending on their schedules.


Pop quiz: what do these things cost?

It’s been a few years since we’ve stopped in for a sanity check. Quick: without searching the web for prices, put these items in order. Do it on a scratch paper, guessing how much you think each one costs, then arrange ’em.

  • SQL Server 2017 Standard Edition licensing for 4 cores
  • SQL Server 2017 Enterprise Edition licensing for 1 core
  • 64GB of memory for a modern server (Dell r740)
  • 256GB of memory for a modern server (Dell r740)
  • A mirrored pair of 4TB PCIe SSDs
  • One year of an 8-core, 61GB RAM, 1.9TB SSD VM in EC2 (i3.2xlarge)
  • One month of an 8-core, 40GB RAM Azure Managed Instance (G5 BC)
  • One typical day of IT employee time (say, developer, sysadmin, DBA)
  • One week of a team’s time (4 people)

And I’ll make it a little easier for you: group them into these buckets:

  • Under $2,000
  • $2,000-$4,000
  • $5,000-$10,000
  • Above $10K

Without searching the web, write down on scratch paper what you think they cost, and put them in order. When you’re done, check yourself in the comments.

I find that if you haven’t been shopping for this stuff recently, you might be spending a little too much time slaving over a hot Pentium 4.


How to Implement In-Memory OLTP Quickly and Easily

Architecture
32 Comments

When you first hear about it, SQL Server’s In-Memory OLTP sounds like a new feature that’s hard to implement, requires a lot of schema changes, and takes planning and downtime.

I’m here to tell you it’s simply not true, and you can do it in just 3 steps. Here’s how:

  1. Read Microsoft’s guidance on how much memory you’ll need
  2. Give your SQL Server that much
  3. Set your max server memory setting appropriately, leaving 4GB or 10% free for the OS, whichever is higher

That’s it. That’s all there is.

Forget the feature named “In-Memory OLTP” and just put the hardware in that the feature would require anyway. You’re going to have to do it sooner or later, so just start there. Before you go writing the necessary conflict detection code, trying to rip out your unsupported cross-database queries, messing around with hash index troubleshooting, or stressing out about their statistics problems, just buy the damn RAM.

You’d be stunned at how often that simply makes the performance issues go away.


In Azure SQL DB, what does “The connection is broken and recovery is not possible” mean?

Azure SQL DB
12 Comments

All it really means is, “Click Execute again, and you will be fine.”

If I had a dollar for every time I saw this error message in SQL Server Management Studio:

The connection is broken and recovery is not possible. The connection is marked by the server as unrecoverable. All you have to do is hit F5, but I can't be bothered to do that for you.
The connection is broken and recovery is not possible.

The error says:

The connection is broken and recovery is not possible. The connection is marked by the server as unrecoverable. No attempt was made to restore the connection. (Microsoft SQL Server)

That’s not what it means though. Here’s what it really means:

Click Execute again, and things will be fine.

It’s not that your network is broken, or that your IP address changed, or that there’s a firewall error. Something just happened behind the scenes where Azure decided your connection was idle and it needed to do something on the server side.

I wish Management Studio wouldn’t give in quite so easily. Just run your query again, and you’ll be fine.


Are nulls stored in a nonclustered index?

Indexing
13 Comments

When you index a nullable field, are the rows with nulls stored in the index? It’s easy enough to find out by creating a table with a nullable field, and then creating an index on it:

Here’s the plan:

Yep, SQL Server stores the nulls in the index. That makes sense, really, because sooner or later, you’re going to want to find the rows with nulls, and when you’ve only got a few nulls in a big table, the index can help a lot there.

To learn more about this stuff in action, watch my free 90-minute course, How to Think Like the SQL Server Engine.


What sessions do you want to see at GroupBy next month?

GroupBy Conference
6 Comments

GroupBy.org is a free online conference run by the community, for the community. You get to pick the sessions by voting.

Voting is open now through March 15 for the next event, happening April 11. Here are some of the sessions you can choose from:

  • Just Enough Database Theory for Power BI
  • Linux OS Fundamentals for the SQL Admin
  • Marketing for SQL Consultants and Business Owners
  • PowerShell for the SQL DBA
  • SQL Server Memory Internals & Troubleshooting
  • Think Like a Certification Exam

Go vote now. It’s totally free, no registration required.