This week, I’ve been writing about how SQL Server 2019’s bringing a few new features to mitigate parameter sniffing, but they’re more complex than they appear at first glance: adaptive memory grants, air_quote_actual plans, and adaptive joins. Today, let’s talk about another common cause of wildly varying durations for a single query: user-defined functions.
Scalar UDFs and multi-statement table-valued functions have long been a bane of performance because as your data quantity grows, they still run row-by-agonizing-row.
Today, SQL Server hides the work of functions.
Create a function to filter on the number of Votes rows cast by each user, and add it to the stored procedure we’re working on this week. Eagle-eyed readers like yourself will notice that I’ve changed the TOP to just a TOP 100, and removed the order by, and the reason why will become apparent shortly:
|
1 2 3 4 5 6 7 8 9 10 11 12 13 14 15 16 17 18 19 20 21 |
CREATE OR ALTER FUNCTION dbo.GetVotesCount ( @UserId INT ) RETURNS BIGINT WITH RETURNS NULL ON NULL INPUT AS BEGIN DECLARE @Count BIGINT; SELECT @Count = COUNT_BIG(*) FROM dbo.Votes WHERE UserId = @UserId; RETURN @Count; END; GO /* Add it to our proc, but change TOP to 100 so it finishes faster, and just get a few fields: */ CREATE OR ALTER PROC dbo.usp_UsersByReputation @Reputation INT AS SELECT TOP 100 u.DisplayName, u.Location, u.WebsiteUrl, u.AboutMe, u.Id FROM dbo.Users u WHERE Reputation = @Reputation AND dbo.GetVotesCount(u.Id) = 0 /* BAD IDEA */ /* ORDER BY DisplayName; And commenting this out so we only run the function 100x, or else we'd run it on the whole result set, then order it */ GO |
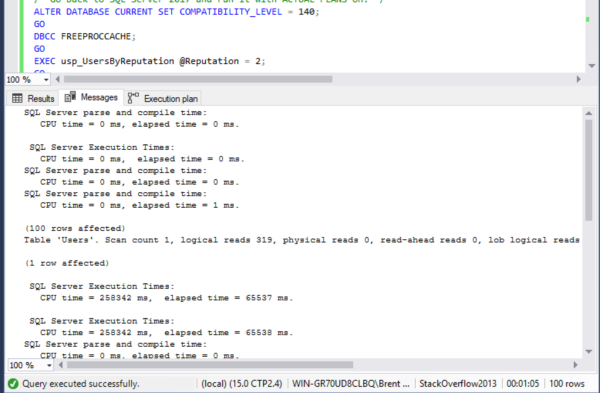
Without the function, this query takes under a second. Add in the function, and the function flat out kills performance: in compatibility level 140 (2017), the query takes about about a minute. SET STATISTICS IO ON doesn’t show anything about reading from the Posts table:
Note that CPU time is much, much higher than elapsed time – indicating that something in the query went parallel. (That’ll be important later.)
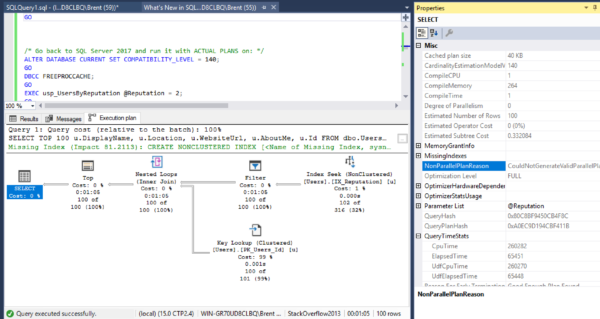
As query tuners know by now, the query plan doesn’t show the work involved with the function:
Thankfully, sp_BlitzCache shows the ugly truth (and you’ll have to click to zoom for sure on this one):
The function runs 102 times, each time burning 2.5 seconds of CPU time in ~600ms of duration, doing 248K logical reads. That’s a lot of row-by-agonizing-row work. Okay, well, that’s not good, and that’s why user-defined functions have caused much gnashing of teeth.
SQL Server 2019 inlines the work, so
it goes slower. Yes, you read that right.
In the Froid white paper, Microsoft talked about how they were working on fixing the function problem. When I read that white paper, my mind absolutely reeled – it’s awesome work, and I love working with a database doing that kind of cool stuff. Now that 2019 is getting closer to release, I’ve been spending more time with it. Most of the time, it works phenomenally well, and it’s the kind of improvement that will drive adoption to SQL Server 2019. Here, though, I’ve specifically picked a query that runs worse only to show you that not every query will be better.
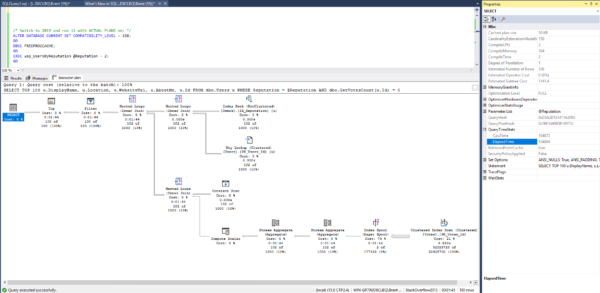
To activate Froid, just switch the compatibility level to 150 (2019), and the query runs in 1 minute, 45 seconds, or almost twice as slow. Dig into the actual plan to understand why?
There’s something present that we DON’T want: an eager index spool. Like Erik loves to say, that’s SQL Server passively-aggressively building a sorted copy of the data in TempDB, accessing it over and over, and refusing to build a missing index hint. “No no, it’s okay, you’re busy – I’ll take care of it for you. I know you don’t have time to build indexes or call your mother.”
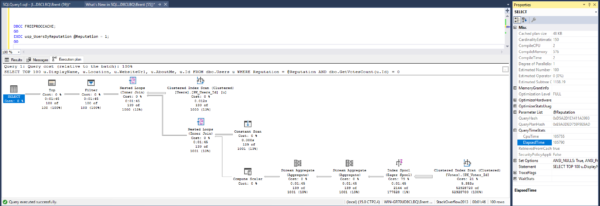
There’s something missing that we DO want: parallelism. Remember how I kept harping about the 2017 plan going parallel, using more CPU time than clock time? Yeah, not here – this query is single-threaded despite a cost over 1,000 query bucks. Even if you clear the plan cache and try again with @Reputation = 1, you still get a single-threaded plan:
And it’s not that you can’t get a parallel plan with a scalar UDF – that limitation has been lifted for Froid-inlined functions, but there’s something wonky happening here in the plan generation. Sure, I understand that the eager spool is still single-threaded, but… what about the rest? Hell, even a COUNT(*) from Users goes parallel here, and that finishes in under a second:
<sigh>
So, to recap: the query runs slower, doesn’t generate missing index hints, and is still single-threaded. For this particular query, Froid isn’t getting us across the finish line.
Let’s try inlining the function ourselves.
Take the function and inline it:
|
1 2 3 4 5 6 7 8 |
CREATE OR ALTER PROC dbo.usp_UsersByReputation @Reputation INT AS SELECT TOP 100 u.DisplayName, u.Location, u.WebsiteUrl, u.AboutMe, u.Id FROM dbo.Users u CROSS APPLY (SELECT COUNT(*) AS VoteCount FROM dbo.Votes v WHERE v.UserId = u.Id) pc WHERE Reputation = @Reputation AND pc.VoteCount = 0; /* ORDER BY DisplayName; And commenting this out so we only run the function 100x, or else we'd run it on the whole result set, then order it */ GO |
And the difference is staggering: it runs in under a second, and everything in the plan goes parallel:
 So to recap: am I saying Froid is bad? Absolutely not – I’m loving it. Just like adaptive memory grants and air_quote_actual plans, Froid is one of my favorite features of SQL Server 2019 because when it helps, it REALLY helps. The example in this blog post is a fairly unusual case in my testing so far.
However, like I wrote yesterday, you’ve really gotta test your code to be able to say with confidence that you’re going to see a difference, and that the difference won’t be adverse. It’s just not fair to expect Microsoft to deliver an update to SQL Server that makes every single edge case go faster. When a few queries regress, you’ve gotta have history of their prior plans in Query Store, and the knowledge to use that past plan to get an older version in place long enough for you to fix the query for the long haul. (Remember, as developers deploy a tweaked version of the query, like adding a field to it, the old Query Store forced plan will no longer apply as the query text changes.)
And again – this is just like the 2014 release when 99% of your code ran faster, but 1% ran slower, and that 1% came as a really ugly surprise that required hard, hard troubleshooting to narrow down. Joe Sack giveth, and Joe Sack taketh away. (Well, I guess even when he taketh, he giveth to uth consultanth.)
Updated April 12 – had the wrong inlined function in the “after” results, and was showing a manually-tuned version as running in 13 seconds. My bad – that was from a prior draft of the post. Props to Bryan Rebok for catching that in the comments.


16 Comments. Leave new
Brent, I’m not sure how much this will sway the results, but it looks like your logic is different between the UDF and the manually inlined versions:
– COUNT_BIG from dbo.Votes vs COUNT from dbo.Posts
– top 10 vs top 100
– the original version of the SP was filtering where the function call result = 0
– possibly different columns in the select list between the versions
– commented out ORDER BY in the original version
Bryan – great catch! That manually tuned one was from a different function that I was trying in an earlier draft of the post. The difference is now even more dramatic – the manually tuned one runs in under a second. Updated the post to reflect that. Thanks, and have a good weekend!
> he giveth to uth consultanth
I know you sometimes have to deal with strange and arcane phenomena that man is not meant to wot of, but I didn’t know you employed an Igor.
Heh – in my head, I heard it more as Sylvester: https://www.youtube.com/watch?v=PkhPuH8G5Hg
This means that the performance tuner job won’t be going away anytime soon, I’m ok with that 😀
Another important difference in logic between the UDF and the manually inlined version: you seem to have ignored the “RETURNS NULL ON NULL INPUT” while manually inlining.
Froid cannot ignore it in general, and so the resulting expression would get more complex.
Karthik – Yes, I’m taking typical examples of code that users write – they’ve long been told that returning null on null inputs will make functions faster. When you rewrite that code to go inline manually, you don’t have to bother with that – especially here where no nulls can go in.
My only point is that you are not doing an apples-to-apples comparison here, if your manually inlined version is not equivalent in behavior to the UDF.
I would call it an apples to apples comparison because I’m comparing how SQL Server tuned it versus how a human tuned it. The whole point of Froid is that it makes code go faster without a human being getting involved, right? If a human gets involved, you wouldn’t tell them, “sorry, you have to purposely write bad code for an apples to apples comparison with a feature that made your query slower.” That just doesn’t make sense.
[…] Brent Ozar has been digging deep into new functionality in SQL Server 2019: […]
Had no idea that this optimization even existed:
WITH RETURNS NULL ON NULL INPUT
I was immediately intrigued and was staggered to find it’s been there since 2008! https://sqlperformance.com/2018/12/sql-performance/improve-udfs-null-on-null-input
Its “Freud”…
Charles – nope, it’s Froid. Microsoft wrote a white paper and chose Froid as the feature code name: https://www.brentozar.com/archive/2018/01/froid-sql-server-vnext-might-fix-scalar-functions-problem/
[…] UDFs often cause poor query performance due to forcing serial plans and causing inaccurate estimates. One way to possibly improve the performance of queries that call UDFs is to try and inline the UDF logic directly into the main query. With SQL Server 2019 this will be something that happens automatically in a lot of cases, but as Brent Ozar points out you might occasionally have to manually inline a UDF’s functionality to …. […]
Thanks for the article Brent! Any idea if the performance results are any different with the fixes from the CU2 or latest CU3?
https://support.microsoft.com/en-us/help/4538581/fix-scalar-udf-inlining-issues-in-sql-server-2019
I’m out on vacation with my family, but the cool part of these demos is that you can download ’em and run ’em yourself to see.