Blog

Quiz: Are You the Next Brent Ozar Unlimited Consultant?

Hey SQL Server DBAs — we’re hiring!Help-Wanted-Unicorn

Here’s a quick five question quiz. Give yourself one point for every ‘yes’:

  1. Have you been a database administrator for a few years?
  2. Does planning how to keep an application reliable and safe from disasters sound like fun?
  3. Do you love helping people make SQL Server go faster?
  4. Would you like to have a cartoon character of yourself?
  5. Can you see yourself dropping into our Office Hours sessions occasionally to help people for free?

If you got five points, you just might be the next Brent Ozar Unlimited employee!

Here’s what to do next:

Read more about the job here to find out what we’re looking for and what benefits we offer.

Then tell us about you!

We plan to accept applications through Friday, March 6, but don’t wait too long to submit — life moves fast sometimes.

Update March 7 – applications are closed, and we’re interviewing candidates. Thanks!


Always On Availability Groups FAQ

Here are some of the Always On Availability Groups questions I get the most often:

Q: How much network bandwidth will I need?

For a really rough estimate, sum up the amount of uncompressed transaction log backups that you generate in a 24-hour period. You’ll need to push that amount of data per day across the wire. Things get trickier when you have multiple replicas – the primary pushes changes out to all replicas, so if you’ve got 3 replicas in your DR site, you’ll need 3x the network throughput. Calculating burst requirements is much more difficult – but at least this helps you get started.

Q: What’s the performance overhead of a synchronous replica?

From the primary replica, ping the secondary, and see how long (in milliseconds) the response takes. Then run load tests on the secondary’s transaction log drive and see how long writes take. That’s the minimum additional time that will be added to each transaction on the primary. To reduce the impact, make sure your network is low-latency and your transaction log drive writes are fast.

Q: How far behind will my asynchronous replica be?

The faster your network and your servers are, and the less transactional activity you have, the more up-to-date each replica will be. I’ve seen setups where the replicas are indistinguishable from the primary. However, I’ve also seen cases with underpowered replicas, slow wide area network connections, and heavy log activity (like index maintenance) where the replicas were several minutes behind.

Q: What’s the difference between AGs in SQL 2012 and SQL 2014?

SQL Server 2014’s biggest improvement is that the replica’s databases stay visible when the primary drops offline – as long as the underlying cluster is still up and running. If I have one primary and four secondary replicas, and I lose just my primary, the secondaries are still online servicing read-only queries. (Now, you may have difficulties connecting to them unless you’re using the secondary’s name, but that’s another story.) Back in SQL 2012, when the primary dropped offline, all of the secondaries’ copies immediately dropped offline – breaking all read-only reporting queries.

Q: How do I monitor AlwaysOn Availability Groups?

That’s rather challenging right now. Uptime monitoring means knowing if the listener is accepting writeable connections, if it’s correctly routing read-only requests to other servers, if all read-only replicas are up and running, if load is distributed between replicas the way you want, and how far each replica is running behind. Performance monitoring is even tougher – each replica has its own statistics and execution plans, so queries can run at totally different speeds on identical replicas. There’s not really a good answer to this question right now.

Q: How does licensing work with AlwaysOn Availability Groups in SQL 2012 and 2014?

All replicas have to have Enterprise Edition. If you run queries, backups, or DBCCs on a replica, you have to license it. For every server licensed with Software Assurance, you get one standby replica for free – but only as long as it’s truly standby, and you’re not doing queries, backups, or DBCCs on it.

Q: Can I use AlwaysOn Availability Groups with Standard Edition?

Not at this time, but it’s certainly something folks have been asking for since database mirroring has been deprecated.

Q: Do AlwaysOn AGs require shared storage or a SAN?

No, you can use local storage, like cheap SSDs.

Q: Do Availability Groups require a Windows cluster?

Yes, they’re built atop Windows failover clustering. This is the same Windows feature that also enables failover clustered instances of SQL Server, but you don’t have to run a failover clustered instance in order to use AlwaysOn Availability Groups.

Q: Do I need a shared quorum disk for my cluster?

No, and check out Kendra’s video on failover cluster quorum to learn your options.

Q: What version of Windows do I need for AlwaysOn AGs?

We highly recommend Windows Server 2012R2, and here’s why.

Q: Can I have different indexes or tables on my replicas?

No, the replica database contents will be exactly the same as the primary.

Q: If I fail over to an asynchronous replica, and it’s behind, how do I sync up changes after the original primary comes back online?

That is left as an exercise for the reader. When I go through an AG design with a team, we talk about the work required to merge the two databases together. If it’s complex (like lots of parent/child tables with identity fields, and no update datestamp field on the tables), then management agrees to a certain amount of data loss upon failover. For example, “If we’re under fifteen minutes of data is involved, we’re just going to walk away from it.” Then we build a project plan for what it would take to actually recover >15 minutes of data, and management decides whether they want to build that tool ahead of time, or wait until disaster strikes.

Kendra says:  I wish I’d had this list when I started learning about AGs. I was also surprised to learn that crazy things can happen in an AG when you create indexes. Check out more on that here.


Woohoo! We Won a Red Gate Tribal Award: Best Blog of 2014 (Again)

SQL Server
3 Comments

For the past two years, Red Gate’s Tribal Awards have let you, the SQL Server community, nominate and vote on their favorite community voices. Here’s the 2014 winners:

This is the second year in a row that we’ve won the Best Blog award, and there’s three sets of people I want to thank.

First, I want to thank you, dear reader, for giving us the award. We toil away over a hot keyboard to bring you all kinds of useful stuff in a humorous way. It’s great to know that you enjoy our work.

Second, I want to thank my coworkers. Whenever they finish a blog post, they send it to the rest of the team for feedback, and I learn something in every single blog post I read. This job is so much fun.

Finally, I want to thank the other Tribal Award winners and nominees. This community is so uplifting, sharing, and generous. I’m proud to be a member of the SQL Server community.


9 Ways to Lose Your Data

Every time someone tells me, “This database is mission critical – we can’t have data loss or downtime,” I just smile and shake my head. Technology is seriously difficult.

To illustrate, here’s a collection of client stories from the last few years:

  1. The DBCC CHECKDB job ran every week just like it was supposed to – but it failed due to corruption every week. No one got email alerts because the SQL Agent mail was no longer valid – internal email server changes meant the mail was just piling up in SQL Server. CHECKDB had been failing for three years, longer than the backups were kept. Data was permanently lost.
  2. The DBA configured his backups to write to a file share. The sysadmins never understood they were supposed to back up that file share. When the DBA asked for a restore, he was surprised to find there were no backups.
  3. Three SQL Servers were all replicating data to each other. When I asked the DBA where the backups were run, he looked at one server, then another, then the third. He sheepishly admitted – in front of his manager – that there were no backups done anywhere.
  4. The DBA set up full backups daily, plus log backups of all databases in full recovery mode. Later, she put a few databases into simple recovery mode in order to fix an issue. She forgot to put them back into full recovery mode. When problems struck and she needed to recover a database, she lost all data back to the prior full backup.
  5. The SQL Server ran out of space on the C drive. During emergency troubleshooting, someone deleted a bunch of BAK files. The server started up, but databases were offline and corrupt. Turned out the user databases were on the C drive, as were all of the backups – the very backups that were just deleted to free up space.
  6. The DBA started getting odd corruption errors on one of his servers, then more, and quickly all of them. The SAN admin had flashed the storage with new firmware – which had a bug. The DBA was writing his backups to that same SAN, and sure enough, some of the corrupt databases had corrupt backups too.
  7. The admin wanted to restore the production databases onto another server. He tried, but it kept saying the files were in use. He stopped the SQL Server service, deleted the files, started it again, and finally his restore worked – but his phone lit up. Turned out he’d remote desktopped into the wrong server – he was on production.
  8. The developer did a deployment on Friday afternoon, tested it, and went home. However, the deployment had an UPDATE script that wrote invalid data to a percentage of the rows in a critical table. Over the weekend, people worked in that table, putting in valid data and changing some invalid data. On Monday, by the time the team figured out what had happened, the data in the table was a total mess – with real valuable data that shouldn’t be restored over.
  9. The team built a complex AlwaysOn Availability Groups infrastructure for really reliable databases, and full backups every night, and log backups every 4 hours. When someone accidentally issued a delete statement, that delete was instantly replicated across to the other replica. They could still recover back to a point in time – but it meant serious downtime for the AG since you can’t restore databases in an AG. While they debated what to do, more valid data went into their production database – meaning they could no longer simply do a point-in-time restore.

Each of these teams thought their data was safe.

They were wrong.

Kendra says: OK, I’ve got to admit it– I’ve been part of teams where we’ve fallen victim to more than one of these scenarios. And I work on teams with smart people! This can happen to you, look at these stories and your own environment slowly and carefully.


Comparing SQL Server and Oracle Log Shipping

Both Oracle and SQL Server offer several ways to support disaster recovery scenarios. One of the simplest ways to handle DR in the SQL Server world is to use SQL Server log shipping. Oracle doesn’t offer log shipping as a part of the core product, but it’s possible to set up log shipping in Oracle.

I thought it would be fun to take a look at Oracle and SQL Server log shipping side by side, so let’s take a look!

Log Shipping Set Up

SQL Server wins this one. Reason: there’s a wizard. Even a novice DBA can get log shipping working using the wizard.

Congratulations Oracle professional, you’re setting this up by hand! If you’re at all handy with scripting, once you’ve set up Oracle log shipping, you can port your code to any other Oracle installation and be up and running in a few minutes once you’ve set up the log shipping scripts for the first time. Setting up Oracle log shipping the first time might just take you a while.

Although SQL Server wins for ease of set up, it’s worth reminding you – Oracle log shipping set up can be easily moved from server to server by deploying scripts and changing one or two variables.

Day to Day Operations

SQL Server’s log shipping adds additional requirements for database administrators. Log shipping sets up an extra set of transaction log backup jobs – existing jobs will need to be disabled or deleted. If a DBA takes a log backup outside of the normal log shipping jobs, that can potentially break log shipping. Switching SQL Server into SIMPLE recover mode will break log shipping – and yes, this is more common than you’ll think.

Oracle’s log shipping works by copying archived redo log files. There are no extra backup jobs to add. Instead, the log shipping jobs copy archived redo log files from the flash recovery area. Rotating out active redo log files will move them into the archive redo log file area. DBAs can take advantage of their existing backup strategy. It is still possible for an Oracle DBA to break log shipping by using NOARCHIVELOG mode or adding tablespaces or files without adding them on the secondary.

Of course, a DBA can also use the FORCE LOGGING option to prevent users from switching to NOARCHIVELOG mode and breaking the log shipping.

One other note – Oracle log shipping will move security between both instances while SQL Server’s log shipping won’t.

Reversing Log Shipping

In both cases, there’s a lot of work that has to be done when you want to reverse log shipping.

With SQL Server, you can gracefully reverse log shipping by using a “tail of the log backup”, but not a lot of people know how to do this properly so they can avoid the overhead of re-initializing running a full backup. In the end, people frequently re-initialize log shipping, lose data, or just get very upset until they stumble upon the answer.

To reverse Oracle log shipping, we can use the same set up scripts, but change the name of the primary and standby servers. Depending on how things are set up, it may be possible to rapidly start the Oracle instance using the fast recovery area to bring the standby online and immediately resume log shipping.

If you’ve set up log shipping using robust scripts, the Oracle log shipping approach can be easily reversed. If you haven’t, reversing log shipping poses just as many problems on one system as the other.

Querying the Replica

It’s not uncommon to use log shipping to provide a readable replica. This can be very helpful when users can tolerate stale data for reports, but you have not been able to develop a reporting schema.

With SQL Server, we have to put the SQL Server into STANDBY mode. As Kendra Little explains in Reporting From a Log Shipping Secondary in STANDBY Mode, putting SQL Server into STANDBY mode is necessary to read from the secondary, but it can have make recovery take longer which could, in some scenarios, put you outside of your recovery point objective.

With Oracle, this process is easy – at any point during log shipping, we just mount the database in read only mode using the command ALTER DATABASE OPEN READ ONLY. Users will be able to read up to the last restored transaction. Once it’s time to start restoring data, you can start the database in recovery mode.

Licensing

Licensing is annoying and complex. If I get this wrong, sound off in the comments and I’ll do my best to clarify and correct.

With SQL Server licensing, this may change depending on when you licensed your SQL Server. However, you get one “free” standby instance, as long as you don’t read from that instance. You do have to pay for software assurance on the log shipping secondary.

Oracle’s licensing is simpler: if it’s running, you pay for it. Also, you pay for support.

Oracle wins through simple licensing. If you’re using Oracle Enterprise Edition, you have many more options for disaster recovery, and much more entertaining ways to pay.

Compression and Encryption

When you’re moving backups across the network, compression can help meet your recovery point objective.

SQL Server can compress backups in the Standard Edition of the product. This can either be enabled as a default SQL Server level setting or in the log shipping jobs.

Oracle’s compression is only found in either Oracle Enterprise Edition or customers using Oracle’s backup to the cloud feature – Oracle Database Backup Service. However, it’s trivial to leverage in-flight compression when moving files between Oracle instances. In a recent deployment, we used rsync to move files between primary and standby and enabled the -z flag to ensure we got compression.

Starting with SQL Server 2014, SQL Server supports backup encryption. Oracle Standard Edition, on the other hand, does not have backup encryption. In the Oracle world DBAs are far more likely to use SSH, scp, or rsync to move files between servers – all of these support encrypting data transferred between servers.

There’s no clear winner here – both compression and encryption are possible with both products, but they are built in to SQL Server. The Oracle approach lets system administrators adopt the practices that are in use across enterprise.

Summary

Oracle and SQL Server both have log shipping options available. Both tools are built on different sets of technologies and they both have different strengths and weaknesses.

SQL Server Oracle
Set Up Wizard. Manual, but scriptable.
Operations Additional caveats to prevent breaking the log chain. Mostly automatic. Caveats apply, but preventative measures are available.
Reversing Log Shipping Can be done with rocket science and custom scripts. Scripts can be deployed on both primary and standby – reversing requires switching several commands.
Querying the Standby Yes, only in STANDBY mode. STANDBY can make restores slow. Mitigate with complex scripts. Yes, in READ ONLY mode. Oracle must be restarted to resume log shipping.
Licensing Requires software assurance. Requires a second, fully licensed, Oracle instance.
Compression SQL Server backup compression. OS, storage, or network compression.

Brent Says: WOOHOO, SQL Server actually wins a couple of these!

Kendra Says: Ain’t nothin’ wrong with a wizard, especially when you’re just getting started with something.


Extended Events Sessions: Messing Up Filters

SQL Server
8 Comments

Recently, I wanted to play around with the auto_stats event against a test system running SQL Server 2014. I ran through the session setup GUI and added the auto_stats event. I configured it with a filter (predicate) to only show me auto_stats event in a database named AutoStatsTest. There’s a cost to events that may fire frequently and a cost to filters, but this is my test box and I was just using this to learn– so no biggie, right?

The wizard worked just fine. It created a session which scripted out as this:

I started up the session and started running some code to create the AutoStatsTest database, populate data in a table, and then run some SELECT queries. I left the auto_create_statistics property enabled on the database so that the SELECT queries should trigger automatic creation of stats. I then deleted data and ran the selects again.

After running my code, I opened up my trace file and saw…. nothing.

Extended Events None Found
Nothing to see here, folks

Hmm. I thought maybe it was a latency issue. I waited and re-checked the file. I reran the code. No change. I set it up from the beginning, same thing happened. I drank more coffee.

Then I realized I had probably screwed up my filter.

I had set up a filter on my “Filter (predicate)” tab, but I hadn’t actually told it to collect database_name. I went back in and checked that off.

Whoops, I didn't ask for that!
Whoops, I didn’t ask for that!

Now the session scripts out a bit differently — we’ve got SET collect_database_name=(1) in there:

After recreating the trace with the new definition and saving it off, I re-ran my test script and this time it worked as expected: I got trace data to explore!

Oh, that's interesting.
Oh, that’s interesting.

The Extended Events wizard can be a little rough around the edges. It didn’t warn me that I was doing something problematic. But it also made it pretty easy to set up my trace, and also test my theory about what was wrong with it.

Summing up: when you set up an Extended Events trace, just because you set a filter or predicate on a field doesn’t necessarily mean that it can use the filter. You may have to additionally specify that the field needs to be collected.


Using “OR” and “IN” with SQL Server’s Filtered Indexes

Indexing, SQL Server
4 Comments

You can’t do everything with filtered indexes in SQL Server. For instance, you can’t create the following index:

If you try, you’ll get the error message:

Instead, you can use ‘IN’ and create the index this way:

That works– and good news, even queries written with ‘OR’ can use that filtered index, because SQL Server is clever like that. Here’s an execution plan that shows it in action.

Index found!

The filtered index can also be used for a subset of the VoteTypeIds, too. Here’s an example where I use it just for VoteTypeId = 1. (Note that I had to force it to do it– it preferred a different plan.)

filtered index subset of in list

Takeaway: SQL Server’s filtered indexes can be complicated and limited sometimes, but don’t get too tripped up by the fact that they don’t allow “OR”.


“It’s Slow” Is Not A Metric

Wait Stats
7 Comments

When I start a SQL Server Critical Care with a client, the first thing I ask is, “What is your #1 pain point? Where does it hurt?” The answer I hear most often is, “The server is too slow”.

I’m a runner. If I was able to run a 5K race at an 8:30 per mile pace, I would think I was the fastest runner on earth. The world record for a 5K by a woman is at a 4:34 per mile pace. She would think an 8:30 pace was…slow.

Slow is relative.

Slow is not a metric.

snails-shutterstock_109614335
It’s a race!

In order to effectively measure our systems, we need metrics.This is why baselines for our systems are so essential.

Getting Started with Baselines

The first thing to ask is, “What information do I need to track?” There are a few data points to monitor on any SQL Server: CPU usage, memory usage, number of reads and writes, time spent on reads and writes, wait statistics, and more.

If you have baselines, when a user says, “The system is slow”, you can check your current metrics against your baselines. Has CPU spiked significantly? You can then use a tool like sp_WhoIsActive or sp_BlitzFirst® to find queries using a large amount of CPU. Maybe you can’t find anything in SQL Server – use Resource Monitor to see if there’s an external process in Windows chewing up CPU.

Are reads or writes taking longer than usual? Again, use a tool to see what queries are currently running and how much work they are doing. If you have shared storage, such as a SAN, have a method in place to determine if it’s the SQL Server using the storage, or another system connected to the SAN.

Become familiar with wait statistics. Run samples so you know what your average waits are. If you get a call saying, “It’s slow”, look at a 60-second sample of current waits. If the top three are normally CXPACKET, ASYNC_NETWORK_IO, and PAGEIOLATCH_SH, and now LCK_M_IX is second on the list, dig into your server to see what is holding the locks.

Tools for Baselines

You have many options for collecting and reporting on baselines. You can write your own, or you can invest in a third party tool.

You can create your own tool using a variety of tools:

Data can be saved to a repository database you create, and you can write custom reports to track anything you wish in Reporting Services (or another report tool). Of course, this involves time, effort, and testing. You want to make sure you are tracking the right metrics, storing them correctly, and reporting on them accurately. The level of customization you get is wonderful, but you need to ensure you create an accurate solution.

metrics quote
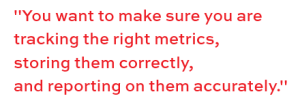
There are many third party tools available for you to monitor SQL Server. The best way to approach selecting one is to write down a list of what you want to track, and make sure the software you pick has those features. Remember things like custom metrics, reports, and alerts! Most tools will offer a free trial; take advantage of that to make sure you’re making the right decision.

Have metrics, not feelings

“Slow” is relative. “Slow” is not a metric. You never know when someone is having a bad day and everything feels slow to him, or he needs to rush out the door early because his kid is sick, or she is getting ready for vacation and time has slowed down in her world. Measure and track. Numbers don’t lie.

Brent says: You get what you measure. The instant you start putting a graph on your cubicle wall, people start paying attention.

Kendra says: User complaints per day is also a metric! Find out what parts of the application people are complaining about and what their experience is specifically. As you work through issues, “Numbers of complaints solved” is a really useful metric for your next performance review.


Measuring Performance Can Slow SQL Server Down

SQL Server
9 Comments

I’ve written a terrible query. It might be the worst query in the world. Sure, there are other queries that may be slower, but this query is terrible and elegantly short.

The query is gloriously bad for a two reasons:

  1. It’s incredibly inefficient in the way it uses a scalar function
  2. Observing the query’s performance can make it much, much slower

Don’t believe me on #2? Let’s take a look!

Here’s the query:

The query uses a restored copy of the StackOverflow database, and the following (terrible) function and related index.

Now, let’s run it and see how long it takes. All my tests are running against a virtual machine on a laptop with 6GB of RAM, SSD storage, and no other activity running. I ran each test a few times and made sure I got consistent results.

SQL Server Dynamic Management Views (DMVs)

The easiest way to measure performance stats for a query using the dynamic management views is to dump the procedure cache, run the query, and then run our free tool, sp_BlitzCache®.

Note that I’m dumping the ENTIRE execution plan cache– I’m running this on a dedicated test instance, so my FREEPROCCACHE can’t harm anyone else.

Here’s the duration and CPU from the output:

blitzcache-results

This gives me a lot of info — my total duration is over 14 seconds. Of that, 9+ seconds were the SELECT statement from inside the scalar function. And by the way, that executed 2.3 million times. WHOA. 2.3 million times? Yep, that’s how bad my query is.

Extended Events (XEvents)

I can easily run an Extended Events trace against my session using our tool, sp_BlitzTrace™ on SQL Server 2012 and higher. Here’s the syntax to do that:

According to the trace, the query’s duration and CPU time are in the same ballpark as we saw before:

sp_BlitzTrace-Output

But I only have one line here– that’s because by default sp_BlitzTrace™ only collects sql_batch_completed and does not collect statement level completion events. You can turn that on, but remember how the dynamic management views told us the scalar function was executed 2.3 million times?

If you capture sp_statement_completed, that means capturing 2.3 million events. Which means your trace starts churning large amounts of data to the file system. And yes, if you collect the statement level stuff, you’ll slow the query down — and besides, querying the trace files is just awful.

I generated these trace files pretty quickly by collecting statement level events for this terrible query.
How to generate 1GB of XEvents trace files with a single SELECT statement… oops!

STATISTICS TIME AND STATISTICS IO

Another very common way to measure query performance is to turn on STATISTICS TIME and STATISTICS IO. I’m lazy, so I usually do these in a single statement, like this:

Here’s how that performed:

statistics-io-time
This performance is consistent across multiple executions. I am not making this up.

Wait just a second– those times were different!

Yep, there’s something weird about these numbers. Let’s sum up the CPU time measurements:

  • Dynamic Management Views via sp_BlitzCache®:~14 seconds
  • XEvents sql_batch_completed via sp_BlitzTrace™: ~14 seconds
  • SET STATISTICS IO, TIME ON: 70 + seconds
  • XEvents sp_statement_completed: gave up after one query generated 1GB of trace data

Dang, this stuff is complicated.

I still like STATISTICS IO and STATISTICS TIME. I do also like sometimes looking at statement level trace data, too! But with any method of measuring performance, I try to be aware that watching what’s going on can impact the results I’m seeing.

This post was inspired by Grant Fritchey’s recent post. If you’ve got your own story about “the observer effect” slowing things down, I’d love to hear it, too!

Brent Says: Whenever I’m there to watch a client’s server, it seems to go faster, and they’re mad because the problem is gone. Hmm.


Dropping an Offline Database in SQL Server

SQL Server
24 Comments

When you drop a database in SQL Server, the files are normally removed from the file system right away. POOF! Hope you had a backup if you ran DROP DATABASE against the wrong instance.

However, things are a little different if you take the database offline before you drop it. Consider the following code:

Here’s what S:\MSSQL\Data looks like after I run the whole script, including DROP DATABASE…

Offline Database Dropped
The files are still there!

This is by design and documented in Books Online — any database with one or more offline files won’t have the files removed from the filesystem when a database is dropped.

Why Take Databases Offline?

Taking databases offline is a very useful process tool. When you’re retiring or migrating a database off of a server, it’s often convenient to make the database unusable for a period before really deleting it. Because sometimes it turns out that a database is in use when we thought it wasn’t.

If you do choose to take databases offline before dropping them:

  • Make sure you have enough copies of the last full backup for your policies
  • Test that the backup restores properly elsewhere and isn’t corrupt
  • When it comes time drop the database, remember that you’ll need to clean up the files manually if you drop it while it’s offline

But whatever you do, don’t skip that backup. The fact that the files aren’t automatically cleaned up doesn’t replace a good backup!

Brent Says: Wow, I didn’t know that.


How Many Databases Can I Put on One SQL Server?

I’ve seen servers with thousands of databases on a single SQL Server, and it works. Sure, opening the databases list in SQL Server Management Studio is painful, and a lot of third party monitoring tools fall over, but it’s not so bad once you know how to work around these issues.

But there’s two issues you can’t work around: our old archenemies, RPO and RTO. A quick reminder:

  • Recovery Point Objective (RPO) – if the server went down right now, where’s the point at which you could recover the data? It’s measured in time, like 1 second of data loss, 1 minute, 1 hour, etc.
  • Recovery Time Objective (RTO) – how long will it take you to get the server back online and functional? It’s also measured in time.

Say you’ve got a single stand-alone SQL Server. You’re doing full backups once a day, and those backups take six hours to complete.

The business comes along and says:

  • You can’t lose more than 15 minutes of data (RPO)
  • The server can’t be down for more than 1 hour (RTO)

In that case, knowing that your backups take six hours, that means your restores are likely going to take at least six hours. If you lose this server (due to hardware failure, storage corruption, Windows patch gone bad, etc), you’re not going to be able to get the databases restored in time.

RPO and RTO Worksheet

You have three options: tune your backups and restores to make them go faster, put less data on each SQL Server, or implement a standby server that’s ready to go when disaster strikes.

The real answer to how many databases (and how much data) you can put into SQL Server isn’t a software limitation: it’s a business limitation. Get the RPO and RTO from the business first, put it into our HA/DR planning worksheet, and that will help you figure out if you’ll be able to recover in time.

Kendra says: If you’re asking this question, that’s your first sign that you may have a problem.


The Hard Truth About Patching SQL Server Availability Groups (Hotfixes, Cumulative Updates, and Service Packs)

Whoa, be careful with that fix

As a DBA, you’re responsible for identifying necessary updates to keep your SQL Servers healthy. Your business may have some mandates about the frequency of patches, but even if they don’t, you have a duty to look out for Cumulative Updates, Service Packs, and out of band hotfixes that can prevent downtime and prevent performance problems. It’s your task to test and apply them as needed.

If you use SQL Server Availability Groups (AGs), this is a tough responsibility. There are a lot of updates released for critical issues. And sometimes there are updates to the updates, because…. oops. And sometimes the updates may cause you downtime.

Here’s the lose-lose situation that the Availability Group DBA ends up in:

  • If you don’t apply updates, you could hit a critical performance issue that brings down your environment which was fixed in an existing cumulative update or hotfix. An update you should have known about.
  • If you apply updates regularly, you can cause yourself downtime by issues introduced in the updates. And here’s the worst part: testing reduces your risk of this, but doesn’t prevent it.

You can’t just ignore the situation. After all, you’re responsible.

High Availability is Supposed to Reduce Downtime– Including Downtime for Patching

One of the big reasons DBAs like High Availability solutions is that we want to reduce downtime during patching. If you’ve ever done much patching, you know that it can take a while to restart servers sometimes. Sometimes the server hangs on restart and you may have to connect to a special server management card to nudge it along. (iLo, DRAC, etc.)

If you’re using Database Mirroring, a Failover Cluster, or Availability Groups, you can reduce downtime in patching: you can fail your SQL Server resources around so that there are only short downtimes and your customers aren’t dependent on the server to come back. You want these features so you have less to worry about, not more.

PATCHING an Availability Group Can Cause Unplanned Downtime

Check out this recent critical problem impacting multiple cumulative updates across SQL Server 2012 and 2014. If you apply these updates, you may run into a critical blocking issue which you can only fix by:

  • Turning off automatic failover
  • Restarting the SQL Server instance on the primary replica. Yep, that’s an outage.
  • Turning on automatic failover

Update: KB 3033492 has now been published which gives more information on options to avoid the issue (spoiler: it requires an outage), or other ways you can attempt to correct it by killing sessions (which may not work).

You might wonder, “How many people could this have impacted?” I wondered too. The night I learned about this issue, I went to my local user group meeting and heard that a person there had been impacted by the bug. They said their production environment was down for more than 9 hours while they worked with Microsoft to resolve the issue.

Which of These Downtime Scenarios is Worse?

Pick your poison. And it will feel like poison. Is it worse to:

A) Be an unlucky optimist. Follow the steps in the KB. Hope that you detect the problem during your patching window if it occurs. There’s a chance that the issue might be detected after your planned patching window has ended (and you’ve gone back to sleep), and then you’ve got an unplanned downtime on your hand and unhappy customers.

B) Be a beleaguered pessimist. Proactively take the steps above when applying patches to prevent the bug from occurring. This is more work for you, more steps for you to carry out and validate (you did put that back in automatic failover, right?), and more outages for your customer. You’re now not just failing back and forth between nodes, you’re doing an extra restart. And restarting the instance underneath the primary replica with no failover is exactly the type of thing we expect High Availability to save us from.

This Couldn’t Happen Again, Right?

Remember SQL Server 2012 SP1? It had an issue that impacted some installs where processes named msiexec.exe would keep running and use tons of CPU. It bloated out the registry. It was pretty nasty, and it raised the issue, “Should you trust Service Packs?” (Spoiler: no.)

That issue wasn’t specific to AGs. But we now have a pattern where supported, released updates (even service packs) can cause major problems on a portion of installs and they are released anyway. Odds are, it will happen again.

But Microsoft Said I Should Only Install Cumulative Updates if I Need Them, Right?

Yep– that’s what they used to say. It was dangerous advice to follow, because Service Packs are released very slowly these days.

But this changed with KB 2964518 – “Recommended updates and configuration options for SQL Server 2012 and SQL Server 2014 used with high-performance workloads.” This article specifically recommends using the latest cumulative update, and gives a dramatic list of issues fixed in those updates.

Cumulative Updates ARE Especially Critical for AGs. Look at these Fixes…

It’s possible you might still be thinking that it’s safer to just not patch an availability group and hope for the best. That’s not a good idea. Take a look at these fixes:

I know that some folks are going to ask for a comprehensive bug list specific to AGs. I’m afraid I don’t have time to maintain that list– and that is kinda telling.

Nobody likes it when the doctor makes this face.

So What Should You Do?

How much time and effort do you have for reading about fixes, testing them carefully, watching blogs for out of release fixes and known issues, and establishing complex patching and production processes?

If you don’t have at least an hour a week to keep on top of available fixes, and another eight hours a month (minimum) to devote to testing and deploying fixes, you don’t have time for an AG.

Got more than two replicas? You need more time. Running Windows Server 2008R2? Well you need a lot more time, because you should be moving out of there.

It was hard for me to write this post. I’ve met some of the folks who make SQL Server. They’re incredibly smart, very dedicated, super helpful, and they work very hard to make a great product. But right now Availability Groups are a very complex and time consuming feature to manage — and many teams don’t have the right staffing and time to take on that challenge and succeed.

Brent Says: I have a hunch that maybe Kendra was a little angry when she wrote this, but even so, I’m glad I’m a consultant these days and not a full time DBA. Patching blows.


Failing over an Asynchronous Mirror in SQL Server (video)

Database Mirroring
5 Comments

Will a long running open transaction block you from changing to synchronous mode and failing over to your SQL Server database mirror? Join Kendra to test performing a planned failover from an asynchronous database mirror.

http://youtu.be/5rAr2Gns1mU

Brent Says: Often, when I’m working with developers, they’re totally surprised that SQL Server’s failover methods all break in-flight transactions. No matter whether you use mirroring, AlwaysOn Availability Groups, or failover clustering, you’ve gotta build in retry logic in your applications if you want seamless failovers.


Announcing Row-Level Security in Azure SQL Database

Microsoft Azure, SQL Server
12 Comments

Your users probably shouldn’t be able to view all of the data.

You might have regional sales managers who should only see sales for their region, or human resource staff who should be able to see employee details but not salaries.

This is usually challenging with databases.

How We’ve Historically Built Row-Level Security in SQL Server

We modify application code to pass in the user’s name or group name as part of their query, like this:

SELECT * FROM dbo.vwSalesHeader WHERE SalesVisibleTo = ‘MaryJane’

MaryJane doesn’t have to be a Windows or SQL authentication account – it can be anything we want to use as a security identifier. Some apps use a UserID number from their Users table, for example.

Photo: Locked Up Love by Tit Bona?

Then the vwSalesHeader view joins our SalesHeader table out to several other security tables where user names or roles are listed. The SalesHeader table might have a StoreID field, and then we’d have other tables that listed which users could see which StoreIDs.

This approach typically works well (enough) in reporting applications where we can guarantee all access is done through views. However, it isn’t as effective when users and applications are accessing the tables directly – and that’s where the database server needs to handle row-level security.

Serious Security: Enforcing It at the Server Level

If you create database logins for every end user, and the end user is authenticated in the database, then some database platforms can perform row-level security directly against tables.

The really cool part of this approach is that you don’t need to modify your applications – the apps don’t have to access the data via stored procedures or views in order to get row-level security. If you try to read or modify a row (or in some cases, even a column) that you’re not allowed to, the database simply stops you.

PostgreSQL added support for this via Row Security Policies recently in 9.5, and Oracle’s had Oracle Label Security since at least 10g. In all vendor implementations, the database needs a map between users, roles, tables, and rows. PostgreSQL does this with row security policies that let you build any query you want as the check expression. Oracle builds hierarchical security in at the data label level with compartments and groups. Both are radically different approaches, so there’s not really a concern about how Microsoft’s implementation adheres to standards.

How Azure SQL Database Does It

Books Online explains that the v12 preview will let you:

  1. Create a security predicate function to do the security check
  2. Create a security policy on a table that points to your new security function
  3. Enforce that security policy based on whoever’s logged in – without changing their queries

That’s awesome. Instead of this:

SELECT * FROM dbo.vwSalesHeader WHERE SalesVisibleTo = ‘MaryJane’

Your apps can just select from the table directly (or views still if they want):

SELECT * FROM dbo.SalesHeader

And SQL automatically applies the security policy.

That’s my favorite kind of new feature – one that can be introduced without app changes. It’s absolutely wonderful if you’re letting end users connect directly to the database with PowerBI tools like Excel.

I’m not going to write about the full implementation T-SQL here (function and policy creation) because we’re still ahead of the release date, and you can expect these details to change through the course of the release previews.

Server-Level Security Drawbacks

Most modern web and reporting applications use connection pooling with a single database login for all users, and no concern for “execute as user” statements. It’s challenging to run every query in the security context of the end user – especially if you have end users who aren’t in your actual security system. (Think public end users who don’t have Active Directory accounts.) The number of connections from your web/app tier may skyrocket, although most of those connections will end up being idle or disconnected over time. The alternative is to build in dynamic “execute as user” statements in your data access logic, and that’s nowhere near as trivial as it looks.

Plus, enforcing security at the database server level requires adding a security definition field to every secured table. If you’re not allowed to modify the tables, this approach won’t work. I don’t see this as a serious drawback because it’s still less work than modifying your application to work entirely on views and stored procedures.

Performance will suffer no matter how you implement row-level security. In the big picture, I don’t see this as a drawback because you shouldn’t implement it unless you need it, and if you need it, you should be willing to amp up your hardware requirements in order to pay for the additional business logic requirements. There’s no free lunch.

Silent security generates support calls. Anytime the users know that the system is influencing their query results (be it through Resource Governor, dirty reads, simultaneous loads & queries, or row-level security) then they’re going to think their reporting data is wrong/slow/unavailable because your infrastructure is at fault. If this is a concern for you, you can enable auditing of the security policies, but keep in mind that now you’re talking about even more performance impact.

And of course, there’s the obvious gotcha of having to create database users for these roles. In a perfect on-premise world, you don’t really want to create those in SQL Server – instead, you create groups in Active Directory and then in SQL Server. Let your help desk team manage the group memberships of individual users, and only rarely make changes to the groups in SQL Server. (But still, if you’re constantly adding/editing sales regions, and your queries need to be region-aware, you’re going to be constantly making security changes in production, QA, and dev servers.)

In summary, I think row-level security is one of the coolest new engine features I’ve seen in quite a while, and it’s in Azure SQL Database first. It solves a real business pain, and continues to bring Microsoft’s databases closer to feature parity with Oracle and PostgreSQL.


Three reasons to use Extended Events

SQL Server
19 Comments

I have a new mission: to convince you, the long-time Profiler user, to switch to Extended Events. I realize I have a long, difficult task ahead of me. Profiler has been around for a long time. You’re comfortable with it. You know it’s not perfect, but you have learned to live with its imperfections. Now I want you to step outside your comfort zone and learn a new tool, with new terminology, a new interface and new capabilities.

I’m going to start with a few reasons for you to consider Extended Events. I want you to think about these things, and if they could make your job easier.

1. The number of events in Profiler has remained the same since SQL Server 2008. The number of events in Extended Events (XE) has more than tripled.

Number of events

What kind of events are being added to XE, but not Profiler? Events for any new features, such as Availability Groups, In-Memory OLTP, and Windows Azure Storage. You can query sys.trace_events to see which events are available for Profiler, and sys.dm_xe_objects to see the events for XE.

If I am using XE and have an Availability Group, I can track availability_replica_state_change to see what the replica’s previous state and current state are – such as when a replica goes from a secondary to primary. If using SQL Server 2014’s buffer pool extensions, I can count how many times pages are read, using buffer_pool_extension_pages_read, or when they are removed, using buffer_pool_extension_pages_evicted. Even without any special features, XE lets me dig deeper into what SQL Server is doing. I can track async_io_requested and async_io_completed events, which I can’t do with Profiler. You can count page_split as it’s happening, to see if that’s causing a performance problem. XE has many, many events!

2. XE gives you multiple options to save and view the data. With Profiler, you can view the action live on-screen, and risk bringing the server down, or you can save it to a trc file and view it after the fact. XE allows you to choose one or more targets for each session, and they allow a lot of flexibility.

You can “View Live Data” and watch the events you’ve selected scroll across the screen (although I still wouldn’t recommend this approach). You can save your events to a file on disk, then review them later. You can also collect data in ways Profiler didn’t allow. For example, using the event_counter target allows you count the instances of an event happening – while it’s happening, no going back and having to aggregate after the fact. The histogram target is similar, but allows you to put the event in groups – again, as it’s happening, not later. You can also use the pair_matching target to find related events that match.

histogram
A sample of the histogram, capturing the number of SELECT statements executed per database.


3. XE sessions are easily scriptable & portable. Yes, you could script out a Profiler session. Does this really make sense to you?

Do you know what @TraceId, 15, 10, @on means?

An XE script is simple to read and understand. I can create this once and deploy it to any server.

I can clearly tell I'm capturing sp_statement_completed and sql_statement_completed events.
I can clearly tell I’m capturing sp_statement_completed and sql_statement_completed events.

It’s time to consider moving away from Profiler and using Extended Events. In a future release of SQL Server, Profiler will be gone – so learn more about Extended Events starting today!


Reporting From a Log Shipping Secondary in STANDBY mode

Log Shipping, SQL Server
65 Comments
You can build a lot with simple tools. Carefully.

I’m a fan of SQL Server’s transaction log shipping. It works in Standard Edition, it’s relatively simple to set up, and you can even make your log shipping secondary readable using STANDBY mode.

I’ve worked with some pretty cool, complex log shipping environments over the years. In one case, we had multiple log shipping secondaries and a load balancer involved to support a full fledged reporting application. It worked pretty well– with a lot of careful scripting and support.

But there’s a few things you should know before you decide to implement this yourself.

“Readable” Log Shipping Secondaries Are Just a Point in Time

Although a log shipping secondary can be made readable using “STANDBY” mode, it’s just readable to a specific point in time. If I bring the secondary online at 2 pm, users can only read data through the last committed transaction in the last log file I restored. And…

Everyone’s Kicked Out When You Restore Transaction Logs

The database can’t be read when you’re refreshing data. You must kick out any users (or not refresh the data).

Logs Restore More Slowly if You Use STANDBY (Readable) Mode

If you’re reading from the secondary, you usually want those periods where it’s unavailable to be as short as possible. If you have a lot of log files to restore, you will probably find that performance of the restores is better if you’re in “NORECOVERY” mode while you’re doing the restores, and then switch back to “STANDBY” at the end of the process so the data can be read.

This can be done, it just can take some fancy scripting.

You will also need to add monitoring for slow restores if getting the database online is critical. If your log shipping secondaries get behind, it’s possible to use differential backups to catch them up.

You can’t use “STANDBY” Mode if your Secondary is a Higher Version

I was a little sad when I learned this one years ago. I had a SQL Server 2005 instance that was the log shipping primary. The log shipping secondary was made readable so that developers could check out production data if needed without having access to production.

Our upgrade plan was to get SQL Server 2008 on the least critical servers first — and that developer access server was one of them. But I couldn’t use STANDBY mode on the log shipping secondary with it as a higher version: it failed with an error like this…

When SQL Server brings a database online in a higher version, it needs to make some modifications to that database. This breaks with STANDBY mode because the database is read only.

An aside: unfortunately, the Enterprise Edition feature of a database snapshot doesn’t overcome this limitation if you try to use it against a database mirror to make it readable to a point in time. You get a different error, but it’s the same theme:

Auto-Create Statistics Doesn’t Work in the User Database in STANDBY mode

If you’re using your log shipping secondary for reporting, SQL Server can’t automatically create statistics in the database, regardless of your settings. (That read only thing keeps coming up.)

In SQL Server 2012 and higher, this isn’t a huge problem because temporary statistics can get created in tempdb. This new feature was added when Availability Groups came along, but it also works for log shipping secondaries, which is pretty awesome.

Security is a Hoot. And by that, I Mean a Problem. (Less So in SQL Server 2014)

In many scenarios, you only want to grant read access to a user on the log shipping secondary database. You do not want that user to be able to access the primary. This is tricky.

To read from a database, you need a login with an associated database user. To grant reads to a log shipping secondary database, you can create all the logins you want– but the log shipping secondary database is read only, so you can’t create a user in it.

Up through SQL Server 2012, here’s the two main options I’ve seen people use (there are a couple more in the comments):

  1. Grant access via stored procedures or views in another database. This will require enabling cross database ownership chaining, which can be a treacherous security road. And a lot of things could go wrong over time as tables are added, modified, and dropped.
  2. Create the login on the log shipping primary instance with the associated database user, and disable the login on the log shipping primary instance. If you’re using SQL authentication, you may have to use a special script to transfer the SID to the log shipping secondary to get it all to work.

Option 2 isn’t terrible, it’s just awkward to have a bunch of disabled logins. Someone can misunderstand and accidentally enable them or delete them, and then… oops.

Using CONNECT ANY DATABASE and SELECT ALL USER SECURABLES IN SQL SERVER 2014

As of SQL Server 2014, you have a new option because of a couple of new security features. You can do this:

When you add a member to this role, they can read anything. I tested and this worked for me against a logshipping secondary in standby mode just fine.

CONNECT ANY DATABASE is designed to allow access to connect to databases that exist now and databases that exist in the future, so this really IS permissions to read everything, including system databases– only use this if that’s appropriate.

It’s Complicated, but It’s Still Cool

If you’re clever and dedicated, you can work around these issues and use log shipping to provide read access to either applications or users who shouldn’t be reading from the live production copy of data.

Brent Says: Even with AlwaysOn AGs out, I think I’ve said the words “use log shipping” more in the last two years than I’ve said in the rest of my career. It’s useful, cheap, flexible, and nearly bulletproof.


Are You Getting the Benefits of Virtualization?

Here’s some of the reasons companies usually virtualize their SQL Servers:

  1. Cost savings on hardware
  2. Cost savings on Windows OS licensing
  3. Cost savings on SQL Server licensing
  4. Protect against the failure of a single hardware element
  5. Leverage extended features for Disaster Recovery
  6. Automatic load balancing across multiple hosts
  7. Easier hardware replacement/migration

When we perform a SQL Critical Care® on a virtualized SQL Server, we often ask, “Are we actually getting those benefits?”

1. Cost savings on hardware – do you find yourself putting one SQL Server guest on each host, isolating them to make sure they get the performance they need? If so, you’re not actually saving money on hardware.

2. Cost savings on Windows OS licensing – as a standard, some companies license all their virtualization hosts with Windows Server Datacenter Edition in order to get unlimited virtualization rights. However, if you’re only running one guest per host (or just a few), then you’re not saving money here either.

3. Cost savings on SQL Server licensing – for this one, you’ve gotta do a little bit harder work. Add up the licensing you’re spending now, and look at what it would take to run similar instances on bare metal hardware. Keep in mind that you can still buy dual-socket, quad-core servers that are insanely powerful (768GB RAM, dozens of SSDs), thereby keeping your SQL licensing lower.

We're going to need your parents to sign your report card.
We’re going to need your parents to sign your report card.

4. Protect against the failure of a single hardware element – on the free versions of most hypervisors, you don’t get automatic failover protection. You can manually start up a guest on another host with some human intervention. Is that enough for the business, or are they assuming it’ll all happen automatically with only a minute or two of downtime – even when you’re not around? Or even worse, do you not have enough hardware horsepower to start up your biggest SQL Server guest somewhere else if its host fails? Or, heaven forbid, are you using local SSDs with virtualization, thereby missing the entire ability to move guests around?

5. Leverage extended features for Disaster Recovery – VMware and Hyper-V have killer features (and third-party app extensions) that make it easy to replicate a guest from one site to another. Are you using those, or have you given up because SQL Server’s data change rates are too high, and your network can’t keep up?

6. Automatic load balancing across multiple hosts – VMware’s Distributed Resource Scheduler (DRS) will automatically shuffle VMs around between hosts based on resource utilization. It’s an amazing way to react to performance issues with less human intervention. You should be using it.

7. Easier hardware replacement/migration – because SQL Server licensing is priced by the CPU core, and it’s super expensive, many shops choose to improve their virtualization host hardware annually. Whenever they need more capacity in their VMware or Hyper-V clusters, they drop in a couple of new hosts, vMotion or LiveMigrate the most expensive per-core guests over to those hosts (thereby taking advantage of today’s faster processors), and then give everybody else the hand-me-downs. It’s easy to do even live during the daytime. However, some shops are still running their SQL Servers on CPUs that might get featured on Antiques Roadshow.

If you’re not leveraging at least some of these virtualization features, and you don’t plan to…then what was the point of virtualizing to begin with? Jump on in – the water’s fine!


Managing Oracle Performance with Statistics

Oracle
4 Comments

Oracle maintains statistics about data stored on disk. The statistics and histograms help guide the optimizer during query plan compilation. These statistics are usually helpful. Sometimes the statistics are not helpful.

As data changes, the statistics collected by Oracle may become less accurate. If I’ve created a histogram on the column transaction_date, my histogram won’t know about data that’s been added since the histogram was last created or updated. Over time, that histogram becomes less helpful. DBAs can update statistics, but another problem can arise – the new statistics might be worse than the old statistics. DBAs need tools to manage stats and verify success before moving new statistics into production.

Historical Statistics

Oracle gives DBAs a powerful tool in managing statistics – historical statistics retention. By retaining historical copies of statistics, a DBA can ensure that there’s always a plan to back out changes that have caused a performance problem. You can view the current historical retention period by running:

On my Oracle 12c install (12.1.0.2), the retention period is set to 31 days. Larger systems may want to set up smaller retention periods.

Changing the statistics retention is as easy as running:

Once you have identified the statistics that you want to restore, you can put them back in place using DBMS_STATS.RESTORE_TABLE_STATS:

Of course, you would need to know when statistics were last collected. Thankfully, you can review when statistics were collected with the DBA_TAB_STATS_HISTORY view.

Keep in mind that the historical statistics have to go somewhere. Monitor the size of the SYSAUX tablespace and adjust the retention period as needed. You may find that you don’t need all of those historical statistics.

Locking Statistics

Once you’ve found the good statistics, you probably don’t want to keep restoring them over and over again. The next step you can take is to lock the statistics in place. Statistics can be locked at the schema, table, or partition level. Once an object has been locked, anything depending on that object will be skipped during system wide statistics updates.

Locking the statistics on a table is as easy as:

If there were an index on the CUSTOMERS table that needed a statistics update, we can force Oracle to update statistics using the force flag:

By locking some stats in place, we can make sure that important queries don’t slip off a good plan. Using dbms_stats.restore_table_stats makes it possible to restore known good stats. There has to be a way to know if your statistics are going to be a problem before you move them into production, right?

Pending Statistics

Some tables are more volatile than others. When data changes and statistics are re-analyzed it may be possible that data is sampled in a way that can cause problems. This is why we have the ability to lock statistics. In some cases, you may want to test changes to statistics before they go into production, rather than locking statistics in place or rolling back to your last known good statistics. In this case, you can create pending statistics.

To create pending statistics, the first step is to disable publishing statistics for a table:

Once publish is set to false, newly gathered statistics wiill be placed in a holding area rather than being immediately made available for use by Oracle. At this point, the statistics are present, but unusable. Pending statistics can be used by changing the optimizer_use_pending_statistics variable to TRUE.

Once it’s been determined that stats are good, they can be be published. DBAs have the option to publish all stats or just stats for a single table:

Or, if the statistics stink, you can delete them with the dbms_stats.delete_pending_stats procedure.

Exporting Statistics

There’s one other tool DBAs have for managing stats – exporting statistics. After creating a stats table using dbms_stats.create_stat_table, a DBA can export statistics using on of severalEXPORT_*_STATS stored procedures. Statistics can be exported for columns, indexes, schemas, and tables as well as several other database and system level statistics.

The EXPORT_*_STATS procedures will push data into the statistics table and that data can be exported to another Oracle system where an IMPORT_*_STATS procedure can be used to import stats to the other Oracle system. This can be important for development, testing, and staging environments where it may not be possible to restore a large volume of data, but developers need to assess how queries will run in the production environment.

Statistics Maintenance Doesn’t Have to be a Drag

DBAs have powerful tools in Oracle to make sure statistics don’t cause performance problems. By combining these tools, it’s possible to create a stable set of statistics that lead to predictable performance. To learn more about managing Oracle database statistics, head over to the Managing Optimizer Statistics: Basic Topics or refer to the DBMS_STATS documentation for reference material.


Urgent AlwaysOn Availability Groups Bug

If you’re using AGs, don’t apply these patches:

  • SQL 2012 SP2 CU3
  • SQL 2012 SP2 CU4
  • SQL 2014 CU5

until you read this Microsoft post about a breaking bug.

Your AG may stop synchronizing due to blocking between user queries and a system session. The fix is to disable automatic failover, restart the primary, and enable automatic failover again.

Carry on.


How to Query Extended Events Target XML

SQL Server
26 Comments

When Extended Events (XE) were released with SQL Server 2008, I was excited – something new to learn! I read Microsoft articles about them, read blog posts about them, and tried to use them. At that time, there was no GUI for XE. I had to create the sessions with T-SQL. That wasn’t awful – I learned the syntax after some trial and error, and could start and stop sessions. There was also no GUI to view the saved data – and it was all saved as XML.

I ran headfirst into a brick wall.
This is the wall I ran into.

I gave up when faced with XML. When SQL Server 2008R2 came out, I once again looked at XE. With no GUI for creating or viewing data, I retreated in defeat again. With SQL Server 2012 came the GUI – a new session wizard, a new session dialog box, the (not-recommended) ability to view live data, and the ability to see the information you collected. But that didn’t solve the root problem for me – all the good data, all the results I wanted to view, aggregate, and slice and dice, were still in XML.

So, I learned to query XML with T-SQL. It hasn’t been easy for me to understand. But, by breaking it down into small steps I was able to conquer it. If querying XML has been the reason you’ve been avoiding XE, I’m here to help you get past it!

Create a session

I’m going to create a session that collects wait statistics and puts them in the Ring Buffer target, then run a small workload to capture waits.

I used the default query from Books Online to view the data. This is not helpful!

ring buffer default query

Even if I click the target_data column (which I can do!), I just get a page of XML I have to read through. Yuck!

ring buffer XML

Querying XML

So, how do I make this data understandable, so I can count the number of each wait type that happened? We want to get the XML into a format we can use. I’m going to start by inserting the data into a temp table and selecting it.

This gives us the same link to a page of XML. What we can do now that that data is in a temp table, though, is “shred” the XML. XML is just nodes of data. You only need to understand the hierarchy of the nodes to query it.

Let’s look at this XML. I can see there is one element, event name=”wait_info” (highlighted in green) that I want to dig into. Under that, I want to get the “wait_type”, “duration”, and “signal_duration” (highlighted in yellow) attributes.

xml nodes i want to see

To do so, I use the T-SQL XML value function to pull out wait_type, like so.

Once I understand how to use the value function, I can do the same for other data I want to see.

I can read this!
I can read this!

Level up: Aggregating data

For this XE session (and wait statistics in general), having every wait listed out isn’t helpful. I want to aggregate the data so I can see which wait occurred the most frequently. What happens when I try to aggregate this query?

I get an error.
I get an error.

I have to take a different approach. I’m going to use a derived table. I will put my initial query to select the data from the temp table into the FROM clause, then aggregate on the results.

I have usable data!

This is one sleepy system.

Last but not least, I’ll clean up after myself.

Querying the XML output from Extended Events sessions is easy if you take it step-by-step. When you are looking at the raw XML, establish what elements you want to extract. (These will vary by the events you choose to capture.) Move the data into a temp table you can work with. Use the XML value function to extract one element at a time, until you have the data you need. At last, if you need or want to, you can aggregate.

Don’t let XML be the reason you won’t use Extended Events – it isn’t for me any longer!

Want to learn more about Extended Events? Start here!