Blog

Managing Oracle Performance with Statistics

Oracle
4 Comments

Oracle maintains statistics about data stored on disk. The statistics and histograms help guide the optimizer during query plan compilation. These statistics are usually helpful. Sometimes the statistics are not helpful.

As data changes, the statistics collected by Oracle may become less accurate. If I’ve created a histogram on the column transaction_date, my histogram won’t know about data that’s been added since the histogram was last created or updated. Over time, that histogram becomes less helpful. DBAs can update statistics, but another problem can arise – the new statistics might be worse than the old statistics. DBAs need tools to manage stats and verify success before moving new statistics into production.

Historical Statistics

Oracle gives DBAs a powerful tool in managing statistics – historical statistics retention. By retaining historical copies of statistics, a DBA can ensure that there’s always a plan to back out changes that have caused a performance problem. You can view the current historical retention period by running:

On my Oracle 12c install (12.1.0.2), the retention period is set to 31 days. Larger systems may want to set up smaller retention periods.

Changing the statistics retention is as easy as running:

Once you have identified the statistics that you want to restore, you can put them back in place using DBMS_STATS.RESTORE_TABLE_STATS:

Of course, you would need to know when statistics were last collected. Thankfully, you can review when statistics were collected with the DBA_TAB_STATS_HISTORY view.

Keep in mind that the historical statistics have to go somewhere. Monitor the size of the SYSAUX tablespace and adjust the retention period as needed. You may find that you don’t need all of those historical statistics.

Locking Statistics

Once you’ve found the good statistics, you probably don’t want to keep restoring them over and over again. The next step you can take is to lock the statistics in place. Statistics can be locked at the schema, table, or partition level. Once an object has been locked, anything depending on that object will be skipped during system wide statistics updates.

Locking the statistics on a table is as easy as:

If there were an index on the CUSTOMERS table that needed a statistics update, we can force Oracle to update statistics using the force flag:

By locking some stats in place, we can make sure that important queries don’t slip off a good plan. Using dbms_stats.restore_table_stats makes it possible to restore known good stats. There has to be a way to know if your statistics are going to be a problem before you move them into production, right?

Pending Statistics

Some tables are more volatile than others. When data changes and statistics are re-analyzed it may be possible that data is sampled in a way that can cause problems. This is why we have the ability to lock statistics. In some cases, you may want to test changes to statistics before they go into production, rather than locking statistics in place or rolling back to your last known good statistics. In this case, you can create pending statistics.

To create pending statistics, the first step is to disable publishing statistics for a table:

Once publish is set to false, newly gathered statistics wiill be placed in a holding area rather than being immediately made available for use by Oracle. At this point, the statistics are present, but unusable. Pending statistics can be used by changing the optimizer_use_pending_statistics variable to TRUE.

Once it’s been determined that stats are good, they can be be published. DBAs have the option to publish all stats or just stats for a single table:

Or, if the statistics stink, you can delete them with the dbms_stats.delete_pending_stats procedure.

Exporting Statistics

There’s one other tool DBAs have for managing stats – exporting statistics. After creating a stats table using dbms_stats.create_stat_table, a DBA can export statistics using on of severalEXPORT_*_STATS stored procedures. Statistics can be exported for columns, indexes, schemas, and tables as well as several other database and system level statistics.

The EXPORT_*_STATS procedures will push data into the statistics table and that data can be exported to another Oracle system where an IMPORT_*_STATS procedure can be used to import stats to the other Oracle system. This can be important for development, testing, and staging environments where it may not be possible to restore a large volume of data, but developers need to assess how queries will run in the production environment.

Statistics Maintenance Doesn’t Have to be a Drag

DBAs have powerful tools in Oracle to make sure statistics don’t cause performance problems. By combining these tools, it’s possible to create a stable set of statistics that lead to predictable performance. To learn more about managing Oracle database statistics, head over to the Managing Optimizer Statistics: Basic Topics or refer to the DBMS_STATS documentation for reference material.


Urgent AlwaysOn Availability Groups Bug

If you’re using AGs, don’t apply these patches:

  • SQL 2012 SP2 CU3
  • SQL 2012 SP2 CU4
  • SQL 2014 CU5

until you read this Microsoft post about a breaking bug.

Your AG may stop synchronizing due to blocking between user queries and a system session. The fix is to disable automatic failover, restart the primary, and enable automatic failover again.

Carry on.


How to Query Extended Events Target XML

SQL Server
26 Comments

When Extended Events (XE) were released with SQL Server 2008, I was excited – something new to learn! I read Microsoft articles about them, read blog posts about them, and tried to use them. At that time, there was no GUI for XE. I had to create the sessions with T-SQL. That wasn’t awful – I learned the syntax after some trial and error, and could start and stop sessions. There was also no GUI to view the saved data – and it was all saved as XML.

I ran headfirst into a brick wall.
This is the wall I ran into.

I gave up when faced with XML. When SQL Server 2008R2 came out, I once again looked at XE. With no GUI for creating or viewing data, I retreated in defeat again. With SQL Server 2012 came the GUI – a new session wizard, a new session dialog box, the (not-recommended) ability to view live data, and the ability to see the information you collected. But that didn’t solve the root problem for me – all the good data, all the results I wanted to view, aggregate, and slice and dice, were still in XML.

So, I learned to query XML with T-SQL. It hasn’t been easy for me to understand. But, by breaking it down into small steps I was able to conquer it. If querying XML has been the reason you’ve been avoiding XE, I’m here to help you get past it!

Create a session

I’m going to create a session that collects wait statistics and puts them in the Ring Buffer target, then run a small workload to capture waits.

I used the default query from Books Online to view the data. This is not helpful!

ring buffer default query

Even if I click the target_data column (which I can do!), I just get a page of XML I have to read through. Yuck!

ring buffer XML

Querying XML

So, how do I make this data understandable, so I can count the number of each wait type that happened? We want to get the XML into a format we can use. I’m going to start by inserting the data into a temp table and selecting it.

This gives us the same link to a page of XML. What we can do now that that data is in a temp table, though, is “shred” the XML. XML is just nodes of data. You only need to understand the hierarchy of the nodes to query it.

Let’s look at this XML. I can see there is one element, event name=”wait_info” (highlighted in green) that I want to dig into. Under that, I want to get the “wait_type”, “duration”, and “signal_duration” (highlighted in yellow) attributes.

xml nodes i want to see

To do so, I use the T-SQL XML value function to pull out wait_type, like so.

Once I understand how to use the value function, I can do the same for other data I want to see.

I can read this!
I can read this!

Level up: Aggregating data

For this XE session (and wait statistics in general), having every wait listed out isn’t helpful. I want to aggregate the data so I can see which wait occurred the most frequently. What happens when I try to aggregate this query?

I get an error.
I get an error.

I have to take a different approach. I’m going to use a derived table. I will put my initial query to select the data from the temp table into the FROM clause, then aggregate on the results.

I have usable data!

This is one sleepy system.

Last but not least, I’ll clean up after myself.

Querying the XML output from Extended Events sessions is easy if you take it step-by-step. When you are looking at the raw XML, establish what elements you want to extract. (These will vary by the events you choose to capture.) Move the data into a temp table you can work with. Use the XML value function to extract one element at a time, until you have the data you need. At last, if you need or want to, you can aggregate.

Don’t let XML be the reason you won’t use Extended Events – it isn’t for me any longer!

Want to learn more about Extended Events? Start here! 


How to Use SQL Server’s Dedicated Admin Connection (DAC) – Video

SQL Server
11 Comments

You may have heard that there’s a secret back door into your SQL Server– but have you enabled access to it properly? Do you know when you might need to use it, and how you can connect? Kendra Little explains why the Dedicated Admin Connection (or “DAC”) is so important and how to configure remote access.

Don’t have 11 minutes / don’t have YouTube access? Head on over to our blog post on the DAC.

https://www.youtube.com/watch?v=GEIQcuN52I4

Jeremiah says: I had to use this once. I ran into a low memory situation on a SQL Server and Windows decided to page out SQL Server in the middle of the business day. The system ground to a halt, it was even unresponsive over RDP, and we had to hard power cycle the server (hold down the power button in the server room). I set up the DAC and the next time the issue happened, I was able to jump into the SQL Server, collect information, and then issue a graceful shutdown. This made it easier to diagnose the problem, too.

Brent says: Using the DAC is like knowing how to read the basics of DBCC CHECKDB output. You’re probably never going to need it, but when you do, just ten minutes of preparation will make a world of difference.

Jes says: What Brent said. A few minutes of practice every six months can save minutes or even hours of frustration – and potentially downtime – when faced with a real emergency.


The Basics of Oracle Statistics

Oracle
2 Comments

Databases uses statistics about data to determine the best way to query tables. Should the database seek or scan? How many rows will be returned from tables that are being joined? Oracle is no exception, but the way Oracle treats statistics is different from SQL Server.

Oracle Statistics Collection

Just like SQL Server, Oracle can collect statistics manually. Unlike SQL Server, Oracle includes an automatic statistics collection job.

The Oracle automatic stats collection job is scheduled to run, by default, during configured maintenance windows. These maintenance windows are configured for each Oracle database that you’re running. This gives the people who know the data best, the DBAs, a chance to schedule statistics collection whenever it’s needed and whenever it won’t cause problems for production workloads.

Oracle also supplies manual stats gathering at the index, table, schema, or even database level through the DBMS_STATS package:

The statistics gathering utilities have a wealth of options available that allow DBAs to choose to only rebuild existing stats, change the number of buckets in the histogram, choose sample percent, and control how new statistics are generated.

Controlling Statistics Collection

How much control do you have about how statistics are collected in SQL Server? Your options are basically: automatic generation is on or off, automatic updates are on or off, and the time your statistics collection job is allowed to run.

There are a number of options that are available in Oracle for determining how statistics are collected. The options exist at multiple levels – from the entire database down to a single table. This allows DBAs to tune for specific scenarios where one table may need to gather statistics with a much higher degree of parallelism, or at a different sample rate, than other tables.

Data Change Threshold

SQL Server will opt to update statistics if 20% of the data, plus 500 rows, has changed.

While Oracle will not automatically update statistics, the percentage of stale rows is tracked on an index by index basis. When the percentage of stale rows goes beyond the STALE_PERCENT value, the statistics are considered to be stale and need to be collected again. Although the statistics update will not happen automatically, it is possible to monitor this value and take appropriate action, if necessary.

The Ascending Key Problem

What happens when you add new data that the engine isn’t aware of? Oracle will make a best guess based on the current distribution of data in the table. There’s additional logic built-in to assume that fewer rows exist the further the queried value gets from the minimum or maximum value that’s currently tracked. This is probably true for many systems, but it could cause problems when a lot of data is coming in. On the bright side, as a DBA, you have full control over when statistics get updated.

Learning More About Oracle Statistics

You can learn more about Oracle’s table statistics in the Optimizer Statistics Concepts documentation, the DBMS_STATS package, and through the DBA_TAB_HISTOGRAMS view.


Testing ALTER INDEX REBUILD with WAIT_AT_LOW_PRIORITY in SQL Server 2014

One of the blocking scenarios I find most interesting is related to online index rebuilds. Index rebuilds are only mostly online. In order to complete they need a very high level of lock: a schema modification lock (SCH-M).

Here’s one way this can become a big problem:

  1. An online index rebuild starts against a large index
  2. A modification query runs before the index rebuild query. At the end of the index rebuild, it tries to get a schema modification lock. It can’t, because the modification query is still running
  3. The index rebuild’s super-high-level lock request then causes a massive pile-up behind it– blocking even queries that want to do dirty reads*

*I’m not saying dirty reads are a good thing, just pointing out that even NOLOCK can be blocked

Here’s a screenshot of a quick repro of that scenario:

Traditional Online Index Rebuild

And here’s what the blocking looks like in Adam Machanic‘s free tool, sp_WhoIsActive, if those are three queries are left running for a bit. It can stay ugly for a long time.

Traditional Online Index Rebuild-Blocking

Session 56’s need for a schema modification lock can cause a big backup!

Let’s Test WAIT_AT_LOW_PRIORITY and ABORT_AFTER_WAIT?

SQL Server 2014 introduced some new options for index rebuilds:

  • WAIT_AT_LOW_PRIORITY
  • MAX_DURATION (in minutes)
  • ABORT_AFTER_WAIT (Kill yourself / Kill who’s blocking you / Kill others)

This sounds pretty good, but how exactly does it impact the scenario above? Does “WAIT_AT_LOW_PRIORITY” really mean that it won’t start that nasty blocking chain? Or is it just that I can use “MAX_DURATION” to control the duration of the pain in this case?

Let’s take a look. Here’s the modified command I’m testing:

Here’s the commands I ran this time:

2014 Online Index Rebuild-Blocking

And here’s what the blocking looked like:

LCK_M_SCH_M_LOW_PRIORITY

LCK_M_SCH_M_LOW_PRIORITY lock wait type saves the day

One thing to notice about the screenshot of the blocking: there’s no third query being blocked. There’s no pileup! “LOW_PRIORITY” really does mean low priority – the “NOLOCK” query is able to get a shared schema lock and move forward.

What Happened with ABORT_AFTER_WAIT?

As instructed, my online index rebuild called it quits. Here’s the error message it threw when it gave up:

abort_after_wait_self

I Like It!

Blocking chains during maintenance window can be a huge pain– especially if you’ve paid a high licensing dollar to get online index operations. Having more options is definitely a plus.


We’re Hiring a Salesperson

Company News, SQL Server
3 Comments

When we first started our company, we laid out our goals in a shared Google Doc. We wrote about what we wanted to do, how we wanted to treat our employees and customers, and the growth numbers we wanted to achieve. One of our original goals was to hire one consultant per year.

In 2012, it was Jes Schultz Borland, and in 2013, it was Doug Lane. We held off adding a consultant in 2014 because we wanted to be financially able to hire two consultants at once in the next round. I’m not saying we WILL, I’m just saying we wanted to be ABLE to. See, one of our other goals is to be able to survive a 9/11-type business event – no incoming revenue for several months, and know that we can still pay everybody’s paychecks for that duration. That means we’re a much slower-growing consulting company, but everybody involved can sleep soundly at night.

We tried hiring Ernie, but she kept sleeping on the job.

In 2013, we also added a part-time admin assistant – my wife, Erika. She was previously a legal assistant at a downtown Chicago law firm, managing administrative and office work, so she’s been able to clean up a lot of our messes. (Scheduling training classes, selling videos via credit cards, helping out our accountants, and sending out Christmas cards with stickers requires a surprisingly high amount of time.) Having Erika on the team has really helped free us up to focus on the technology parts of the job that we love.

In 2014, we realized that just like admin duties, handling incoming sales requests had become a pretty big chunk of time too. Do the numbers: we have 5 consultants, and our main product is our SQL Critical Care®. That means we sign 4-5 new clients per week, which translates into hundreds of clients per year. That’s a lot of emails to answer, contracts to sign, and engagements to schedule. I do that work today in my spare time – and oddly, I really enjoy it – but if we’re going to scale this little shop, we’re gonna have to bring in a sales pro to manage this process full time.

So on our Employment Opportunities page, we added a job description for our new salesperson.

We’re looking for a salesperson with experience. If you’ve been working with SQL Server for the last several years, and only SQL Server, it’s probably not a good fit. (That means most, if not all, of our readers, ironically.) However, you might know someone who’s a good fit, so we’re putting this out there.

We’re excited to bring them on board and get our sales process polished – because hey, that means we can hire more consultants and trainers, woohoo!

Update Jan 27 – we’ve got the resumes we need. Thanks everybody!


Eight Things A DBA Should Always Do with SQL Server

SQL Server
44 Comments

I started tweeting various single-words you could start an argument with the other day. I really liked this suggestion from @SQL_Kiwi:

It got me thinking. What are the things that I would say you a DBA should always do or be ready for with SQL Server, unconditionally?

You should always:

As for the “nevers”, I’ll let you come up with that list.


Oracle Flashback: Undeleting Data

Oracle
3 Comments

Or, “Oops, I didn’t mean to do that.”

We’ve all had to deal with an accidental deletion or even a dropped table. Sometimes you leave off a where clause, sometimes you drop a table and find out that the change request listed the wrong table. Oracle uses a feature called Flashback to give database professionals the power to view data at different moments in time and take action based on what they find.

Using Flashback on a Dropped Table

No matter how rigorous your practices are, mistakes happen. How do you deal with accidentally dropping a table?

In the SQL Server world, we’d reach for our most recent backup, restore a copy of the database, and hope that the outage didn’t take too long. With Oracle, we can look in the recycle bin.

First we create a table:

Results:

And then we drop the table:

Results:

Oh no, I meant to drop test_two! Now what?

Thankfully, I can take a look in the recycle bin using the command SHOW RECYCLEBIN:

Okay, now I can see that back in August I dropped a table named BIG_TABLE and our table named TEST is still hanging around. Let’s restore the TEST table:

Crisis averted! I’ve been able to restore the previously deleted table with a new name. I could leave out the RENAME TO portion and restore the table back with its original name, but it’s always possible that someone else has restored the table. Instead, it’s a probably a better practice to safely restore the table with a different name and then change the name with an ALTER TABLE:

Fixing Row Level Mistakes with Flashback

Let’s keep using our test table. Here’s what the data looks like now:

That data isn’t right. I need to know when the right data was present so I can get the right row in place. In order to do that, I can use the VERSIONS clause to tell Oracle to bring back specific versions of rows present for this particular table:

All the rows, all the time.

Now we can see a history of the row with an id of 6!

  • The row was inserted at 9:38AM.
  • At 9:41, someone corrected the things column to read SIX.
  • At 9:48, someone update the things column back to FIVE – which we know is wrong.

How do we get the correct row back?

If we’d configured the database to track supplemental log data, we could use the view flashback_transaction_query and grab the UNDO_SQL column to rollback that one command. Since I have not configured tracking supplemental log data, we’ll have to be a little bit trickier.

Thankfully, we can use some UPDATE shenanigans to get exactly the rows that we want:

Results:

Holy cow, we got our row back! Make sure you COMMIT the transaction (remember – Oracle won’t auto-commit like SQL Server).

Looking Into the Past

If you hadn’t guessed, it’s even possible to view the contents of a table as of a moment in time using the AS OF TIMESTAMP clause:

Results:

This functionality makes it possible for analysts to undo changes to the database, review changes for auditing purposes, or even to recalculate historical reports based on newer formulas.

The Tip of the Iceberg

Undeleting tables and reviewing previous rows is only a small portion of what you can accomplish with Oracle Flashback. Entire transactions can be flashed back, databases can be rolled back to a point in time, or the Data Archive feature can be used to house all changed versions of rows for all time. But even without diving into more advanced features, Oracle Flashback gives database professionals the powerful ability to correct for “oops” deletions in the application.


How to Change SQL Server Settings with the Scientific Method

SQL Server
5 Comments
Ask your scientist if Service Broker is right for you.

When you’re trying to fix a problem (or even just researching something you’re curious about), do what scientists do.

1. Ask a question. “Why is this database so slow?”

2. Do background research. Hit Google, check Stack Exchange, maybe even read Books Online.

3. Construct a hypothesis. “I think this database is slow because I don’t have Lock Pages in Memory enabled.”

4. Test your hypothesis with an experiment. “On Saturday night during the change control window, I’ll enable Lock Pages in Memory. After that change, I believe that Page Life Expectancy will be higher during our normal business hour load periods – it’s currently 300, and I expect to see it go up.” Pick the exact metric you want to watch, and explain – in advance – how you expect that metric to change.

5. Analyze your data and draw a conclusion. “I measured PLE, but it still hovers around 200-300 during our weekday peak times. Therefore, enabling Lock Pages in Memory was not the solution I needed.”

6. If it didn’t get the result you expected, put it back. This is the part most folks miss – we make changes willy-nilly when we’re troubleshooting, and we leave behind all kinds of crazy sp_configure options, trace flags, and registry settings. The next time you have a problem on the server, it’s hard to know what settings we changed on purpose – and which unrelated ones we just button-bashed.

I can hear the experienced DBAs in the crowd screaming out that we should never run experiments in production, and that’s somewhat true. In a perfect world, we’d all have exact replicas of our production environment, and the ability to run production-quality loads. We don’t. Let’s start by taking the first step – making sure our production changes have the effect we expect.


Does Updating Statistics Cause a Recompile if No Data Has Changed?

SQL Server, Statistics
4 Comments

tl;dr — Not necessarily.

One of our students asked me a great question: if you update statistics on every table in the database, is that effectively the same as dumping the procedure cache on the instance? Will every execution plan have to be recompiled the next time it is run? I thought it was a great question and it spurred an interesting discussion about maintenance and recompilation.

Updating statistics can certainly cause recompilation. But based on my observations, it won’t necessarily cause every execution plan to recompile.

To test this out, I’m going to use a free tool that Jeremiah and I wrote, sp_BlitzTrace™, to trace activity in Extended Events and show me when a recompile occurs.

Our Test Setup: Users Table with No Nonclustered Indexes

I’m running a simple, non-optimized query against a restored copy of the StackOverflow database on SQL Server 2014. To keep things simple, I have left the dbo.Users table without any non-clustered indexes. The auto-create statistics option is on with the default synchronous setting. I cleared the procedure cache before I started my test.

sp_BlitzTrace™ starts an Extended Events trace against my own session. Then I run my (somewhat troubled) query and stop the trace. Then I read the results.

exec sp_BlitzTrace @Action='start', @TargetPath='S:\XEvents\Traces\', @SessionId=@@SPID, @TraceRecompiles=1;
GO
SELECT DisplayName, Reputation
FROM dbo.Users
WHERE DisplayName LIKE 'Kendra%'
ORDER BY Reputation DESC;
GO
exec sp_BlitzTrace @Action='stop';
GO
exec sp_BlitzTrace @Action='read';
GO

Here are the results from the first run. This compiled a plan and put it into cache:01-initial run-fresh compile

I Find the Statistic To Update and Get Out My SledgeHammer

I find the statistics on the table by running sp_helpstats. This shows that I have a column statistic on the DisplayName column. I copy the name of that off to my clipboard. This is the statistic I’m going to update, because it’s in the “where” clause of my query.

01b-related row in statistics

I update the statistics with FULLSCAN with this code:

UPDATE STATISTICS dbo.Users _WA_Sys_00000005_1D7B6025 WITH FULLSCAN;
GO

I’m not a fan of updating all your stats with fullscan. I just got out the sledgehammer for the purpose of demonstrating if it would cause a recompile.

… And I Don’t See A Recompile

After the statistics update, I run my test query block again (the same one above) with sp_BlitzTrace™.  I do NOT see a row returned showing a recompile event:

02-after statistics update

I can run the query multiple times, and the trace never shows a recompile event.

Hmm. Well, maybe stats didn’t update somehow? Well, we can check. I query sys.dm_db_stats_properties and it shows that this statistic DID update:

03-updated statistics

.. Let’s Fake It Out and Make a Modification

Nothing has been inserting, updating, or deleting data in my copy of the StackOverflow database. I run an insert statement (and roll it back, just for fun), and then update the statistics.
04-fake out insert and update stats

There’s Our Recompile!

Following the “fake insert” and statistics update, I run my query again and the Extended Events trace shows a sql_statement_recompile event. The cause is statistics change:

05-recompile

Finding: Statistics Update Alone Didn’t Cause a Recompile

SQL Server was smart enough to check if the data had changed. Updating statistics alone doesn’t always invalidate execution plans.

What Does This All Mean?

Mostly, I think it just means that SQL Server is pretty clever about when to do recompiles — at least SQL Server 2014, since that’s where I ran this test. But don’t take this as an excuse to be lazy. I’m a fan of using the @OnlyModifiedStatistics=’Y’ option on Ola Hallengren’s index maintenance solution if you’re using @UpdateStatistics=’Y’: because why even update the statistic if it looks like nothing has changed?


How to Ask Microsoft a SQL Server Licensing Question

Licensing

Licensing is hard, y’all. It changes often and it’s full of lots of little details. Microsoft puts out licensing datasheets, but they’re in a difficult spot — if they explain absolutely everything, the documents get longer and harder to understand. So they have to balance between brevity and clarity.

So when you’ve got a licensing question, your options are:

  • Post a question in Microsoft’s official SQL Server forum – because Stack Overflow doesn’t allow licensing questions, or
  • Find a Microsoft partner who sells licensing, and ask them – they’re usually willing to answer your question for free since they’ll make money off your licensing sale, or
  • Hire us for a SQL Critical Care® – in which we review your workloads, your business goals, and figure out what’s the right way to solve your challenges at the lowest cost, which can sometimes involve hardware or licensing changes

Hope that helps!


Tip for Learning Extended Events – Use “New Session” (Not “New Session Wizard”)

SQL Server
1 Comment

Extended Events have become one of my favorite tools for learning about tuning SQL Server. Whenever I wonder how something works, I can fire up a test instance and play around with XEvents. It’s always interesting, and at least 5% of the time I end up learning what I intended.

Not everything is sunshine and rainbows. Finding the right events and making sure you understand the output can be really frustrating. And you want a SQL Server 2012 or 2014 test instance to do this. The events are much richer and there’s an interface to help you along.

But like a lot of things, the interface isn’t all that intuitive.

New Session, or New Session Wizard?

New Session- No Wizard
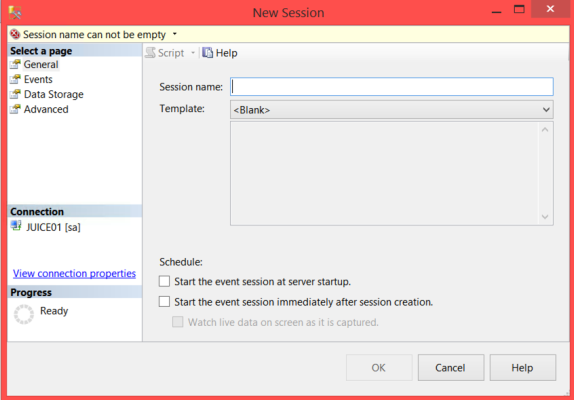
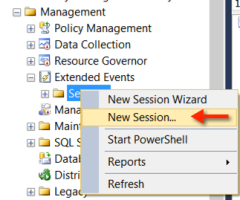
I used to click on “New Session Wizard”, simply because I had no idea what the difference was between the two options, and it was first in the list.

The “Wizard” option gives you some templates that you can choose to customize. If you’re just starting out, that could be interesting to use on your test instance.

But it always left me frustrated that I couldn’t use some of the more advanced options in Extended Events. I felt like I was just scratching the surface, and trying to code sessions from scratch using Books Online was slow and painful.

“New Session” Just Gives You a Better Wizard

When you click new session, it turns out that you still get a wizard. It starts out asking you for a session name and some basic properties:

It is still wizard enough

Then you can choose your events. I decided I wanted to test some plan guides, and see if I could use Extended Events to count how many times a plan guide was used. (This is something that the DMVs and perf counters don’t make accessible.) I added the plan_guide_successful event:

plan guide successful
Not all events are created equal– some can slow down your SQL Server, just like in Profiler/SQLTrace. Be careful out there.

Extended Events Targets: I Can Pick a Histogram!

The “Data Storage” tab is where this gets good. I was always frustrated when I was using the Wizard that I had limited choices about how to set up a target. If you use this version of the Wizard (the Un-Wizard Wizard?), then you get to pick your target type and it’ll help you script that out.

In this case, I want to use the histogram target. I don’t care when the plan guides were executed– I just want a count of which ones are being used. This can help keep my trace lightweight, plus if that’s the only information I want then I don’t have to do any complicated grouping on the output.

The GUI is nice and friendly and lets me say I want my “Buckets” to be on the plan_guide_name field:

Histogram Target

After I create my session, it shows up in my Extended Events session list in the SSMS Object Explorer. I can right click on it and script it out, start it, stop it, etc.

Start Session

I Ran My Plan Guides Test and … It Worked!

I fired up my session, created some plan guides, and ran some queries against my restored copy of the StackOverflow database.  After building up a bit of data, I just double-clicked on package0.histogram to open the results so far:

doubleclick on the package

And it worked! I created a ‘template’ plan guide that I executed via a HammerDB workload— so that got hit a ton. Then I created two other plan guides that I just ran twice and once, respectively.

voila-histogram-target-plan-guide-execution-count

Extended Events Aren’t Always This Easy

Putting together this little example went smoothly. Surprisingly smoothly. So smoothly that I really want to quit while I’m ahead.


What is the PREEMPTIVE_DEBUG Wait in SQL Server?

SQL Server
2 Comments

Recently we got an email asking for help from a DBA who was concerned about a high percentage of the PREEMPTIVE_DEBUG wait on a SQL Server. They were investigating poor performance and had searched the internet high and low and not found information on what this wait means. They were stumped.

What to Do When You Find an Unusual Wait

We have a lot of tools to explore and learn things ourselves in SQL Server. Even when you find results explaining something on the internet (like this one!) it’s always good to use those tools to explore yourself and learn.

But first, don’t panic! Just because a wait is a high percentage doesn’t necessarily mean it’s a problem. For any wait…

  1. Narrow in and find out when the wait occurs, and how much of it there is. Just because it’s a top wait by percentage doesn’t mean it’s always a problem. The server could be bored.
  2. If it actually is a problem, identify what’s running when the wait occurs.
  3. Blog about it! Help others.

But what is the PREEMPTIVE_DEBUG wait, anyway?

I had a guess as to what this wait type meant, so I did a quick test to verify. In one SQL Server Session, I ran our sp_BlitzFirst procedure to take a 10 second sample of waits:

In another session, I ran the built in procedure sp_spaceused, but ran it with the “Debug” button at the top of SSMS and started stepping into the code. (I just picked that procedure randomly.)

Here’s a screenshot of what I saw when sp_BlitzFirst® completed:

PREEMPTIVE_DEBUG

Success! The PREEMPTIVE_DEBUG wait is related to using debugging tools to step through code. When you’re stepping through something the SQL Server has to wait for you to say “go on”.

My guess is that this probably isn’t specific to only the debugging tool built into SQL Server Management Studio itself. Developers can use other debugging tools when working with Visual Studio or Windbg, and I bet they all produce this wait.

What to Do if You See PREEMPTIVE_DEBUG

The list I have above still applies– do a quick assessment of how much of the wait there is. But I’d also start asking some friendly questions of folks about whether they use debugging tools against production often– and if you can maybe give them a fresh database backup in a development environment where they can debug safely, away from your customers!


Oracle Wait Events

Oracle
7 Comments

Knowing what a query has been waiting on helps you figure out where you need to tune that system. Oracle’s wait interface provides a significant amount of information to help a DBA decide where to put tuning resources. There are multiple ways to see what Oracle has been waiting on:

Wait Classes

Oracle waits are split into multiple classes. We can review total instance-wide totals for each wait class by using the v$system_wait_class view. This view aggregates information about an entire instance of Oracle since start up. The view only shows events at an event class level – this can make it valuable to determine if a problem is related to I/O or some other portion of the system.

This screen shot shows a relatively idle Oracle instance that isn’t up to much at all. It is, however, immediately apparent that waits are broken up into multiple wait classes. An explanation of the different wait classes is available in the Oracle Database Reference – Appendix C – Classes of Wait Events. Most scripts ignore events in the Idle wait class and we’re going to be doing the same.

System Waits using v$system_event

It’s possible to get more details about waits by using the v$system_event view. This view contains wait event timing across the system since the last restart. Although this only givings timings and average since the system started up, this information helps discover immediate trends:

Wait, why are we multiplying by 10 for the average wait columns? Well, the AVERAGE_WAIT columns are stored in hundredths of a second, and we’d like everything to be in one uniform number. We also have to divide microseconds by 1,000 since microseconds is a mindbogglingly tiny duration, I’ve gone and converted everything to milliseconds here.

There are more columns reported by v$system_event, but the ones in this query are likely to be the most interesting to beginners. The FG columns display the waits from foreground (user facing) sessions. Other waits are happening elsewhere in Oracle. They may be slowing down the system, but they are not directly caused by end users.

Single Session Waits

What if we want to know what’s going on within one session? What then?

The v$session_event view contains information about currently executing sessions. It’s remarkably similar to the v$system_event view:

v$session_event displays all of the waits for each active session. Obviously, we want to filter out the Idle waits since they’re idle and, for our purposes, ignorable.

v$waitclassmetric_history: A History of Waiting

What if we want finer granularity about how an Oracle instance has been performing? v$system_event lets us review waits since the beginning of database time. v$session_event lets us see waits for currently running queries. What else is there?

The view v$waitclassmetric_history gives us some insight into what’s happened over the last hour, but only by wait class. This isn’t as limiting as you might think – sometimes it’s only necessary to know that we were waiting on disk or concurrency. The data in v$waitclassmetric_history is broken down into one minute buckets.

Once again, we’re multiplying time_waited by 10 to get the time in milliseconds. These times are stored as floating point numbers, so we aren’t losing observable fidelity in our data.

The last minute of waiting

Reviewing the screen shot, we can see a lot of information. This screen shot only shows the previous minute (which you could get from v$waitclassmetric), but when you query your own systems, you’ll see what I mean.

dba_hist: The Long View

If you’ve been licensed for the Oracle tuning and diagnostic packs, you have another tool at your disposal – the dba_hist views. Specifically, the dba_hist_system_event view. This contains a history of wait stats, summarized at one hour intervals, since you cleared out the data. This is part of Oracle’s AWR (Automatic Workload Repository).

The values stored in dba_hist_system_event are a running total of wait information. You can query it, but remember that these are cumulative values. To get helpful metrics for each hour, you have to do something like this:

Remember – this feature costs money, so don’t run it on your production machines unless you’re positive that you’re already licensed for it.

Putting it all together

By choosing the right view (and maybe the right licensing), you can review Oracle wait stats and start getting to the bottom of performance issues. Wait events aren’t the be all end all of Oracle performance tuning, but they are a good first step into determining where the problems lie.


Read Committed Snapshot Isolation: Writers Block Writers (RCSI)

When learning how Read Committed Snapshot Isolation works in SQL Server, it can be a little tricky to understand how writes behave. The basic way I remember this is “Readers don’t block writers, writers don’t block readers, but writers still block writers.”

But that’s not so easy to understand. Let’s take a look at a simple test showing what it means that “writers still block writers”.

Create our simple test schema

We’re doing a super simple test: we just need a database with READ_COMMITTED_SNAPSHOT enabled and a table with a single row.

Start one transaction that does an update (Session #1)

An update begins! To test this out, we’re doing an explicit BEGIN TRAN so that our update will hold locks. Run this in one session in SQL Server Management Studio:

Another update begins! But it’s blocked. (Session #2)

Before that update transaction complete, another session comes in. Just open up another session window in SSMS and run this:

This won’t complete right away, because it’s blocked by your first session.

Back in Session #1, run:

When Session #1 commits, it finishes up and cleans up its lock. Session #2 is also able to finish, and in its output you’ll see:

[code] (0 row(s) affected)
[/code]

Who “wins”?

Let’s check the rows in the table:

Red Marble

Here’s how things happened:

  1. Session #1 locked the row and turned the marble red.
  2. Session #2 was also doing an update, and it didn’t get to the row until Session #1 released the lock.
  3. At that point it found zero rows to update, because the color had already changed.

If You Wrote the Update Differently, You Might Get a Different outcome…

Remember, writers do NOT block readers under read committed snapshot isolation. What if someone wrote this as a two part operation (instead of a single update statement)?

When we check how things turned out…

Black Marble

In this case, Session #2 wasn’t completely blocked! Things happened differently:

  • Session #1 locks the row, that’s the same
  • Session #2 is doing a SELECT statement, so it uses the version store and isn’t blocked. It’s able to populate the temp table.
  • But Session #2 becomes blocked at the point it runs the UPDATE.
  • When Session #1 completes, Session #2 is unblocked and updates using the data it’s cached in its temp table.
  • Session #2 changes the color of the marble.

I’m not saying that it’s always better to do a single UPDATE or that it’s always better to use a temp table. You just have to know how they behave so you can pick the right code for your situation.

If you need to use a temporary table for performance reasons, but want your read to be blocked if any writer has a lock, you can achieve that by using locking hints. Which might cause a lot of blocking, just like anytime you use locking hints.

What About Snapshot Isolation?

In this post we’ve looked at Read Committed Snapshot Isolation. There’s another isolation level, SNAPSHOT, which behaves a bit differently. If you want to test that out, you can modify the code samples above to reproduce an “update conflict” with both of the sessions using SNAPSHOT isolation.

This May Sound Complicated, But It’s Not That Bad

When you talk about any isolation level in detail in SQL Server, things get complicated. I don’t think that Read Committed Snapshot Isolation is any more complicated than plain old Read Committed, it’s just that people don’t think too much about Read Committed, since it’s the default!


Whitespace, Comments, and Forced Parameterization in SQL Server

SQL Server
18 Comments

A question came up in our company chat room the other day: does the forced parameterization database setting help with plan cache bloat caused by dynamic comments or whitespace?

I love the topic of parameterization in SQL Server, probably because it’s one of those things that’s really pretty weird (but seems like it’d be straightforward). So I immediately wanted to test it out and see if SQL Server would do what I thought it would do.

Parameterization reduces compilation and plan cache bloat

For anything but the simplest queries, SQL Server takes literal values in your query literally. If you don’t parameterize the query, SQL Server won’t do it for you. That means that each of these three queries will get its own execution plan (even if the execution plans are all identical):

If you do this a lot, it can impact performance, particularly in a busy transactional database. It costs CPU to compile each query and SQL Server has to work much harder to manage an execution plan cache which is churning through frequent queries that are never-reused.

(For super-simple queries, simple parameterization may be applied. This is also sometimes called “auto parameterization” by people who worked with SQL Server 2000.)

White space, formatting, and comments can increase compilation and plan cache bloat for parameterized queries

I’m going to use spaces as examples in this post, but basically this is just a shorthand for talking about any variance in the syntax for executing a query.

Basically, these three queries will each get their own execution plan in SQL Server because the string being executed is different– even though it’s only different inside of a comment bracket, and even though the difference is simply the number of spaces in that comment:

The differing format in the whitespace give you just as much compilation burn and plan cache bloat as if the query were not parameterized.

‘Forced parameterization’ reduces execution plan bloat for non-parameterized queries

You can’t always re-write your whole application. The ‘forced parameterization’ database setting can help out sometimes — it tells SQL Server to look for those literal values and to try to treat them like parameters. This database setting can dramatically reduce compilation work by enabling execution plan reuse in some databases.

Like anything else, it has some limitations:

  • It impacts the whole database. If you only want to do individual queries, you have to use Plan Guides.
  • It won’t do anything if the database compatibility level is set to 80. (But plan guides will work.)

The Question: Does the ‘forced parameterization’ setting help with whitespace in query strings?

If SQL Server is smart enough to find those parameters in the string and remove them, shouldn’t it be smart enough to find the whitespace / dynamic comments and ignore them, too?

To figure this out I wrote up some test TSQL and executed it against a restored copy of the StackOverflow database.

Forced parameterization test: non-parameterized queries

For this test, I set up some simple code to execute non-parameterized dynamic SQL which also had different whitespace for each query. I ran the query 1,000 times in a loop, and then checked the execution plan cache to see how many copies of the query I had. Here’s what the code looks like:

Here’s what the queries looked like:

Forced-Parameterization-Comments-Non-Parameterized-String-Queries

Here’s how many execution plans I got:

Forced-Parameterization-Comments-Non-Parameterized-String

Forced parameterization “worked”, and it overcame the different whitespace for the queries! I had one plan run 1,000 times.

Forced parameterization test: parameterized queries

So, what if you have a parameterized query, but it has a problem with dynamic comments/ whitespace? Will turning on forced parameterization help that, too?

Here’s what the queries looked like:
Forced-Parameterization-Comments-Parameterized-String-Queries

Here’s how many execution plans I got:

Forced-Parameterization-Comments-Parameterized-String

Oh, ouch. Everything does hash out to the exact same query hash, but I got 1 plan for each execution, 1,000 plans total. For a parameterized query, the ‘Forced Parameterization’ database setting didn’t clean up the dynamic comments / whitespace for me.

Recap: what we saw

The ‘forced parameterization’ database setting is smarter than you might think, but it doesn’t fix every problem.

For our test query, it was able to force parameterize a query even if there were comments with different amounts of whitespace in it.

However, for query that was already parameterized, it didn’t fix the issue of dynamic comments/whitespace causing extra compilation and plan cache bloat.


How to Configure Ola Hallengren’s IndexOptimize Maintenance Script

If you’re a production database administrator responsible for backups, corruption checking, and index maintenance on SQL Server, try Ola Hallengren’s free database maintenance scripts. They’re better than yours (trust me), and they give you more flexibility than built-in maintenance plans.

However, the index maintenance defaults aren’t good for everyone. Here’s how they ship:

The defaults on some of these parameters are a little tricky:

When an index is between @FragmentationLevel1 (5%) and @FragmentationLevel2 (30%), the scripts will perform the actions listed in @FragmentationMedium, in order. First it’ll try an index reorganize, which is an online operation. If the index’s design doesn’t allow for that, IndexOptimize will try to rebuild the index online. If the index’s design or your SQL Server edition doesn’t allow for that, it’ll perform the last resort – an offline index rebuild.

When an index has higher fragmentation than @FragmentationLevel2 (30%), the scripts will try the actions listed in @FragmentationHigh – first an online rebuild, then if that’s not possible, an offline rebuild.

These defaults aren’t dangerous or deadly, but they do have drawbacks.

Index maintenance changes data pages and creates transaction log records. This means larger transaction log backups, which at first doesn’t sound too terribly harmful. However, if you’re using database mirroring, transaction log shipping, AlwaysOn Availability Groups, or anything else that copies your logged transactions around, you’ve put yourself behind. In one case, I saw an all-solid-state server generate ~25GB of transaction logs in under 3 minutes – all of which had to be copied out to the various reporting and disaster recovery servers. This creates an RPO/RTO problem without really solving a performance problem.

Index maintenance changes data pages, too. This also sounds harmless, but if you’re doing differential backups or storage replication, boom, you just inflated your storage and bandwidth costs. The larger your database becomes, the more you’ll start to investigate these recovery options, and the more index maintenance starts to backfire.

Offline index rebuilds cause blocking. As low as 5% fragmentation, the script defaults have the potential to take tables offline and block queries. I take kind of an extreme view on this: I would rather not take tables offline when there’s not a human being around to watch what’s happening.

So here’s the defaults I prefer:

  • FragmentationLevel1 = 50%
  • FragmentationLevel2 = 80%
  • FragmentationMedium = ‘INDEX_REORGANIZE,INDEX_REBUILD_ONLINE’
  • FragmentationHigh = ‘INDEX_REBUILD_ONLINE’

Note that I raised the fragmentation thresholds by a lot, and I removed the offline rebuild operations. I’m not saying I never rebuild indexes offline – I just don’t want to do that by default, with nobody around. When I’ve got tables that are heavily fragmented, and I’m convinced that a rebuild will solve the problem, AND I can only rebuild them offline, then I want to run the stored procedure manually when I can be around to keep an eye on it.

How to Change the IndexOptimize Defaults

You could just edit the IndexOptimize creation script. This way, whenever you execute it without any parameters, it will inherit the defaults you set at creation time. If you maintain IndexOptimize across a lot of servers, and you keep a single master version in a central location, this works.

But you have to be doggone sure to remember to change those defaults every single time you download a fresh version from Ola. (You won’t. You’re too busy reading blogs.)

The safer way is to leave his script the way it is, but when you work with SQL Agent jobs to run IndexOptimize, change the job’s settings.

You should probably be doing this anyway because you should create two separate Agent jobs: one to do your normal lightweight optimizations, and a second one for deeper optimizations (like with offline rebuilds). Some folks like to have weekday jobs that only do low-impact maintenance techniques for highly fragmented tables (like if something manages to hit 80% fragmentation on a Tuesday, go ahead and rebuild it online) followed by more invasive techniques on the weekends.

Just keep your backup schedule in mind – if you do full backups weekly on Saturday, followed by differential backups the rest of the week, don’t do your index rebuilds on Sunday. That instantly has the effect of inflating your differential backups all week long. Do the index maintenance first (like Saturday morning) followed by the full backup Saturday evening.


The Most Confusing Words, Phrases, and Acronyms in SQL Server

Humor
13 Comments

Words are hard. Acronyms are even harder. Here’s the words that give me the most trouble when talking to people about SQL Server. And thanks to all my Twitter friends quoted here for their suggestions!

Replication

“I have a question about replication…”

“Which kind? Transactional? Merge? Peer to Peer?”

“Availability Groups.”

Technically, the word “replication” refers to very specific features to publish and subscribe to data at the table level in SQL Server. But users commonly use the word as a general term to cover other technologies used to replicate data between SQL Servers (see there, I just said “replicate”), so you never quite know what anyone means at first without clarifying.

Snapshot

“We use snapshots for that.”

“Oh, a database snapshot? Or a replication snapshot?”

“Oh, no, we do it with the SAN.”

The word snapshot is super-popular when it comes to SQL Server technologies. It’s even the name of an isolation level.

Cluster

“We’ve got a SQL Server on that cluster.”

“Oh, a Windows failover cluster?”

“Sort of? It’s virtualization.”

You can cluster in many different ways. You may have a cluster of virtualization hosts. Or you could have SQL Server installed in a Windows Failover Cluster. Or you could have both!

Cluster + AG

“We’ve got a cluster and an AG.”

“Is the cluster in the AG?”

“Yes, on all three servers.”

“Cluster” is more confusing than ever, because AlwaysOn Availability Groups require a Windows Failover Cluster. And you might combine a Windows Failover Cluster Instance with your AlwaysOn Availability Group, so there’s a failover cluster and… a cluster. Yeah, there’s a proper way to use these terms (and their related acronyms), but practically speaking nobody understands them. When things get confusing, just surrender and draw a picture. It’s easier.

HAG

“We’ve got three SQL Servers in a HAG.”

“In a what?”

I’m not sure why, but some Microsoft blogs and posts started using the acronym HAG for “High Availability Group.” Most SQL Server posts just use the shorter acronym “AG” for “Availability Group”, or spell out AlwaysOn Availability Groups.

“Truncating the log”

“We truncate the log every hour.”

“Oh. What command do you use to run that?”

“Let me look. Oh, it’s BACKUP LOG.”

“Are you using TRUNCATE_ONLY?”

“No way!”

“Truncating the log” is an older phrase that still sticks around. People start saying “truncate” instead of “backup”. They mean completely different things — and it’s really important to clarify what’s being run.

DAC

“Have you enabled the DAC?”

“No, we don’t use DAC packages. That feature was terrible.”

“No, I mean the Dedicated Admin Connection.”

Histogram

Histogram: A target for Extended Events in SQL Server 2012 or later. (But if you’re using an earlier version of Extended Events, it’s called a “Bucketizer”.)

Histogram: A table showing the distribution of values used in a statistic.

These are completely unrelated. Although I guess you could probably use an Extended Events histogram target to run a trace showing if a procedure recompiled because statistics updated on a table (which means that histogram would have changed). I have no idea if that sentence even makes any sense.

Statistics

Speaking of statistics…

“Let’s look at the stats for that query.”

“You mean the statistics on the indexes?”

“No, the statistics in dm_exec_query_stats.”

I have a huge problem with this word when I’m teaching. I frequently have to use ‘statistics’, and make sure that what I’m saying isn’t totally misleading because the word can have multiple meanings.

“In memory” data

“We’re really interested in keeping the data ‘In Memory’.”

“Do you mean by using Hekaton?”

“No, we mean by just adding memory to the server.”

It could be worse…

Until we have perfect terms, I’ll be here, using the DAC to take a snapshot of your statistics on the cluster.