
Three reasons to use Extended Events
I have a new mission: to convince you, the long-time Profiler user, to switch to Extended Events. I realize I have a long, difficult task ahead of me. Profiler has been around for a long time. You’re comfortable with it. You know it’s not perfect, but you have learned to live with its imperfections. Now I want you to step outside your comfort zone and learn a new tool, with new terminology, a new interface and new capabilities.
I’m going to start with a few reasons for you to consider Extended Events. I want you to think about these things, and if they could make your job easier.
1. The number of events in Profiler has remained the same since SQL Server 2008. The number of events in Extended Events (XE) has more than tripled.
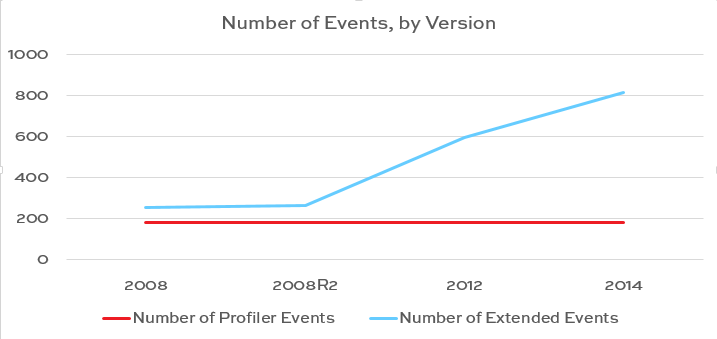
What kind of events are being added to XE, but not Profiler? Events for any new features, such as Availability Groups, In-Memory OLTP, and Windows Azure Storage. You can query sys.trace_events to see which events are available for Profiler, and sys.dm_xe_objects to see the events for XE.
|
1 2 3 4 5 6 7 8 9 10 11 12 13 |
/* Profiler */ SELECT trace_event_id, name FROM sys.trace_events; /* XE */ SELECT pkg.name AS PkgName, pkg.description as PkgDescr, obj.name as EventName, obj.description as EventDescr FROM sys.dm_xe_objects obj inner join sys.dm_xe_packages pkg ON pkg.guid = obj.package_guid WHERE obj.object_type='event' and pkg.name NOT IN ('qds', 'ucs', 'SecAudit'); |
If I am using XE and have an Availability Group, I can track availability_replica_state_change to see what the replica’s previous state and current state are – such as when a replica goes from a secondary to primary. If using SQL Server 2014’s buffer pool extensions, I can count how many times pages are read, using buffer_pool_extension_pages_read, or when they are removed, using buffer_pool_extension_pages_evicted. Even without any special features, XE lets me dig deeper into what SQL Server is doing. I can track async_io_requested and async_io_completed events, which I can’t do with Profiler. You can count page_split as it’s happening, to see if that’s causing a performance problem. XE has many, many events!
2. XE gives you multiple options to save and view the data. With Profiler, you can view the action live on-screen, and risk bringing the server down, or you can save it to a trc file and view it after the fact. XE allows you to choose one or more targets for each session, and they allow a lot of flexibility.
You can “View Live Data” and watch the events you’ve selected scroll across the screen (although I still wouldn’t recommend this approach). You can save your events to a file on disk, then review them later. You can also collect data in ways Profiler didn’t allow. For example, using the event_counter target allows you count the instances of an event happening – while it’s happening, no going back and having to aggregate after the fact. The histogram target is similar, but allows you to put the event in groups – again, as it’s happening, not later. You can also use the pair_matching target to find related events that match.
3. XE sessions are easily scriptable & portable. Yes, you could script out a Profiler session. Does this really make sense to you?

An XE script is simple to read and understand. I can create this once and deploy it to any server.

It’s time to consider moving away from Profiler and using Extended Events. In a future release of SQL Server, Profiler will be gone – so learn more about Extended Events starting today!

19 Comments. Leave new
Nice article. I finally ditched Profiler when I learned about the ring buffer target. OMG is that a lifesaver! Yes it’s not perfect and can lose your data. Our Java app (developers) have a tendency to catch sql errors and toss them to the bit bucket causing endless user frustration. When I suspect this I just fire up a XE session with a couple MB to a ring buffer and then have the user quickly replay the steps that *should* be throwing the error. Then just query the target, grab the evidence, shut down the session, grab your shillelagh and go beat the developer over the head for messing up basic error handling.
Doing that workflow, and then automating it, in Profiler, is no picnic. Our automation is so good we have a little button available on every web page that “traces” the application for 5 minutes if the end user suspects a problem. They open a ticket and include the trace code and we can investigate the issue using the XE automation and some java profiling. It’s basically an end-user-launched, on-demand debugger. Customers love it.
That’s awesome automation!
Also, +1 for “best usage of shillelagh in a blog comment”!
Hi,
Thanks for the post. I really, really want to wean myself of profiler, but have so far failed with each foray into XE. I have tried to incorporate this into my repertoire but feel repeatedly disappointed. We only recently cut the chord with SQL 2005 and deploy our software on SQL 2008 and above. Early on, XE were not user friendly. Has that changed? Can I use the fancy UI in SQL 2014 SSMS to setup XE sessions that can then be deployed on SQL 2008 machines?
What about monitoring for blocking, it seems as if there is a gap in SQL 2008 or 2008 R2 as pertains to monitoring blocking. Am I correct in this observation?
Thanks in advance for any insights you have or resources to which you could point me to push over the fence on adoption of WE!
You’re right – Extended Events were a pain in 2008/2008R2. I didn’t adopt them until 2012. You can use the 2012/2014 GUI to set up a session and script it out. As long as those events, actions, predicates, and targets exist in 2008/2008R2, you can run the session there – but fair warning, many events have been added to 2012/2014.
You can use XE to monitor locking, blocking, and deadlocks – Jeremiah blogged about that a while back.
You win. I’m convinced.
Awesome! Now I need to finish rolling out my training so you can learn all the fine points!
Download a copy of the awesome and free Qure tool from DBSophic.com. When someone provides me with the capabilities to do what that tool does via XEs then and only then will I make the switch to using them over traces. 🙂
Kevin – have you thought about writing a review of that tool? I’ve heard a few similar remarks from its users, and I’d be curious to hear more about their first hand experience it. (Here isn’t the place for that review, of course.)
I like Qure, too, but what can it do that Extended Events can’t?
It isn’t about what XEs CAN’T do, it is about what Qure does WITH the trace that is killer. The call normalization is obviously the main feature, but that then allows other spiffy things such as the aggregations (with multiple order bys available). You can also see both the query template as well as the actual calls with parameters, each with effort required. Throw in a simple but very usable interface and it is a winner. Then add in the ability to compare new run to baseline run and it moves up into the WOW category.
I’m definitely going to do a full-blown review of this product!! 🙂
You know Brent, I have been waffling about starting a blog (I HATE to write!!) so maybe that will be something to get me started! I am pretty passionate about how helpful Qure is. Hmm …
Thanks for the article Jes. I’m already a convert and am working on getting the rest of my team on board. One question I had was about viewing the live data stream. You mention that you still wouldn’t recommend that approach. Was that because of the poor interface (IMHO) or are there other considerations?
Thanks,
Jason
One obvious limitation is that it’s not up-to-date – there is lag time in the live data feed. I also think the interface is terrible. It’s not my favorite tool!
Hi Jes
Thanks for article. I have been monitoring deadlocks using XE and have observed it tends to spill deadlocks if they happen in chuncks. Have tweaked few settings but it still continues to happen.
Any suggestions ?
FYI . It is lot more easier to monitor page split with XE than using fn_dblog.
Cheers
Jude
What do you mean by “spill deadlocks”?
Hi,
I do like your article and I do see the usefulness of extended events (and I will certainly look up Qure), but I, on the other hand, spend a considerable amount of time providing tier 3 support to people who assume that the source of an error can always be found by looking the details of the error itself, and this is what only using EE leads to. Let me illustrate what I am getting at two ways:
1) Errors do not happen in isolation. At least on systems I work on, my code is responsible for dodging the errors created by other applications using the same database (these other apps are not careful with their locks, etc.). Typically, people who write terrible code don’t support their applications either – instead, they blame their problems on whoever else is using the same data. We are very careful with our DB interactions and we do support our software. Having the profiler to watch/document their behavior (like placing exclusive table-level locks on a central table for 10 minutes at a time) and how it interacts with what we are doing always helps when debugging these types of issues.
2) Errors do not always happen at the same time as when the SQL error is reported. Think of a snowball rolling down a hill. The REAL mistake (the one that needs fixing) may have occurred at the top of the hill, but the one that reports the SQL error is 2,000 SQL statements later. Analyzing that statement doesn’t provide any insight into what needs to be fixed. Rewording the statement that caused the SQL exception to avoid the error is like putting a bandage on a late stage 4 cancer. Early detection provides a much better probability of curing the problem.
By using a profiler (when in a test environment with good data, and all involved software) allows you to see all expected interactions. You don’t need to profile production, but profiling test in this way does leave information about all 2,000 SQL statements for you, so that you can sift through the evidence until you find the root cause.
We never expect to see measurements about speed from the profiler – for me, that is too much to ask.
A last thing that the profile was most valuable in providing was in seeing the SQL code that was produced by different coding patterns. If you write C# or VB code that accesses a database using one method, it might generate 30 SQL statements that takes 5 seconds to run, while another very similar method causes a single SQL statement to be executed that takes less than a millisecond. Both methods have communities of developers behind them who claim that their method is the fastest and best ever. Unless you had the profiler to look at the results, I’m not sure how you would be able to tell the difference.
When they take away the profile, I will miss it greatly. Who knows, I may end up writing my own if they do.
sp_Blitz points us to this article with a very clever, pointed description, “Hey big spender, you have 2 Extended Events sessions running. You sure you meant to do that?”
I sure didn’t mean to do that, but after reading this article I have no clue how to diagnose and correct my problem.
Mike – howdy. This page isn’t the URL that sp_Blitz gives you when you hit the “multiple XE sessions running” warning. You’ll want to read sp_Blitz’s output carefully, and it includes a URL that you can go to.
Sometimes you can just click around and quickly fix a problem. Sometimes, problems require a little more digging in order to troubleshoot – like finding out who set up the XE sessions, what they’re gathering, and why. I sure do wish I could give you all that in a matter of 60 seconds, but it does take a little more digging than that. You’ll need to read a few articles, not just one, and that link in sp_Blitz gives you a landing page with the articles to get started.
Hope that helps!
Brent
Thanks, Brent – I was indeed on the wrong page.