Pop Quiz: Can You Use Your Monitoring Tool?
5 Comments
In the free 30-minute intro calls I do about our SQL Critical Care®, one of the questions I ask is, “Do you have a monitoring tool? And if so, what has it told you about the root cause of the problems you’re facing?”
I either hear one of two things:
- They don’t have a tool, or
- They have a tool and can’t figure out what the problem is
During the engagement, I’ll sometimes ask the admins to open up the monitoring tool and then answer the following questions – not verbally, but actually do it in front of me:
- Find the last time when SQL Server was slow (not from guessing or help desk tickets – use the tool)
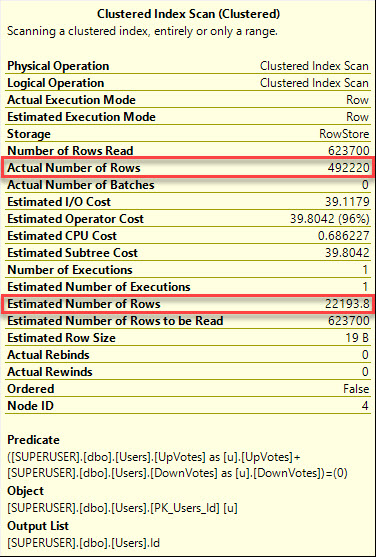
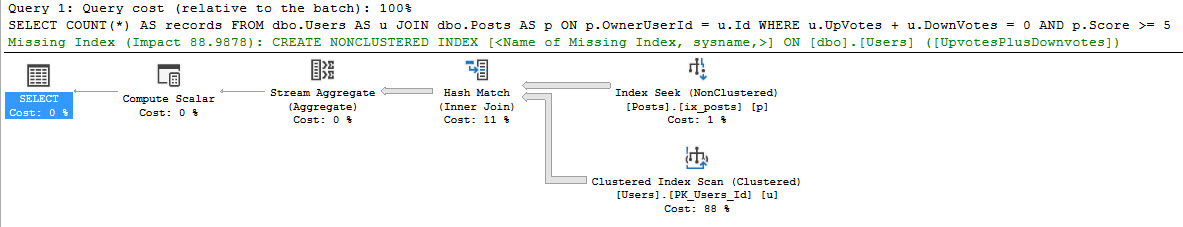
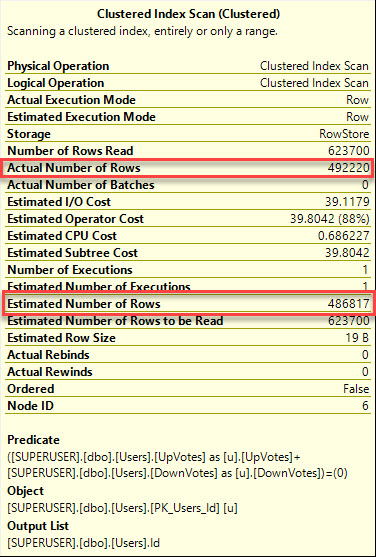
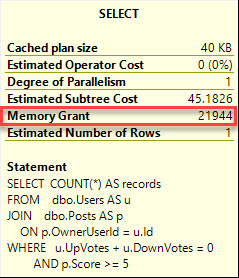
- Find the most resource-intensive queries that were running at that time, and show me their query plans
It turns out that most people can’t do that.
Monitoring tools aren’t intuitive.
There’s no built-in Clippy that pops up when you open the tool and gives you a guided walk-through of what you’re looking for. It’s up to you to read the manual, figure out how to accomplish those tasks, and then train the rest of your team to make sure they can do it, too.
Your monitoring vendor wants to help. Call their support desk or open a support ticket and ask if they offer a guided tour service. All of the monitoring vendors have support teams who can share your screen, take control, and walk you through the app. Have them answer the same two above questions, and take notes while they do it. Then, repeat the process yourself, and get good at it.
It’s not your fault that most monitoring systems are a little hard to use. However, it IS your fault that you’re not an expert at using your tools. You have to learn your monitoring tool the same way you learn SQL Server. Now get in there and sharpen those skills.