Blog

How to count the number of rows in a table in SQL Server

SQL Server
50 Comments

“How many rows exist in a table?”

It seems like such an innocent request. It isn’t too hard to get this information out of SQL Server. But before you open SSMS and whip out a quick query, understand that there are multiple methods to get this information out of SQL Server – and none of them are perfect!

COUNT(*) or COUNT(1)

The seemingly obvious way to get the count of rows from the table is to use the COUNT function. There are two common ways to do this – COUNT(*) and COUNT(1). Let’s look at COUNT(*) first.

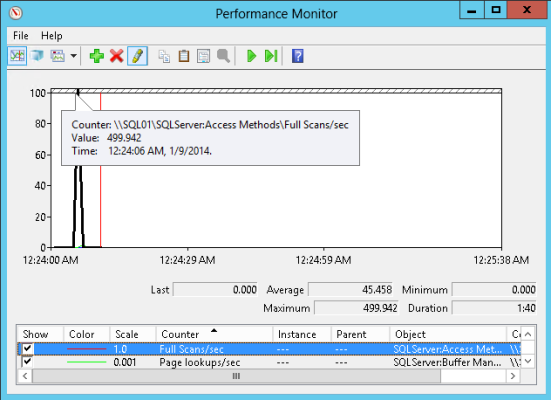
The STATISTICS IO output of this query shows that SQL Server is doing a lot of work! Over 100,000 logical reads, physical reads, and even read-ahead reads need to be done to satisfy this query.

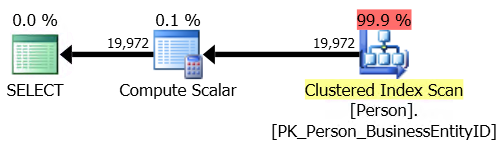
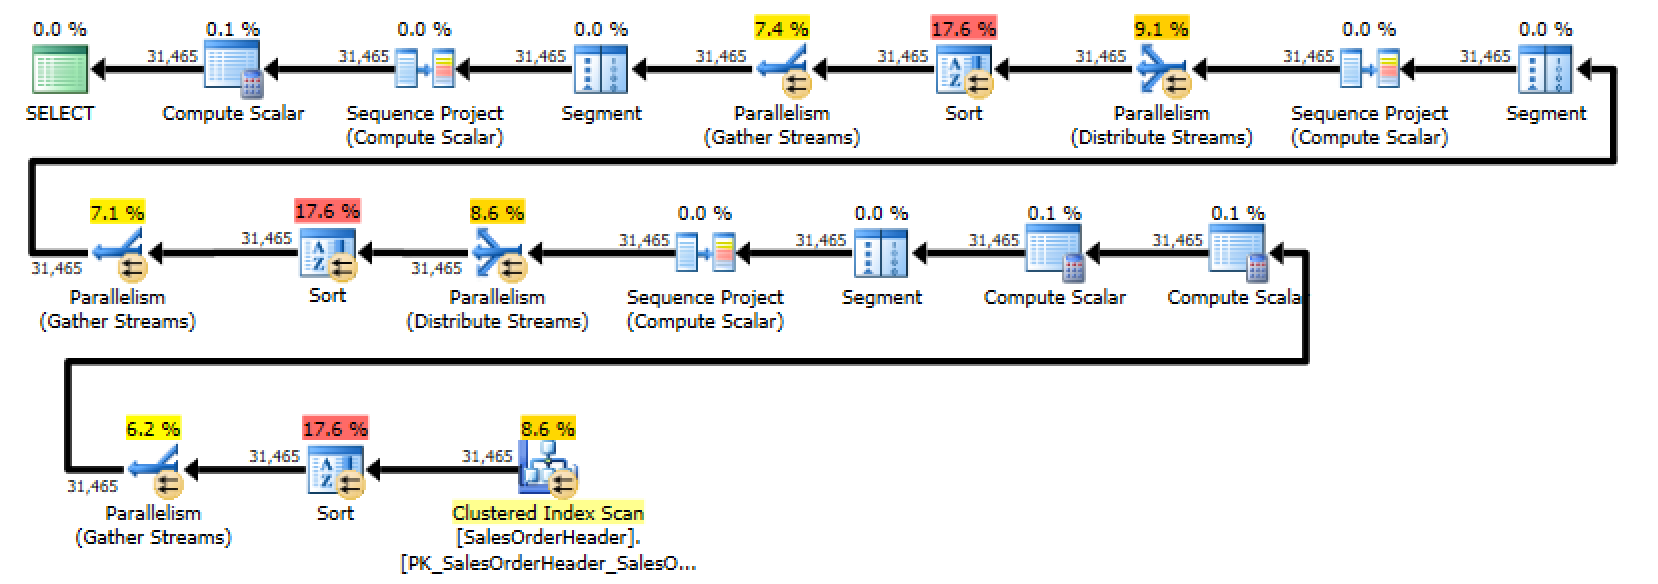
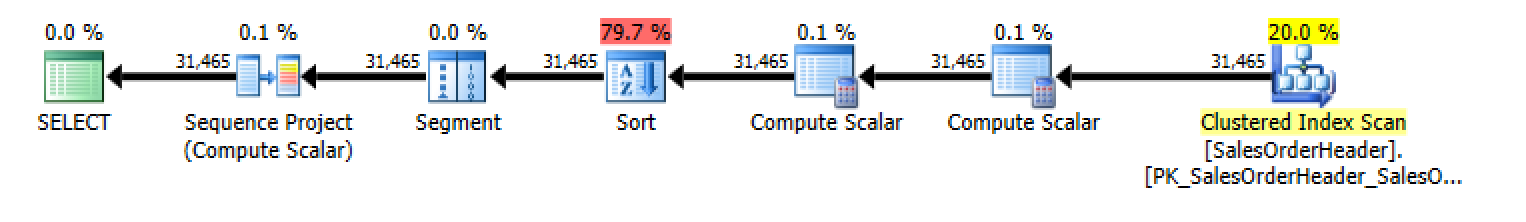
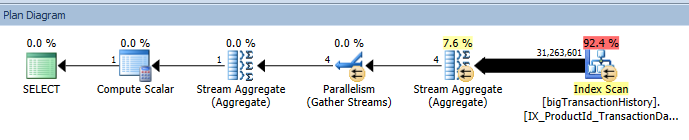
Looking at the execution plan, we can see an Index Scan returning over 31 million rows. This means that SQL Server is reading every row in the index, then aggregating and counting the value – finally ending up with our result set. The cost of this query? 123.910000.

count 1

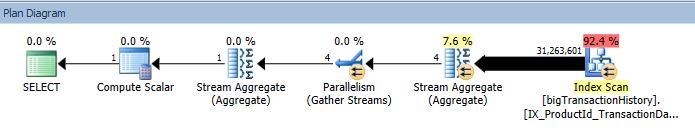
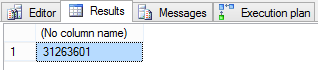
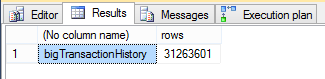
The query results: 31,263,601 rows.

count 2

Now, let’s look at the behavior of COUNT(1).

We can see from STATISTICS IO that we have a large number of logical reads – over 100,000.

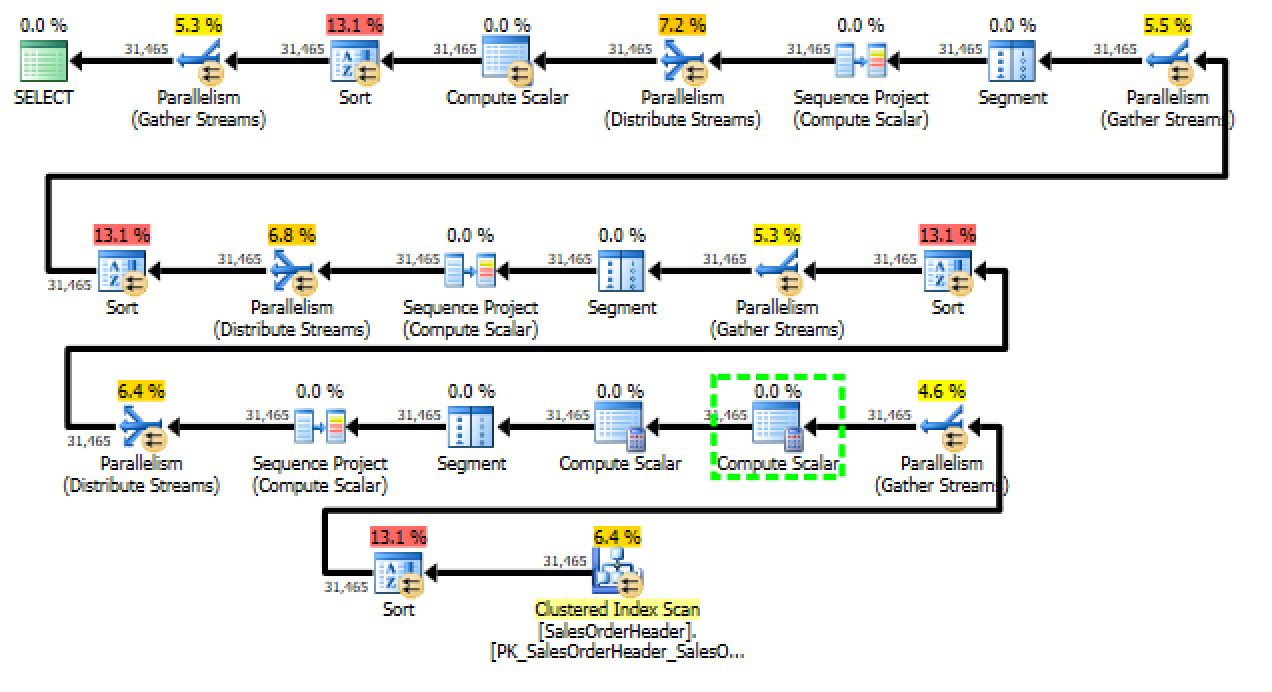
The execution plan again shows an index scan returning over 31 million rows for processing. The query cost is the same, 123.910000.

count 3

The results here are the same – 31,263,601 rows.

count 4

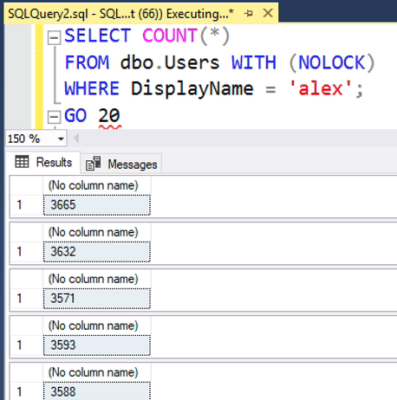
The benefit of using COUNT is that it is an accurate indicator of exactly how many rows exist in the table at the time query processing begins. However, as the table is scanned, locks are being held. This means that other queries that need to access this table have to wait in line. This might be acceptable on an occasional basis, but I frequently see applications issuing these types of queries hundreds or thousands of times per minute.

sys.tables + sys.indexes + sys.partitions

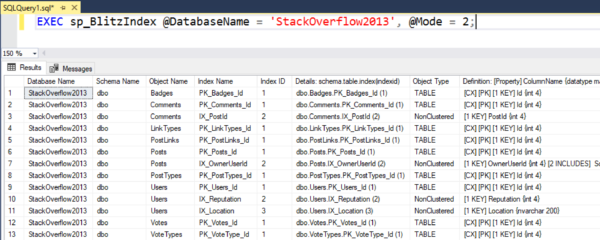
We can join several SQL Server catalog views to count the rows in a table or index, also. sys.tables will return objects that are user-defined tables; sys.indexes returns a row for each index of the table; and sys.partitions returns a row for each partition in the table or index. I am going to query for the table ID, name, and count of rows in all partitions.

The output of STATISTICS IO here shows far fewer reads – 15 logical reads total.

The execution plan is more complex, but much less work – the query cost here is 0.0341384.

count 5

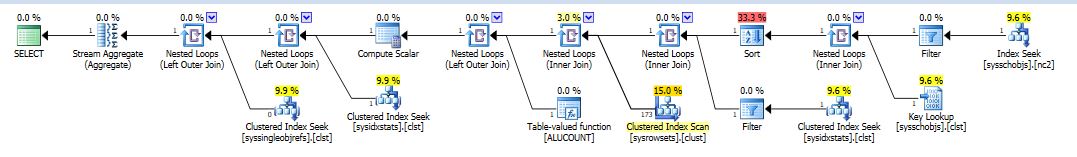
The results of the query are also the same – 31,263,301.

count 6

The benefits of using this method are that the query is much more efficient, and it doesn’t lock the table you need the count of rows for.

However, you need to be cautious when counting the rows on a table that is frequently inserted into or deleted from. The TechNet documentation for sys.partitions.rows says it indicates the “approximate number of rows for this partition”. How approximate? That information isn’t documented. Understand, though, that if you use this method, you potentially sacrifice up-to-the-moment accuracy for performance.

sys.dm_db_partition_stats

A third option is to use the dynamic management view sys.dm_db_partition_stats. This returns one row per partition for an index.

The STATISTICS IO output of this query is even lower – this time, only two logical reads are performed.

The execution plan is less complex than our second example involving the three system views. This query also has a lower cost – 0.0146517.

count 7

The query results are the same as the previous examples – 31,263,301 rows.

count 8

Using this DMV has the same benefits as the system views – fewer logical reads and no locking of the target table. The query is also simpler to write, involving only one object.

But again, the TechNet documentation for sys.dm_db_partition_stats.row_count says it is “the approximate number of rows in the partition”, and when this information is updated is not documented. Here, you are also potentially sacrificing accuracy for performance.

Time to do some digging

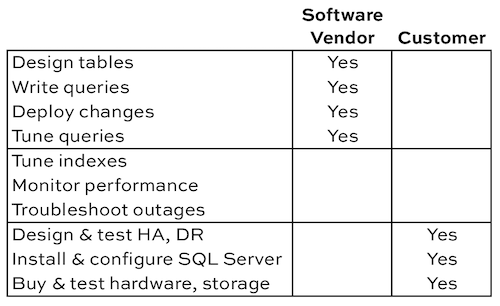
The questions that you need to work with the business to answer are, “How up-to-date must the row count be? What is the business purpose? How often do you insert into or delete from that table, and how often do you count the rows?” If the accuracy of the row count is crucial, work to reduce the amount of updates done to the table. If performance is more important, and the row count could be approximate, use one of the system views.

Wanna learn more tricks for free?

Check out our free T-SQL Level Up online class – we guarantee it’s the best T-SQL training trailer you’ve ever seen:

https://www.youtube.com/watch?v=5RrUSn_qViA

Learn more and take the T-SQL course now.


Why Your Slow SQL Server Doesn’t Need a SQL Consultant (or Does It?)

SQL Server
10 Comments

Your SQL Server is slow – but should you call us in? Jeremiah and Brent had a throw-down the other day, and we figured we’d capture it here on the blog.

Brent Says You Do, and Here’s Why

5. You’ve been blindly throwing money at the problem without results. You’re on a first name basis with your local SAN salesperson. Your server racks are glistening with blue and green lights. But somehow, when users hit your app, they’re not as happy as your sysadmins – or your SAN salesperson. Before you burn another stack of Benjamins, it’s time to get an outside opinion.

brent-ozar

4. You’re doing something for the first time. Sure, you’re pretty good at Googling your way out of trouble, but the company’s starting to make riskier and riskier gambles on data storage. Maybe you should talk to someone who’s faced this problem before.

3. You’re relying on the manual. I love Microsoft as much as the next guy – especially now that they brought out a new ergonomic keyboard – but Books Online doesn’t tell the whole truth. When Microsoft unveils a new feature, they talk about all the positives, but they don’t always disclose the drawbacks. Get a reality check before you bet the farm on PowerFilePivotProRT, and hear what our other clients are doing to accomplish the same goal.

2. You need answers faster. We get together on a Monday, and by end of day Wednesday, you’ve got a prioritized action plan showing you how to make the pain go away by the end of the week. You get the knowledge and confidence to keep going without expensive long-term consultants. You’re really close – you just need our 3-day SQL Critical Care® to unlock the tips and tricks to make it work.

1. Developers can get back to adding features. Your real business isn’t SQL Server administration – it’s adding features to your app to make your end user happier. Bring us in, get the answers, and get back to work.

Jeremiah Says You Don’t, and Here’s Why

5. You’re probably blindly throwing money at the problem without results. Unless a consultant is willing to provide a list of happy customers, there’s no way to verify that they know something. Heck, even if they do provide a list of happy customers, you have no way of knowing that Luanne in IT management isn’t really someone’s Aunt Mavis.

jeremiah-peschka

4. Best practices aren’t universal. Every situation is different and the most complicated scenarios require a deep understanding of business goals, features, and SLAs. Consultants can help you understand best practices, but you’re the only person who knows what’s right in your environment. If you’re doing something for the first time and your Google-fu is running out, you can’t expect much help from outside.

3. Peer pressure shouldn’t change your decisions. We jokingly call this “design by Hacker News”. Just because a startup, our clients, or your next door neighbor are doing something, that doesn’t mean it’s the right fit for you. For many application feature decisions, it’s easy to build two or three prototype solutions and decide on the best one.

2. You need performance yesterday. Rather than wait a few weeks for a reputable consultant to show up, have you considered buying memory? If you’re on SQL Server Standard Edition and you have less than 64GB of memory, just buy more RAM. If you’re on EE and you have less RAM than you have data, why not max out that server with 16GB DIMMs; they’re cheap and you can solve most code sins with memory. Heck, we even recommend buying memory as one of the first ways to solve problems quickly.

1. Developers: understand your features. While developers should be adding features, they also need to understand the consequences of those features. Some functionality that’s possible in SQL Server requires an understanding of how to write queries to take advantage of those features – filtered indexes, indexed views, and ColumnStore indexes immediately spring to mind. The best way to understand a feature is to get in the database, make it work, and then make it work fast.


PREEMPTIVE_OS_WRITEFILEGATHER and Instant File Initialization (IFI)

SQL Server
33 Comments

The other day I was running a script I’d written to expand out some tables in the AdventureWorks sample database for some testing. The script was taking a long time, and at first I thought I was just spoiled because I usually run my tests on my laptop, whose storage is backed by SSDs. In this case I was running my test against a SQL Server instance up in AWS.

After a delicious fifteen minute coffee break, I realized something was wrong– it STILL wasn’t done. I grabbed sp_BlitzFirst® to do a quick check and see if my storage was really THAT slow.

I ran sp_BlitzFirst® with a 60 second sample, like this:

Here’s what I saw (click for a larger version):

Lack of Instant File Initialization

PREEMPTIVE_OS_WRITEFILEGATHER means slow file growths

In a 60 second sample, I’d been waiting for PREEMPTIVE_OS_WRITEFILEGATHER for 36 seconds. Whoops!

The script I was running was making tables larger. The database was out of room, and was growing the data file in small autogrowth increments. Each of these automatic growths was stopping to “zero out” the files, because I hadn’t enabled Instant File Initialization in SQL Server.

How I enabled Instant File Initialization

My test instance is set up a bit uniquely– it uses UNC paths for the SQL Server databases. This is supported in SQL Server 2012, and I was testing it out in a Windows Failover Cluster. (If you use shares for files, you need to be very careful about redundancy and availability of course, but that’s a topic for another post.)

I’d forgotten to enable Instant File Initialization for the SQL Server Service on the server that hosted the file shares! Wherever Windows will actually grow the files, the SQL Server Service account needs the “Perform Volume Maintenance” tasks right.

Using the Local Security Policy to Grant “Perform Volume Maintenance Tasks”

Here’s how to grant the rights:

First, open the local security. I usually do this by running the command secpol.msc, but you can also find this in the “Administrative Tools” menu.

Opening the Local Security Policy

Then navigate to Local Policy -> User Right Assignment -> Perform Volume Maintenance Tasks.

Perform Volume Maintenance Tasks

Add the SQL Server Service account. The change will take effect the next time you restart SQL Server.

Grant IFI to the SQL Server Service Account

So, did it improve my performance?

Heck yeah, it did! On the first run I got tired of waiting and killed my expansion script after 20 minutes and just dealt with the rollback. After enabling Instant File Initialization on fileserver that holds the shares where my database files live, the expansion script finished in four minutes and 48 seconds. Shazam!


Using SQL Server’s Table Valued Parameters

SQL Server
36 Comments

Table valued parameters (TVPs) are nothing new – they were introduced in SQL Server 2008. TVPs are a great way to get data into SQL Server, and yet very few developers use them.

Getting Started with TVPs

In order to get started, we need to create a user defined type. This type is necessary so we have a well defined interface between SQL Server and the outside world – you can just pass a bunch of junk in as a parameter to SQL Server… well, you could, but that’s called XML.

Let’s create that user defined type:

Now we can create variables using the dbo.SalesPersonTerritory type whenever we want. It’s just this easy:

Using Table Valued Parameters With Stored Procedures

Having a special table type is really convenient, but it doesn’t help if you can’t use it, right? Let’s assume that you’re calling a stored procedure and you’re sick of joining lists of strings on the client and then splitting them apart on the server. What you really need is the ability to pass a fully fledged table across the wire and into SQL Server.

This is relatively easy to accomplish. From C#, the code would look something like this:

That’s really all there is to it.

C# Tips for Table Valued Parameters

There are a few other things that developers can do to make their life easier when working with table valued parameters. A DataTable, just like a table in SQL Server, should have types declared for all columns. While it’s easy enough for developers to create these tables on the fly, that won’t cut it in production code – boiler plate code means that people can make mistakes.

To make life easier, developers can create methods in their application to make it easier to work with table valued parameters. We can create a special chunk of code that will make it easy for developers to instantiate and use a DataTable that matches up with the table valued parameter.

Seasoned developers will even create methods that let them drop a list of objects straight into an appropriate DataTable. There are many different ways to build convenience methods into code and make it easy for development teams to work with TVPs.

For simple data type matching, this works well. If you’re dealing with more complex data types, you’ll want to check out SQL-CLR Type Mapping to make sure you get the right data type. You’ll notice that some datatypes (varchar for instance) have no direct corollary in the .NET Framework. Sometimes you just have to lose some fidelity – make wise decisions, it gets crazy out there.

These same techniques can be used with a string of ad hoc SQL, too. TVPs aren’t limited to stored procedures, they can be used anywhere that you are executing parameterized code.

Gotchas of TVPs

There are two big gotchas with TVPs.

First: the table variable that comes in as a table valued parameter cannot be changed. You’re stuck with whatever values show up. No inserts, updates, or deletes can be applied.

Second: table valued parameters are still table variables – they get terrible cardinality estimates.

We can get around both of these problems with the same technique – copy the contents of the TVP into a temp table. Although it adds an extra step to using the TVP, I’ve found that copying the contents of the TVP to a temporary table lead to better execution plans and much less confusion during development and troubleshooting.

Summary – Using Table Valued Parameters isn’t Hard.

TVPs aren’t difficult to use. They’re just different and require a different mindset. By using TVPs, developers can pass many rows into a stored procedure and create far more complex logic and behavior that is possible using only single parameter values.


Statistics Matter on Temp Tables, Too

SQL Server, TempDB
18 Comments

Temp tables are like real tables, just a little tricker.

When you’re starting out writing TSQL, it’s easy to want to do all your work in a single query. You learn about derived sub-queries, CROSS APPLY statements, and common table expressions. Suddenly, each of your queries is so complex that you hardly know what you’re doing.

But complex TSQL can be quite fragile. Small mis-estimations in parts of the plan can cause things to go very much awry in other regions of the plan.

Temp tables can help performance!

One treatment for slow, complex TSQL is to break it into multiple steps. You create a temp table, populate it, and reference it in future queries. This can lead to improved estimates and reliability, because temporary tables can have column and index related statistics. Those statistics help the optimizer estimate how many rows will be returned at different points along the way.

But this tuning technique isn’t foolproof. It’s easy to forget that statistics can be tricky– just like with real tables. Let’s take a look and prove that statistics issues from “normal” tables also matter on temp tables.

Out of date statistics on temp tables can hurt performance

The first step is to load up a temp table with some rows:

We now have:

  • 100K rows where TempValue=1
  • 10K rows where TempValue=2

Now let’s say I query the temp table in some way. My where clause is for a specific TempValue. The act of running this query causes a column level statistic to be created on the TempValue column:

Correct Statistics Estimate-Query1

We can see the statistic, too. This code is modified from Books Online and uses a DMV available in SQL Server 2012 SP1 and higher:

Statistics Super Fresh Not Modified

I continue on, and insert 11K rows for TempValue=3:

At this point I have:

  • 100K rows where TempValue=1
  • 10K rows where TempValue=2
  • 11K rows where TempValue=3

Now I run another query which wants to look ONLY at the 11K rows where TempValue=3. SQL Server completely mis-guesses how many rows will be returned– instead of 11K rows, it guesses that I’ll just get a SINGLE row:

Incorrect Statistics Estimate-Query2

Looking at the statistics, we can see why– the statistic that was created when I ran my first SELECT query wasn’t triggered to update:

Statistics-Modification Counter

Let’s look at the histogram

When we look at the histogram for the statistic, it confirms that it doesn’t know about any rows with a TempValue higher than two:

Click me to see a bigger version

Bad Statistics can lead to bad optimization

If I was joining from this temp table to other large tables, it might cause a very large data skew in my plan– and it could cause big problems. The optimizer might select inefficient joins, not allocate enough memory, and choose not to go parallel if estimates are skewed too low.

Temp tables are a great tool to use, but remember a few key rules:

  • Column level statistics will be created for you when you run queries using the temp table
  • If you modify the temp table in multiple steps, those statistics may get out of date

In complex procedures, manually creating and updating statistics on columns or indexes can save you time and improve execution plan quality.

Could Trace Flag 2371 Help?

If you find that you have a lot of existing code that has this problem, Trace Flag 2371 may help. This trace flag is available as of SQL Server 2008R2 SP1 and higher, and it changes the default threshold for when statistics automatically update.

The net effect of the trace flag is to cause statistics updates to happen more frequently on large tables. You must turn it on server wide for it to take effect — it doesn’t work for individual sessions.

I’m not a huge fan of enabling any trace flags unless you’re solving a specific problem, and documenting it. This trace flag is not very widely used in my experience, so flipping it on puts you in a small subset of people. If you start hitting wacky issues and need to resolve them, suddenly the trace flag gives you a whole new dimension of complexity. So please don’t think of this trace flag as “preventive medicine” — only use if it you don’t have other good ways to solve the problem.


What If You Knew The Server Would Crash Today?

SQL Server
7 Comments

This morning you woke up with a terrible premonition – you were absolutely sure your most important production database server was going to crash today.

What would you do?

Step 0: stop for coffee, because it's gonna be a long day.
Step 0: stop for coffee, because it’s gonna be a long day.

Here’s a quick list of places to start:

  1. Identify where the most recent backups are kept
  2. Make sure the backup schedule and frequency lines up with what the business wants
  3. Make sure the backups are getting offsite
  4. Make sure the monitoring software is watching this server, and sending me alerts

When was the last time you made a list like this and checked it twice? Do it this week, and schedule yourself a recurring task in your favorite to-do software to check this every quarter.

Because you’re not going to get these visions.


Satya Slips a SQL Server Standard Secret?

SQL Server
3 Comments

Everybody wants to know the next SQL Server release date, pricing, and feature lists, but anybody who knows those facts is bound by non-disclosure agreement and can’t say it publicly. Every now and then, though, we get lucky and someone from Microsoft slips up. That’s why I pay particular attention to Microsoft interviews as we approach release dates.

Microsoft’s perhaps-next-CEO new CEO Satya Nadella sat down for an interview with Gigaom. It included this interesting line:

…everybody who buys a SQL server, in fact in this release, gets an always-on secondary in Azure.

Satya Nadella
Satya Nadella

Well isn’t that special? Satya would be the guy to know, too – he used to run the Server and Tools group (which includes SQL Server), and he’s since been promoted to Cloud and Enterprise (which includes both SQL Server and Azure).

Will SQL Server 2014 Standard Include AlwaysOn AGs?

Right now, SQL 2012 only offers AlwaysOn Availability Groups in the expensive Enterprise Edition. 2012 Standard Edition’s closest HA/DR feature in Standard Edition is database mirroring, but that’s listed on the Walking Dead Deprecated Features List.

But what if Standard Edition includes a crippled AlwaysOn AG? Currently, SQL Server 2012 Standard Edition includes a crippled version of database mirroring that only offers synchronous replication, not asynchronous. It’s less desirable for many customers due to the transaction slowdowns if you have to commit at both servers before a transaction is considered committed. Microsoft could treat Standard AGs the same way – only offering the less-desirable version in Standard.

Standard’s AlwaysOn AGs could also be limited in numbers. While 2014 Enterprise will offer up to 8 readable replicas, perhaps Satya’s “an always-on secondary” means Standard gets exactly one secondary.

Satya could even mean that only an Azure-based replica is included – not an on-premise one. This would be an interesting turn of events because it would require vendor lock-in to just Microsoft’s cloud rather than Amazon’s or a colo vendor.

What Did Satya Mean by “Gets an AlwaysOn Secondary”?

Could he mean that Microsoft is really willing to include the AlwaysOn virtual machine? Like you get some kind of licensing key that unlocks one free Azure VM running SQL Server 2014, and an easy way to set up HA/DR between your on-premise SQL Server and your new free virtual machine?

This would be revolutionary because Microsoft would be seen as a real vendor partner to SQL Server users. Instead of buying expensive hardware and data center space to protect your SQL Servers, you could just rely on Microsoft’s cloud.

At first glance, this would look like Microsoft going into competition with server vendors like Dell, HP, and IBM Lenovo, plus competing with cloud vendors and data centers like Amazon and Rackspace. But hey, that’s exactly what Microsoft has been doing lately – going directly into competition with vendors that used to be partners. The Surface competes with laptop partners, and the Nokia deal competes with Windows Phone partners. This could just be the next step, especially given another Satya quote in the interview:

So one of the things is, I have an always-on database, where is it running? The always on database is kind of on your private cloud and kind of on Azure and so the distinction even goes away.

If Microsoft can move your database into their cloud, they stand to sell more virtual machines and services. Maybe your database’s disaster recovery is becoming Microsoft’s loss leader. I’d love this, because we all need to do a better job of protecting our databases from disaster.

Or DID Gigaom Misquote Satya?

Maybe Satya said “Everybody who buys SQL Server Enterprise Edition gets an AlwaysOn Secondary in Azure.” After all, in this one quote, Gigaom managed to mis-capitalize both SQL Server and AlwaysOn. It’s not inconceivable that the quote was butchered.


What Do You Ask the Leaving DBA?

SQL Server
9 Comments
The last DBA had an unfortunate accident in Alaska.

When the database administrator turns in her notice, what questions should you ask her in her last couple of weeks?

I’m assuming, of course, that it was a friendly departure and you’ve got the full two weeks to have good conversations.

Or maybe the DBA is about to go on vacation, and you need to quickly get up to speed about things that might break while they’re gone.

One of my clients’ DBAs turned in their resignation, so I was presented with this very task. I haven’t done it in a while, so I asked Twitter, and here’s what I got:

http://twitter.com/BrightByNature/status/422792839345364992

I kind of expected answers like that – a lay of the land, and Buck Woody’s runbook is a good example – but there were so many good creative ideas:

When you look at someone else’s server, it’s so easy to think, “This guy couldn’t have known what he was doing – nobody should ever set this trace flag or this database option or use this cumulative update.” Maybe not, though – maybe it’s critical to making the application work.

How many of us left little snippets of code around that ended up becoming mission-critical? Often we don’t have source code control on these, either.

http://twitter.com/BBassic/status/422793906175344640

Does the company even have one?

Have you tested a restore lately?

And a followup – are you getting value out of it, or have you just set up email rules to bozo-bin all of the monitoring emails? It helps to know what to expect when the emails start coming your way.

Wow – that’s a fantastic answer. Often we just didn’t have the time to automate all of our problems, and we know that the flux capacitor will leak if we don’t clean it out weekly. Followed up with:

Now might be a good time to get that project approved.

Being a DBA takes soft skills. Getting this inside info on the squeaky wheels helps me prepare for the incoming support requests. Which brings me to:

And I’d follow that up with, “Why are you leaving?” Sometimes that helps reveal some of the biggest land mines.


UPDATE STATISTICS: the Secret IO Explosion

I first knew something was up when I looked at the job history for a simple maintenance plan. It had two steps:

  1. Rebuild all the indexes in the database – this took 10 minutes each night.
  2. Update statistics – this took 2-3 hours each night.

What was going on? Statistics in SQL Server are small, lightweight objects. Indexes are larger and contain more data. Why would updating statistics take so much longer?

Maintenance Plans light the fuse

I love the concept of maintenance plans, but I don’t love the way all the tasks are set up.

In the case I was looking at, the Update Statistics task was being used with two values that are set by default:

  • Run against all statistics
  • Update them with fullscan

Maintenance Plan Update Stats

“All” statistics means that both “column” and “index” statistics will be updated. There may be quite a lot of statistics — most people leave the “auto create statistics” option enabled on their databases, which means that queries will dynamically cause the creation of more and more statistics over time.

Combined with “fullscan”, updating all statistics can become a significant amount of work. “Fullscan” means that to update a statistic, SQL Server will scan 100% of the values in the index or column. That adds up to a lot of IO.

Why ‘SELECT StatMan’ repeatedly scans tables

If SQL Server needs to update column level statistics for the same table, it could potentially use a single scan and update multiple stats, right?

Because of the runtimes I was seeing, I was pretty sure that wasn’t happening. But we can take a closer look and see for ourselves.

In our maintenance plan task, if we hit “View TSQL”, a window pops up showing us the comamnds that the plan will run. (I love this feature, by the way!) We will use one of these commands to test things out in a bit.

Maintenance Plan Generate TSQL

First, let’s make sure we have some column level statistics on our database. It already has indexes and their associated stats. To create some column level stats, I run these queries:

That will create two “auto” stats what start with “_WA_Sys”, and two stats that I named myself. To check ’em out and see ALL the index and column stats on the table, we run:

UPDATE STATISTICS-sp_helpstats

Sure enough, this shows us that we have seven stats total– three are related to indexes.

Alright, time to run that sample command excerpted from our maintenance plan. I start up an Extended Events trace to capture IO from sp_statements completed, then run the command the maintenance plan was going to use to update every statistic on this table with fullscan:

Here’s the trace output –click to view it in a larger image:

Update-Statistics-Extended-Events-Trace-IO

Looking at the Extended Events trace output, I can see the commands that were run as well as their logical reads. The commands look like this:

The “logical_reads” column lets me know that updating four of these statistics had to do four separate scans of my table– and three of them are all on the Title column! (Doing a SELECT * FROM Person.Person shows 5,664 logical reads by comparison.)

IO was lower for statistics related to nonclustered indexes because those NC indexes have fewer pages than the clustered index.

A better way to update statistics: Let SQL Server pick the TABLESAMPLE

If you just run the TSQL command ‘UPDATE STATISTICS Person.Person’ (without telling it to scan all the rows), it has the option to do something like this:

It dynamically figures out a sample size by which to calculate results! (It can pick a variety of options– including scanning the whole thing.)

How to configure faster, better statistics maintenance

Avoid falling for the pre-populated settings in the “Update Statistics” task in the maintenance plan. It’s rare to truly need to use FULLSCAN to update stats in SQL Server, and even when cases where it’s justified you want to implement that with statements targeting the individual statistics to update. The basic “UPDATE STATISTICS Schema.TableName” command is pretty clever– the issue is simply that Maintenance Plans don’t make it easy for you to run that!

Unfortunately, if you use maintenance plans there’s no super simple solution– it forces you to specify either fullscan or a specific sample. There’s no way to just use the basic “You compute the minimum sample” with that task.

You’ve still got good options, they’re just a few more steps:

  • You could use a t-sql related task or a custom SQL Agent job to run sp_updatestats
  • You could use a free index and statistics maintenance script. The example I’ve linked to is super clever, and avoids updating statistics where it has just rebuilt an index!
  • You could also let auto update stats take care of the issue– that’s often just fine on small databases or where there aren’t major data fluctuations

And each of those options should chew up less IO than updating all index and column statistics with FULLSCAN.


Reporting in Production: SQL Server (video)

SQL Server
1 Comment

Everyone wants reports but nobody wants to build out a separate reporting server. What options do you have short of throwing up your hands in defeat? Join Jeremiah to learn about four SQL Server technologies that help with reporting in production. This session is for DBAs and developers looking for a place to get started with reporting against SQL Server.

https://www.youtube.com/watch?v=dmWwfb_ZjYo

For the links and scripts, check out the Reporting in Production: SQL Server page.


Exploring the Magic of the Plan Cache

The plan cache holds a lot of secrets about what’s going on inside SQL Server. In the First Responder Kit we shared one of our plan cache scripts to find the top resource consuming queries. That query works well, but over time we’ve added some additional functionality to the query. I figured it was time to share the new query that we’re using to analyze SQL Server performance.

Our existing query looks at individual query stats, but it doesn’t take into account stored procedure or trigger execution stats. During our SQL Critical Care® checks, we’ve found it helpful to look at both procedures and triggers to figure out if they were causing problems for overall server health.

What Are We Looking At?

The original query just looked at sys.dm_exec_query_stats and looked at average and total metrics across CPU, duration, and logical reads.

Plan cache query: classic flavor


This was a helpful approach, but over time it’s become apparent that we needed to look at more than just individual statements – what if a single procedure was causing problems that only show up in aggregate?

The Bigger Picture

To get a view of the bigger picture, we added in two more DMVs – sys.dm_exec_trigger_stats and sys.dm_exec_procedure_stats. This gives us a big picture view of what’s going on inside SQL Server – the only thing that would make this better would be a DMV for function execution stats.

To avoid skewing results, data is aggregated by the query_hash – unfortunately this means the queries won’t work against SQL Server 2005. Not only do we rank queries by CPU, IO, duration, and execution count, but a second level of ranking is provided that ranks queries within their logical grouping – by statement, procedure, and trigger. If you want to see what your most expensive trigger is doing, it’s easy enough to make a quick change to the query.

Check it out:

New and Improved Output

Try it out – get sp_BlitzCache® in the usual way – by agreeing to our crazy terms of service, selling your email address to a foreign government, and clicking “download”.

Using the Query

This query is easy enough to start using right way – just download the file and run it. Once you’re familiar with it, scroll to the bottom and you’ll see two separate queries you can run. The first is suitable for pasting into Excel – it has no query plan and the SQL text is shortened to easily paste into a single cell. The second query has everything that you want.

Since data is dumped into a temporary table during analysis, it’s easy to keep re-querying the temporary table as you re-sort data or refine what you’re looking for.


Watch Brent Tune Queries

SQL Server, Videos
17 Comments

Ever wonder how someone else does it? There’s no right way or wrong way, but in this 20-minute session, you can peer over Brent’s shoulder (virtually) while he takes a few Stack Overflow queries, tries various techniques to make them faster, and shows how he measures the before-and-after results.

https://www.youtube.com/watch?v=9G89Q66MsyI

For the links and scripts, check out the Watch Brent Tune Queries page.


Did Microsoft Stop Releasing SQL Server Service Packs?

SQL Server
47 Comments

Check out SQLServerBuilds.blogspot.com, a site that lists cumulative updates and service packs. Here’s a remixed version:

SQL Server Service Pack Release Dates

The first service pack seems to come out fairly quickly, but after the first one, it’s a year or more. Makes sense – you find a lot of bugs quickly, right?

Microsoft released at least one service pack per year, but … not last year. 2013 saw no service pack releases, and it’s been 442 days since the last service pack (SQL 2012 SP1) shipped.

Is Microsoft taking too long? Let’s look at each current version missing a service pack:

  • SQL 2012 has been waiting 442 days for SP2 – but that’s actually right in the range for normal SP2 releases. SQL Server 2008 went 540 days before SP2.
  • SQL 2008R2 has been waiting 545 days for SP3 – but that’s also less time than it took for SQL 2005 to get its SP3, so no cause for panic here yet.
  • SQL 2008 has been waiting 839 days for SP4 – here we actually do see some cause for alarm, because no supported SQL Server version has gone that long without a service pack.

442-DAYSWhen you step back and take the long view, we’re not really in that bad of shape yet – but I can see why people would be disturbed that no service packs have been released in over a year. It might just be a timing coincidence, or it might be something more.

But it does beg the question – what if Microsoft just stopped releasing SQL Server service packs altogether, and the only updates from here on out were hotfixes and cumulative updates? How would that affect your patching strategy? Most shops I know don’t apply cumulative updates that often, preferring to wait for service packs. There’s an impression – correct or not – that service packs are better-tested than CUs.


Full Scans/sec Doesn’t Mean What You Think

SQL Server
9 Comments

When is a “Full Scan” not a Full Scan?

The performance counter “Full scans/sec” sounds pretty scary. If you see spikes in this counter, you’re likely to think that your queries are madly scanning all the data in your tables– there are no stylish, well performant seeks, just drunken queries spewing IO everywhere.

If you look up the counter in SQL Server Books Online, it seems to confirm that. Full Scans/sec is defined as the “Number of unrestricted full scans per second. These can be either base-table or full-index scans.” It’s not just a FULL scan, it’s “unrestricted.” That’s sounds really bad, right?

Not necessarily.

Let’s take a look. You can warm up your test SQL Server instance and restore your favorite sample database to play along with the sample queries below using the AdventureWorks2012 database and perfmon.

Test 1: A full scan

Here’s our first test query. This query technically does an index scan, but it’s a very efficient partial scan– it uses just 3 logical reads to hop to the end of the index and grab the last value.

500 of these finish in less than one second. Here’s what the plan looks like. (If you look deep into the properties of the scan operator, you’ll find that it says that it’s a special “Backwards” scan for speed.)

An optimized clustered index scan

In perfmon, I can see that this query did the following:

  • 500 Full Scans/sec (SQL Server:Access Methods)
  • 1,908 Page lookups/sec (SQL Server: Buffer Manager – this is logical reads)
  • 0 Page reads/sec (SQL Server: Buffer Manager — this is physical reads and the data was already in memory)

I see full scans

Hmm, so what we’ve seen here is that we can make the full scans/sec counter spike with a scan that isn’t really “unrestricted” or “full” in the way that we might think.

Full scan does NOT really mean that it read the entire index! (I’m not the first to discover this, of course. Michael J Swart gives a nice example of a TOP query doing something similar in this post on different types of scans.)

Test 2: a “worse” full scan

Let’s make our test query a bit nastier. This new version of the query is not such a great citizen — it reads 3,820 pages on each run (as opposed to 3 reads from the query before):

This is also a scan but it does more IO. 500 of these take five seconds or so– much longer. Here’s the plan:
This scan does more io

When we run this, we see that:

  • Full scans/sec only spikes up to a max value of 97 this time– it’s much LOWER, even though we hit the SQL Server with a nastier query. We just ran this from a single SQL Server session, so it didn’t spike up as much and took longer– but it certainly isn’t better than the first query.
  • Page lookups/sec spikes up to a max value of 362,161. Each run of the query is doing more logical IO– and the fact that this query does more work shows up much more clearly here.
  • Page reads/sec just has a slight bump and at one point 8 reads/sec are registered. The data was already in memory, so this wasn’t really impacted at all.

Second sample of full scans
The “worse” query didn’t spike the full scans/sec counter, but it did more IO. If we were designing monitoring around the full scans/sec counter then we’d probably just throw an alert on the incident that actually had less impact.

Pulling it all together

Monitoring is a tricky business. Performance counters tell you a lot about SQL Server– but if you monitor on individual thresholds on many performance counters, you’ll end up with false alarms and more questions than answers. The counters shown in this post can be useful for baselining, trending, and interpreting in a larger context of information, but by themselves they don’t tell you a full story.

If you’re getting frustrated with perf counters and want to learn what’s really dragging down your SQL Server, check out our free webcasts, our free scripts, or our performance tuning training videos.


Improving the Performance of Backups

There will come a time when your database backups will not be as fast as you would like them to be. Over time, the volume of data you’re storing will grow, and backups will take longer – but your weekly or daily maintenance windows don’t grow as well. Backups can be resource-intensive, using I/O and network resources – and if they’re running when users are trying to work, the users may notice the performance impact.

Here are two ways to make your backups go faster.

Option A: Full and Differential backups

A typical backup scenario that I see is a full backup daily and, if the database is in Full recovery model, log backups throughout the day. But what happens when that full backup begins to take hours, instead of minutes? A differential backup may help.

A full backup contains all the data in the database, and enough of the log to recover it. A differential backup contains only the extents (groups of 8K data pages) that have changed since the last full backup. Because a differential is usually smaller than a full backup, it can take less time to complete.

The commands to run the backups are very similar. A full backup:

To perform a differential backup, you add the WITH DIFFERENTIAL option:

Combining full and differential backups throughout the day or week can reduce the time you spend waiting for backups to complete. There are two scenarios I usually see. The first is a full backup one or two days per week, with differential backups on the other days, and regular transaction log backups. This makes sense when a full backup every day would be too time-consuming. The second is a full backup daily, differentials every few hours, and regular log backups. This usually makes sense when fast recovery is necessary, and it would be better to be able to restore a full backup, a differential backup, and a subset of log backups – rather than the full backup and all log backups for the day.

This can add a layer of complexity to a restore strategy – instead of restoring the last full backup and ensuing logs, the most recent differential must be accounted for as well. You should practice this restore sequence so you understand the steps involved. You also need to monitor the size of the differential backups closely – depending on the rate of change in the database, you may not be saving as much space as hoped.

However, when your time to do backups and have them impact your users is shrinking, yet database size is growing, the full + differential strategy can be used effectively.

Option B: Backing up to multiple files

The standard database or log backup is done to one backup file:

When a backup is written to one file, one thread is assigned. You can back up to multiple files – in one or more locations – and multiple threads will be used. This can make a backup take less time – sometimes significantly. Here’s the command to create a full backup across four disks:

Having multiple backup files can make a restore more complicated. All of the files must be available, and all must be referenced in a restore session. To restore the backup files shown below, use the following command:

However, the benefits can be significant. I performed five tests – one file on one disk, two files on one disk, four files on one disk, two files on two disks, and four files on four disks. The results show that adding more disks decreases the backup time.

backup time chart

Note: these tests don’t cover all scenarios. If you have a group of disks in a RAID 5 or RAID 10 array, multiple threads writing to multiple files could be faster than one thread and one file. Lesson learned: test your backup files in your environment to determine what is best for you!


sp_Blitz® v32: Emailing, Serializable Locking, Simultaneous Agent Jobs, and More

SQL Server
9 Comments

The latest version of our SQL Server health check stored procedure is out today. Here’s what we’ve added in the last couple of versions – big thanks to the folks who keep making this even better for the community:

Changes in v33 – January 20, 2014:

  • Bob Klimes fixed a bug that Russell Hart introduced in v32, hahaha. Check 59 was false-alarming on Agent jobs that actually had notifications.

Changes in v32 – January 19, 2014:

  • Russell Hart fixed a bug in check 59 (Agent jobs without notifications).
  • Added @EmailRecipients and @EmailProfile parameters to send the results via Database Mail. Assumes that database mail is already configured correctly. Only sends the main results table, and it will not work well if you also try to use @CheckProcedureCache. Execution plans will not render in email.
  • Fixed a bug in checks 108 and 109 that showed poison waits even if they had 0ms of wait time since restart.
  • Removed check 120 which warned about backups not using WITH CHECKSUM. We fell out of love with WITH CHECKSUM – turns out nobody uses it.
  • Added check 121 – Poison Wait Detected: Serializable Locking – looking for waits with %LCK%R%. Happens when a query uses a combination of lock hints that make the query serializable.
  • Added check 122 – User-Created Statistics In Place. There is nothing wrong with creating your own statistics, but it can cause an IO explosion when statistics are updated.
  • Added check 123 – Multiple Agent Jobs Starting Simultaneously. Ran into an issue where dozens of jobs started at the exact same time every hour.

Changes in v31 – December 1, 2013:

  • Dick Baker, Ambrosetti Ltd (UK) fixed typos in checks 107-109 that looked for the wrong CheckID when skipping checks, plus improved performance while he was in there.
  • Dick also improved check 106 (default trace file) so that it will not error out if the user does not have permissions on sys.traces.
  • Christoph Muller-Spengler @cms4j added check 118 looking at the top queries in the plan cache for key lookups.
  • Philip Dietrich added check 119 for TDE certificates that have not been backed up recently.
  • Ricky Lively added @Help to print inline help. I love his approach to it.
  • Added check 120 looking for databases that have not had a full backup using the WITH CHECKSUM option in the last 30 days.

Go find ugly surprises inside your SQL Server now.


How to Query the StackExchange Databases

SQL Server
30 Comments

Update – October 2015 – You can download a Torrent of a database (rather than a data dump) now.

Most of my demos involve my favorite demo database: Stack Overflow. The Stack Exchange folks are kind enough to make all of their data available via BitTorrent for Creative Commons usage as long as you properly attribute the source.

There’s two ways you can get started writing queries against Stack’s databases – the easy way and the hard way.

The Hard Way to Query StackOverflow

First, you’ll need to download a copy of the most recent XML data dump. These files are pretty big – around 15GB total – so there’s no direct download for the entire repository. There’s two ways you can get the September 2013 export:

I strongly recommend working with a smaller site’s data first like DBA.StackExchange. If you decide to work with the monster StackOverflow.com’s data, you’re going to temporarily need:

  • ~15GB of space for the download
  • ~60GB after the StackOverflow.com exports are expanded with 7zip. They’re XML, so they compress extremely well for download, but holy cow, XML is wordy.
  • ~50GB for the SQL Server database (and this will stick around)

Next, you need a tool to load that XML into the database platform of your choosing. For Microsoft SQL Server, I use the Stack Overflow Data Dump Importer.

The SODDI user interface expects two things:

  1. The XML files have to be stored in a very specific folder name: MMYYYY SITEINITIALS, like 092013 SO. SODDI will import multiple sites, and it creates a different schema for each site.
  2. All of the XML files for the site have to be present in that folder: Badges, Comments, PostHistory, PostLinks, Posts, Tags, Users, and Votes.

When you run SODDI.exe without parameters, this GUI pops up (assuming that you named your Stack Overflow demo folder 092013 SO):

SODDI with my settings

Source is the folder where you saved the data dumps. It expects to see subfolders in there for 092013 SO.

Target is the connection string for your database server. I’m using a local SQL Server (note that I picked SqlClient in the Provider dropdown) with a database named StackOverflow, so my connection string is:

Data Source=(local); Initial Catalog=StackOverflow; Integrated Security=True

If you want to use a remote SQL Server, you’d put its name in there instead of (local). You’ll also need to pre-create the database you want to use.

Ah, the StackOverflow Database

Click Import, and after a lot of disk churn, you’re rewarded with a StackOverflow database with tables for Badges, Comments, Posts, PostTypes, Users, Votes, and VoteTypes.

The resulting database is about 50GB. SQL Server’s data compression doesn’t work too well here because most of the data is off-row LOBs. Backup compression works well, though, with the resulting backup coming in at around 13GB.

Why Go to All This Work?

When I’m teaching performance tuning of queries and indexes, there’s no substitute for a local copy of the database. I want to show the impact of new indexes, analyze execution plans with SQL Sentry Plan Explorer, and run load tests with HammerDB.

That’s what we do in our SQL Server Performance Troubleshooting class – specifically, in my modules on How to Think Like the Engine, What Queries are Killing My Server, T-SQL Anti-patterns, and My T-SQL Tuning Process. Forget AdventureWorks – it’s so much more fun to use real StackOverflow.com data to discover tag patterns, interesting questions, and helpful users.

The Easy Way to Query StackOverflow.com

Point your browser over to Data.StackExchange.com and the available database list shows the number of questions and answers, plus the date of the database you’ll be querying:

StackExchange Database List

At the time of this writing, the databases are updated every Monday. If you want even more recent data, you can use the Stack Exchange API, but that’s a story for another day.

Click on the site you’d like to query, and you’ll get a list of queries you can start with, or click Compose Query at the top right. As an example, let’s look at a query that compares the popularity of tags:

Querying StackOverflow

Yes, this is a lot like SQL Server Management Studio in the browser. At the top, we’ve got our query, plus space for a couple of parameters. One of the fun parts about Data Explorer is that you can design queries to take parameters to show information for different users, date ranges, tags, etc.

At the bottom, notice the tabs for Results, Messages, and Graph. If your results look graph-friendly, Data Explorer is smart enough to figure that out:

Query Results in Graph Format

And yes, Data Professional, that last tab does indeed say Execution Plan, and it renders in your browser right down to the ability to hover your mouse over parts of the plan and see more details:

Execution Plan
Execution Plan

Data Explorer is really easy to use – check out the one-page documentation. It’s even open source, so to learn more about how it works, visit StackExchange.DataExplorer on Github.

Some system commands (like SET STATISTICS IO ON) are allowed, but you can’t create indexes, and there aren’t many indexes to begin with. You can also shoot yourself in the foot by writing an extraordinarily ugly query, and the system won’t stop you – for example, SELECT * FROM Posts will start running, but then may crash your browser as they start returning data. Jeremiah and I managed to repeatedly kill our Chrome browsers while tuning queries for fun.

I like using this to go poking around for unusual questions or answers. For example, I like to find questions that are viewed a lot, but don’t have any upvoted answers yet. (That’s prime territory for a SQL Server geek like me that wants to find tough questions to solve.)


Careful Adding Indexes with Always On Availability Groups

In theory, you can add indexes online with SQL Server Enterprise Edition.

In theory, with AlwaysOn Availability Groups, you can add and drop indexes on the primary replica whenever you want.

In theory, you can perform read-only queries on the secondaries whenever you want, and nobody gets blocked.

In practice, these things don’t always add up to the same answer.

I’ve got an AlwaysOn Availability Group demo lab with SQL Server 2014 hosting the AdventureWorks2012 database. I’ll start on my secondary server, and I’ll get all of the suffixes from the Person.Person table:

Clustered index scan on Person.Person

The query results aren’t important – instead, I’m showing the actual execution plan, which is very important. By default, there’s no index on the Suffix field, so I get a clustered index scan.

Say that for some bizarre reason, this is the type of query my end users constantly run, so I decide to switch over to the primary to add an index on Suffix. (As a reminder, you have to add indexes on the primary, not the secondaries.) After adding the index, I run the query again:

ag-demo-step-4
Index scan on our newly created index

Woohoo! We’ve now got an index scan on my new index. (Yeah, it’s not a seek, but this is a crappy query, and a scan is the best I’m going to get.) So far, so good.

But now let’s mix things up a little – let’s run that same query, but start a transaction with it:

Starting a transaction and running a SELECT

Now I have an open transaction, which really shouldn’t mean anything because you can’t do updates on the secondary. However, switch over to the primary, and drop that newly created index. Back over on the secondary, where we’ve got that open transaction, run the exact same query again:

Boom
Boom

Our transaction has been knocked out and failed. It’s funny to think of a read-only transaction as “failing”, but if you have a stored procedure that starts things off with BEGIN TRAN and then does a lot of reads, thinking it’s going to get a complete point-in-time picture of the data, that’s not going to work.

I know what you’re thinking: “But Brent, I don’t even use snapshot isolation, because I read Kendra’s post about it, and I know we’re not ready to test our app with it yet.” Thing is, SQL Server uses RCSI behind the scenes on all AlwaysOn Availability Group replicas – and it’s lying to you about whether or not the feature is enabled. Here’s the sys.databases view for my secondary replica:

Trust no one.
Trust no one.

SQL Server claims that for the AdventureWorks2012 database, both snapshot isolation and read committed snapshot are off – but it’s lying to you. Read Books Online about querying the replicas and note:

Read-only workloads use row versioning to remove blocking contention on the secondary databases. All queries that run against the secondary databases are automatically mapped to snapshot isolation transaction level, even when other transaction isolation levels are explicitly set. Also, all locking hints are ignored. This eliminates reader/writer contention.

They’re not kidding – even if I specify dirty reads, I can run into the same problem. Here, I start a transaction, but I’ve asked for the dirtiest, no-lockin-est reads I can get:

Riding dirty
Riding dirty

But when I add or drop a related index on the primary, even WITH (NOLOCK) transactions are affected:

Wow, Microsoft's getting much more casual with the error messages lately.
Wow, Microsoft’s getting much more casual with the error messages lately.

This starts to point to the challenge of running complex reporting jobs off the secondary replicas. SQL Server is constantly changing the data underneath your queries, and most of the time, it cooperates beautifully. However, if you have a long-running stored procedure (like minutes or hours long), and you want a point-in-time picture of the underlying data while you generate reports on the replica, you don’t want to play around with transactions. Instead, a database snapshot might be a better fit.

If you’d like to run these demos on your own lab, download the scripts here.


SSMS Trick: Edit Large Procedures with the Splitter Bar

SQL Server
11 Comments

Here’s a SQL Server Management Studio trick that comes in super handy when you’ve got long pieces of code. I almost never see anyone use this, and I think the reason is that few people know about it.

When I’m working on a stored procedure, sometimes I want to add in a new variable or a temp table. I declare ’em all at the top of the procedure, but I’m working much farther down in the proc than that.

SSMS Need to add a temp table!
If I scroll up to add the temp table at the top, I have to find my way back here. And I’m *lazy*.

I don’t have to lose my place. I can split the window using a cool, but hard to see feature known as the “splitter bar”.

Finding the splitter bar icon in SSMS
This tiny icon is the “splitter bar”

Drag the splitter bar down. I now have two synchronized views into my procedure.

Dragging down the splitter bar
Dragging down the splitter bar opens up two work “zones” in the same document.

Voila, I can add my temp table in the right area without losing my place.

Editing two zones in SSMS
A great reason to justify that huge monitor you need for productivity.

This feature isn’t specific to SQL Server Management Studio– it exists in lots of other products. (Including Word!) But the feature is hard to spot and most folks just never seem to learn about it. (I had no idea it was there myself until Jeremiah showed it to me a while back, and now I’m addicted to it.)


Dynamic Sorting

SQL Server
36 Comments

While working on some DMV scripts, I came up with a lazy way to have a user definable sort order in the query that seemed like pure genius. I showed it to the team and they’d never seen anything like it before.

The Situation

Users like to be in control. They want to define custom columns, sort orders, and basically drag, drop, and pivot chart their way to victory. While I’m not going to show you how to build custom everything, we can look at a custom sort order.

Let’s start with a simple query:

Possible Solutions

Our users want to be able to define a custom sort order on this query. We could solve this in a few ways:

  1. Writing several stored procedures
  2. Use dynamic SQL to build an ORDER BY

Writing several stored procedures is tedious and error prone – it’s possible that a bug can be fixed in one of the stored procedures but not the others. This solution also presents additional surface area for developers and DBAs to test and maintain. The one advantage that this approach has is that each stored procedure can be tuned individually. For high performance workloads, this is a distinct advantage. For everything else, it’s a liability.

We could also use dynamic SQL to build an order clause. I wanted to avoid this approach because it seemed hacky. After all, it’s just string concatenation. I also wanted to work in the ability for users to supply a top parameter without having to use the TOP operator.

The First Attempt

My first attempt at rocket science looked like this:

Why do it this way? There are a few tricks with paging that you can perform using ROW_NUMBER() that I find to be more readable than using OFFSET and FETCH in SQL Server 2012. Plus ROW_NUMBER() tricks don’t require SQL Server 2012.

Unfortunately, when I looked at the execution plan for this query, I discovered that SQL Server was performing three separate sorts – one for each of the case statements. You could generously describe this as “less than optimal”.

A terrible execution plan featuring three sort operators.
Look at all those pretty sorts!

Even though it seems like SQL Server should optimize out the CASE statement, the obvious thing doesn’t happen. SQL Server has to compute the ROW_NUMBER() for every row in the result set and then evaluate the condition in order to determine which row to return – you can even see this in the first execution plan. The second to last node in the plan is a Compute Scalar that determines which ROW_NUMBER() to return.

I had to dig in and figure out a better way for users get a custom sort option.

Moving the CASE to the ORDER BY

My next attempt moved the custom sort down to the ORDER BY clause:

This ended up performing worse than the first attempt (query cost of 8.277 compared to the original query’s cost of 6.1622). The new query adds a fourth sort operator. Not only is the query sorting once for each of the possible dates, it’s then performing an additional sort on the output of the ROW_NUMBER() operator in the ORDER BY. This clearly isn’t going to work.

I somehow made this query even worse. You should move on.
-50% improvement is still improvement, right?

Getting Rid of ROW_NUMBER()

It seems like ROW_NUMBER() really isn’t necessary for our scenario. After all – I only added it as a trick if so I could potentially add paging further down the road. Let’s see what happens if we remove it from the query:

Right away, it’s easy to see that the query is a lot simpler. Just look at the execution plan:

Despite the file name, this isn't the winner.
A contender appears!

This new form of the query is a winner: the plan is vastly simpler. Even though there’s a massive sort operation going on, the query is still much cheaper – the over all cost is right around 2 – it’s more than three times cheaper than the first plan that we started with.

There’s one downside to this approach – we’ve lost the ability to page results unless we either add back in the ROW_NUMBER() or else use FETCH and OFFSET.

Bonus Round: Back to ROW_NUMBER

While using my brother as a rubber duck, he suggested one last permutation – combine the ORDER BY technique with the ROW_NUMBER() technique:

This ended up being almost as fast as the ORDER BY approach; this query’s cost is only 0.00314 higher than the ORDER BY. I don’t know about you, but I would classify that as “pretty much the same”. The advantage of this approach is that we get to keep the ROW_NUMBER() for paging purposes, there is only one sort, and the code is still relatively simple for maintenance and development purposes.

Check out the plan!

Victory is ours!
Victory is ours!

What Did We Learn?

I learned that trying to be smarter than SQL Server can lead to pretty terrible performance. It’s important to remember that the optimizer reserves the right to re-write. In the first and second case, SQL Server did me a favor by re-writing the query. Our third case is fairly obvious. The fourth example is somewhat surprising – by shifting around the location of theCASE, we’re able to eliminate multiple sorts and gain the benefit of using ROW_NUMBER().