Blog

New High Availability Planning Worksheet

One of the questions we ask every new client is, “How much data is this application allowed to lose, and how long is it allowed to be down for?”

This leads to some really fun conversations.

The business users assume that the database will never lose data and cannot go down. The IT admins assume that the business understands all systems can lose data, and that the business will be okay with some data loss during a crash.

To get the business users and the IT team onto the same page, I had to build that page for them to get onto! And here it is:

High Availability Worksheet, Page 1

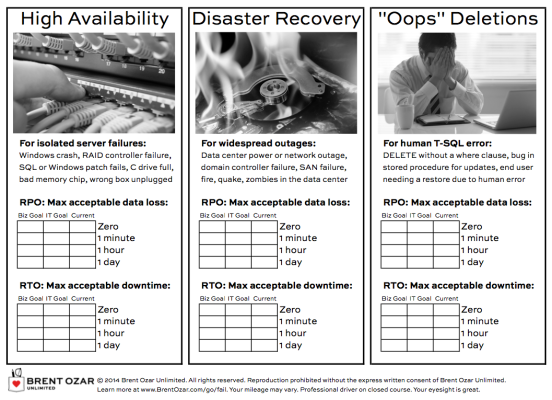
Step 1: the it team fills out the current state.

We start by filling out the “current” column for each of the three scenarios, documenting how much data the business could lose in the event of an outage, and how long the system could be down.

Say we’ve got a single physical standalone SQL Server, and we’re doing transaction log backups every hour to a network share. That means we could lose at least an hour’s worth of data, and be down for several hours (if not a day). To get the system back online, we would need to:

  • Provision hardware and storage space
  • Install the right version/edition of Windows, plus patches
  • Install the right version/edition of SQL Server, plus patches
  • Set up the same sp_configure options (maxdop, any trace flags, etc)
  • Set up security (users, passwords)
  • Restore the databases

Often I find that just getting everybody to agree on the “current” column risks can take an hour, and the business users are horrified by how much work is involved. It’s nobody’s fault – this is just the current state of the system.

Step 2: The business users set a goal.

They’ll say, “We’re not allowed to lose any data and we’re never allowed to go down”, and that’s where page 2 of the worksheet comes in:

Page 2 - The Costs of Choices
Page 2 – The Costs of Choices

Down the left side, pick how much data we’re allowed to lose.

Across the top, pick how long we’re allowed to be down.

Where they meet, that’s a rough cost of the solution, and the list of options that can meet the business goals. These costs are wide ranges that give the business a rough idea of what it’ll take to achieve their objective – don’t get hung up on the exact dollar amounts. The business users just need a rough idea to help guide their choice.

I strongly, strongly encourage business users to pick one of those 4 categories, not something like 15 minutes or 4 hours. SQL Server’s high availability and disaster recovery methods line up really well with these 4 buckets, and if they choose 15 minutes, they’re not really doing me any favors – I’m going to need to design a 1-minute solution.

Step 3: The IT Team designs a solution to meet the business goals.

In our DBA training classes, we coach DBAs on:

  • How to get real answers in writing from business users
  • How to set the “IT Goal” column of this worksheet
  • How to give the business users the right recommendation
  • How to handle cost objections
  • How to build a solution that meets the business users’ needs

When I was a DBA, that was the hardest part of my job. The business kept telling me, “You’re not allowed to lose data and you’re not allowed to go down, but you don’t have a budget.” Now, in our classes, we arm DBAs with worksheets and guides to go toe-to-toe with the business. You look like a pro because you get to leverage all these cool worksheets that we built for our own consulting projects.

You can grab this planning worksheet plus much more in our First Aid resources. Enjoy, and hope it makes your next HA/DR project easier!


How to Configure Anti-Virus for SQL Servers

Roachlipication-Database
Oh, that’s not a virus! That’s just replication.

Anti-virus is a devilish beast. If you don’t implement it, someone’s sure to log onto your SQL Server and download some free tool that puts you at risk as soon as you’re not looking. If you do implement it, sometimes it can make you crazy.

And often it’s not even up to you: you need to follow corporate policy.

Here’s what you should know if you’ve got an anti-virus tool on your SQL Server.

Set the right Anti-Virus folder, file, and process exclusions

Good news: you don’t have take my word on what types of files and directories your anti-virus software should exclude. Microsoft lays it all out for you in KB 309422

Special cases: Keep outta my Address space

If you use any of the following products, read KB 2033238, “Performance and consistency issues when certain modules are loaded into SQL Server address space”:

  • McAfee VirusScan Enterprise
  • McAfee Host Intrusion Prevention
  • Sophos Antivirus
  • PI OLEDB provider

Virtualization Guests need staggered schedules

Scheduling matters. VMware recommends that you set anti-virus scans to run at non-peak hours in your guests, and to set scheduling so that multiple guests don’t all fire up burn all their resources at the same time on a single hosts.

Need proof? See page 41 in the Performance Best Practices for VMware vSphere® 5.5 Guide.

Windows Failover Clusters

Check out KB 250355 for special steps for Failover Clusters. (Thanks, Gary, for pointing out this has a bit more info than KB 309422 mentioned above!)

If you’re Running Anti-Virus, Run it in Pre-Production, too

Anti-virus isn’t just for production servers. If you run into any problems, you want to be able to check for a repro outside of production, too, right?


Doug Broke It: Minimal Logging [Video]

Videos
8 Comments

In this 5-minute video, Doug explains how he kept filling SQL Server’s transaction log during ETL development, and how minimal logging could have prevented a lot of the log writes. You’ll learn about:

  • What minimal logging is
  • How to turn minimal logging on
  • How to tell if minimal logging is working
  • Using minimal logging for schema changes
  • Words of caution about minimal logging

http://youtu.be/TSJ0YS6Neps


Introducing sp_BlitzCache®

Finding the worst queries in SQL Server is easy, right? You just query one of the dm_exec_* DMVs, bring in the SQL text and the execution plan, and then you spend hours looking at execution plans trying to figure out what’s wrong in the query, much less how to fix it.

All that’s changing – we’re introducing sp_BlitzCache®.

Life Should Be Easy

We try to make things easy for you. sp_Blitz® and sp_BlitzIndex® make life easy – they find help you find configuration and indexing problems. sp_BlitzFirst® helps you find problems that are hitting your SQL Server right now. We decided to take it one step further and apply our expertise to analyzing the plan cache.

There are a lot of queries that will help you get data out of the plan cache. A lot of those queries are also fairly complicated. They present a lot of data, but they don’t help you interpret the results.

Work Just Got Easier

sp_BlitzCache® analyzes the top poorly performing queries for many different problems. After finding your bad habits, sp_BlitzCache® builds a list for easy analysis. Your bad habits are outlined in a summary result set:

A summary of your code sins.

In addition, each of the queries in the top 50 worst performers will have their warnings called out in a separate warnings column:

Your detailed confession.

Options

There are a number of different options available with sp_BlitzCache®. If you want a refresher, just run EXEC sp_BlitzCache @GetHelp = 1. Otherwise, here’s a quick overview:

@GetHelp – Displays a summary of parameters and columns.

@Top – Determines the number of records to retrieve and analyze from sys.dm_exec_query_statssys.dm_exec_procedure_stats, and sys.dm_exec_trigger_stats.

@SortOrder – CPU, reads, writes, etc. This controls collection and display.

@UseTriggersAnyway – Don’t set this unless you’re crazy. SQL Server 2008R2 and earlier has a bug where trigger count can’t be trusted. It seemed safer to ignore triggers on those versions of SQL Server than give you bad information.

@Results – There are three ways to display the detailed results grid. * Narrow will only display averages for CPU, reads, writes, and duration. * Simple, the default, displays totals and averages. * Expert displays all of the information collected by sp_BlitzCache in addition to metrics normally displayed.

If you want to save the results to a table, you can use @OutputDatabaseName@OutputSchemaName@OutputTableName to persist the results to a table. If the table doesn’t exist, it’ll be created for you.

Download it now!

Download sp_BlitzCache now!


4 Lightweight Ways to Tell if a Database is Used

SQL Server
52 Comments

We’ve all found those databases. They’re on your production SQL Server instance, but nobody seems to know if they’re being used, or what’s using them.

Database_Fire_Signed
Is anyone using this?

You could run some sort of trace, but you’d probably drag down performance on your SQL Server. What you need is a quicker way to find out if the database is in use.

Is a Login Using the database?

And if so, what query did they run last? My favorite way to see this is with Adam Machanic‘s sp_whoisactive.

You want to run sp_whoisactive with a couple of special parameters, so it shows you sessions that are connected even if they aren’t running, and limits the output to sessions using that database:

  • Pros: Super fast, super easy. Lets you see the host name and the last query they ran.
  • Cons: Whatever’s using the database might not be connected at the moment, or might be using a different database context.
  • Verdict: A good first step.

Are Reads and Writes Happening on Tables in the Database?

Sure, it’s possible that stored procedures or functions are in use that don’t use any local tables, but just looking at whether data access is being done tells you a lot fast.

My favorite way to do this is with sp_BlitzIndex®. Run it with the @mode=2 parameter, copy and paste the data into a spreadsheet, and look at the “Index Usage” column. You can also see the timestamps of most recent seeks, scans, and writes.

  • Pros: Very lightweight, and lets you know which tables are in use.
  • Cons: If you have fulltext indexes, you may see reads from the fulltext indexing service on those tables (even if users aren’t querying the fulltext index).
  • Verdict: Very useful information. A good second step.

Is the Transaction Counter Going Up for the Database?

SQL Server keeps a cumulative track of activity, and you can check this to see if it’s currently going up:

  • Pros: Super lightweight, no extra tools needed.
  • Cons: Some reads will occur just in starting up SQL Server. You can’t tell reads from maintenance from reads from user transactions. (Full and log backups will increment the counter.) Also, strangely enough, just plain SELECT statements outside of an explicitly defined transaction don’t cause this counter to go up. (I know, weird, right???)
  • How to use it: Take a couple of samples and see if the counter is going up dramatically. If it is going up, that means something’s fairly busy in there. I wouldn’t try to get too scientific with this one, though– it’s just too limited.
  • Verdict: Kind of clunky, but could be useful along with the other methods here.

Are there user Execution Plans in the Cache for the Database?

You can also ask the execution plan cache if queries have been running against the database. This query takes advantage of the dm_exec_text_query_plan DMV (as recommended here by the very clever Grant Fritchey):

  • Pros: Gives you insight into what is using the database when it finds results
  • Cons: Doesn’t catch anything that’s not in the cache due to RECOMPILE hints or memory pressure over time. You’ll probably have to slog through some rows of system procedures.
  • Verdict: not perfect, but very information-rich if something does turn out to be using the database (and a whole lot quicker and more lightweight than tracing).

I know there’s a way I haven’t THOUGHT of.

Do you have a lightweight technique you use for this which I haven’t mentioned here? Let me know in the comments!


Tiering kCura Relativity Databases (Or Any SaaS Product)

When you’re the database administrator working with a software product that stores every client’s data in a different database, the sheer number of databases can be intimidating. As you grow from dozens to hundreds to thousands of databases, you can’t treat all of them equally.

Start by making a graph of the database sizes – here’s an example from one of my clients with 58 databases on a server (certainly not a big number, but just easy to digest in a blog post):

Relativity Databases by Size

Next, divide the databases into two tiers:

Standard Tier: In this example, it’s the 53 databases on the left, all under 50GB in size. We can put all of them on the same clustered SQL Server instance, on one pool of shared storage. We use native SQL Server backups on those, and we don’t do any index tuning on those databases at all. The standard Relativity database schema works just fine for them.

Premium Tier: The 5 databases on the right are all over 50GB, and we’ll treat those differently. There’s nothing magic about the 50GB number – we just picked the outliers that are much larger and will require more hand-holding for performance and reliability management.

Your top 10% largest databases will always need your full attention. It’s not that kCura Relativity or SQL Server have a hard time with 50GB of data in one database – indeed, we’ve got clients hundreds of times larger than that – but you will have a hard time with it. After all, your 10% largest databases will always scare you because they’ll be the biggest ones you’ve ever worked with.

The Premium Tier gets:

  • Custom performance management – every week, the DBA looks at SQL Server’s index and query metrics on those databases to figure out which indexes to tune.
  • Custom backup management – as these databases grow, they may be a better fit for SAN snapshot backups, which let you back up databases of any size in under ten seconds. For that to work, though, we have to put those databases on their own storage volumes, so we can’t afford the management overhead of doing that for every database. We reserve this technique for the bigger databases.
  • Custom hardware/software – we don’t want these databases lumped in with the vast majority of databases because these larger databases tend to dominate SQL Server’s memory. SQL Server doesn’t have controls to limit the amount of data cached per database, so if one of the large databases is heavily active, he’ll push all of the other databases out of RAM. For that reason, it may make sense to put these databases on hardware with much more memory.
  • Custom filegroup/file design – depending on the storage hardware and SAN pathing, the Premium Tier databases may benefit from having multiple files per filegroup.
  • Custom index maintenance strategies – as databases get larger, it’s not as practical to rebuild their indexes so frequently, and we may switch to just updating statistics frequently instead.
  • Custom index design and query tuning – it’s not just enough to rebuild your indexes, but you also need to design new indexes for your most resource-intensive saved searches. kCura ships a set of starter indexes that work for most workspaces, but your 10% largest databases – especially if they’re pushing performance limits on your hardware – will need hand-crafted indexes.
  • Custom monitoring – when there’s a long-running query in the Premium Tier, we need to know quickly because it has much bigger performance implications than it does in the Standard Tier.
  • Partition the AuditRecord table – this technique gets you faster backups and DBCCs, but comes at the expense of more management overhead. It’s worth the work for Premium Tier workspaces.

Once we’ve implemented tiering, then we can often achieve big hardware & licensing savings. We can use cheaper hardware for the Standard Tier, and we may even be able to get away with SQL Server Standard Edition in some cases.

As Relativity hosting companies grow, they can even decide to add a third tier: Cold Cases, databases that are no longer loading new data or undergoing intensive searches. We lump all of the Cold Case tier onto much cheaper hardware, and possibly pass the savings on to the end users. (Or not, hey, whatever. I’m not here to judge.)

Every week, the DBA updates the sizing chart to show which databases have grown dramatically over the last 30 days. The business and the DBA agree on a size point where cases will be upgraded to the Premium Tier – and sometimes, the business even tells the DBA ahead of time when a case is destined to grow up.

The bottom line is that the DBA spends less time messing around with Standard Tier databases, and more time focusing on the databases that are harder to manage – and often bring in more revenue.


The Day the SQL Server Quit [Video]

Videos
13 Comments

In this 5-minute video, Doug tells a story about a DBA whose SQL Server got fed up with being misconfigured and decided to do something about it. Topics include CPU settings like MAXDOP and Cost Threshold for Parallelism, memory and disk configuration.

https://www.youtube.com/watch?v=9HNMPjRz4KE


Memory and IO in Tempdb: SQL 2014 and SQL 2012 SP1 CU10 Improvement

SQL Server, TempDB
19 Comments

Update on 5/25/2014: At least parts of this improvement have been backported to SQL Server 2012 SP1 CU 10. Read the KB here. After applying CU10 to SQL Server 2012 SP1, the test query shown in this post performed as it did against SQL Server 2014.

I was excited to read Bob Dorr’s recent post about a hidden gem in tempdb performance in SQL Server 2014. I had a copy of SQL Server 2014 Developer Edition handy, as well as a workload that beat up tempdb, so I decided to do a quick performance test. I wanted to find out how much this might help performance when tempdb was already on SSDs.

The tempdb improvement (in a nutshell)

There’s been a myth for a long time that if you populate a temp table or table variable, the data just resides in memory. This hasn’t been true in the past, but in SQL Server 2014 temporary operations are not as “eager” to cause disk IO.

The test setup

I ran a simple workload using HammerDB. My workload “warmed up” for one minute, then ran for three minutes. The workload ran with 1 watcher thread and 6 worker threads. Each worker thread selects data into a temp table as fast as it possibly can, over and over again. The workload isn’t much like a normal production workload: it just beats up tempdb.

I ran this test a few times independently against two VMs on my laptop. Both VMs have 6000MB RAM, 4 vCPUs, Windows Server 2012 R2, and all their storage is on SSD.

  • Mister: SQL Server 2012 SP1
  • ChairmanMeow: SQL Server 2014 RTM

Both SQL Server instances were configured with ‘Cost Threshold for Parallelism’ set to 50, which effectively makes this workload single threaded. Each instance had 40 equally sized tempdb data files configured. (That’s a lot more than you’d usually have with 4 vCPUs! This is a contrived workload with an especially high amount of tempdb contention.)

During each test run, I took a 30 second sample of waits and file io stats using sp_BlitzFirst®. (I ran: exec sp_BlitzFirst @ExpertMode=1, @Seconds=30)

The Test Query

The workload runs this test query. The execution plan costs out as 16.71 on both of my instances and the plan is the same shape.

How did the instances do?

I got quite consistent results over multiple tests. Here’s a comparison:

tempdb 2012 2014 comparison

Wait stats comparison

My SQL Server configuration isn’t perfect. Sure enough, there’s still some tempdb contention: I’ve got PAGELATCH waits because my queries are fighting over PFS and GAM pages.

PAGEIOLATCH show up more in the SQL Server 2012 sample. That’s the first tip that disk access is more of an issue.

MB written by file comparison

The real validation on what’s happening in this feature comes in on the two columns on the right. sp_BlitzFirst® peeks at your sys.dm_io_virtual_file_stats DMV, and when you run it in ExpertMode it lets you know the top 5 files you’ve read and the top 5 files you’ve written to.

We can clearly see that in SQL Server 2012, I was doing a lot of write IO. That write IO was going to every single tempdb file evenly (that’s expected if they’re evenly sized), as well as to the tempdb log. My average write latency was 7 ms, which isn’t really bad given what I was doing to my SSDs.

And sure enough, that IO just about disappears in SQL Server 2014! That adds up to a notable improvement in transactions per minute.

You’ll really love this feature if you can’t put SSD underneath all of your tempdb databases. But even for those who’ve already tuned up their storage, this feature should help you out.


Introduction to Extended Events (video)

SQL Server
2 Comments

Extended Events were introduced with SQL Server 2008. Extended Events is a replacement for Server Side Traces and so much more – it’s a lightweight way to look at SQL Server performance, events, deadlocks, locking, blocking, and more. In this webcast, Jeremiah Peschka provides a high-level introduction to Extended Events. You’ll learn about how Extended Events are structured, how to find out what’s available, and where to get started.

https://www.youtube.com/watch?v=w8ANBq3LoQk

Find out more at our Extended Events resource page.


“If You Can’t Do ____, You’re Not a Production DBA”

Recently I saw a tweet that said, “If you can’t read a query execution plan, you’re not a production DBA.”

I love execution plans, and there are really great reasons to learn to read execution plans, but I disagree completely.

Database Administration is not all about performance

Performance is only one component to database administration. Let’s take Jill as an example.

Jill is a SQL Server DBA who focuses on High Availability and Disaster Recovery for a large company. She works to keep her knowledge and skills sharp on backups and restores, Windows Failover Clustering, and High Availability Groups. She designs mission critical systems to meet high uptime requirements. She also designs and runs a lab where she proactively causes outages and troubleshoots them, corrupts databases and repairs them. She uses these experiences to build processes for front-line engineers to respond to production incidents and trains them to keep systems online as much as possible. Jill is excited about learning more about virtualization and SAN replication in the next year and has created an aggressive learning plan.

Jill’s pretty awesome, isn’t she? Is Jill magically not a Production DBA if she looks at an execution plan and doesn’t know what it means?

If you’re just getting into database administration, we don’t recommend that you start with performance as your primary focus. We recommend that you start at the base of the database Hierarchy of Needs. As you work your way up, decide where to specialize.

Don’t de-legitimize DBAs who are Different than You Are. Talk to Them!

It’s great to love what you do. Just remember that database administration is a really broad field, and the way you DBA isn’t necessarily the way everyone has to DBA. (Sure, DBAing is a verb. Why not?)

Let’s not fall into the trap of thinking “I’ve got to have this one skill so I can get into the cool club.” Instead, let’s get excited about the fact that there’s so much to learn that we all have to make tough choices. Let’s seek out the people who choose differently than us, and learn from them, too.


Developer’s Guide to Understanding DBAs [Video]

SQL Server
1 Comment

You’re a developer, and you want to know:

  • What do DBAs value?
  • What do DBAs need from me?
  • What does my DBA want to help me with?
  • How big should that server be?
  • Is the DBA judging my code?
  • What happens if I get in trouble with my DBA?

Learn the answers in this 30-minute video:

https://www.youtube.com/watch?v=790PNZM6PZc

Liked this? Register for our free upcoming webcasts, and check out our video archive of past webcasts.


Happy Third Birthday to Us, Presents for You

Company News, SQL Server
29 Comments

Three years ago this month, we turned this blog into a consulting company. This year, we’re … well, we’re still not adults.

Brent Ozar Unlimited Class of 2014

It’s been an incredible three years. Sure, it feels just “normal” now, but when we look at the numbers, suddenly it feels like a big deal compared to where we were in 2011:

  • Over 250 SQL Critical Care® patients
  • 1,322 training video customers
  • Thousands of in-person training attendees at dozens of classes and pre-cons
  • 190 YouTube videos watched by 635,471 people
  • 23,782 email subscribers
  • 3,333,741 unique web site viewers
  • 2 awesome full time employees
  • Microsoft Silver Partner
  • 3 company retreats

Let’s celebrate. On Tuesday, April 29th, for exactly one day only, discount code Happy3rd gets you 33% off our training videos and in-person classes. Enjoy!


Advice to an IT newcomer

SQL Server
4 Comments
Women in Technology
Women in Technology (yes, Clippy is a woman, too)

We recently got the following question for Kendra and Jes in the Brent Ozar Unlimited® mailbox:

Six months ago I stumbled into the IT world. Do you have any advice for someone (a woman) starting off in the IT industry, specially someone without a computer science degree? I really enjoy working with databases and data. I would love to one day be a Database Administrator and get into business intelligence.

JES SAYS…

There has been a lot written about women in technology – positive and negative. I’m happy to say that my experience as a woman in technology has been incredible. The SQL Server community has been accepting, helpful, and nurturing. If anyone, man or woman, came to me, asking how to succeed, I’d give them this advice.

Ask questions. Constantly learn. There is no such thing as too much knowledge. The most successful people I know in IT – not just the SQL Server world – are lifelong learners. They read books and blogs, attend user group meetings and conferences, and learn new programming languages in their spare time. Build your own computers. Know how to set up a network. You don’t have to be an expert at every facet of technology, but knowing enough to talk to other people in “their” language will go a long way.

Speaking of user groups…find the closest user group, and attend it regularly. Don’t have one nearby? Start one, or join a virtual user group (like those at http://www.sqlpass.org/PASSChapters/VirtualChapters.aspx). Not only will you learn about things you may not be exposed to at work, you’ll have a chance to build a network. I can’t tell you the number of questions I’ve gotten answered through this channel, or the number of people I know that have gotten new (better!) jobs this way.

Never, ever be afraid to say, “I don’t know, but I can find the answer.” People will respect you far more if you are honest. Don’t try to be a know-it-all. If you haven’t dealt with a particular technology or situation before, acknowledge that, make note of what the person is asking for, and research it later. You’ll learn something new, and you won’t get caught giving bad – or wrong – answers.

Don’t think, “I’ll never know as much as him/her.” Yes, there are some people in IT that started building computers or robots or software before they could drive a car. Instead of thinking that you will never know as much as they do, remind yourself how many years of experience they have – and how they can help you. Ask to pick their brains. Ask them what books they read or what tools they use. Learn from them.

Most of all, don’t fall victim to the so-called “impostor syndrome”. Someone always appears smarter, faster, more organized, more accomplished, less stressed, or hasn’t spilled coffee all over herself yet today. Don’t let that invalidate where you started from and what you have accomplished. Keeping a blog – even if it’s private – that you can go back and reference over the years is a great way to value yourself. I know I’ve seen a dramatic change in my writing over five years, from both a technical and editorial perspective.

Good luck! Being in IT – and especially the SQL Server field – is exciting and rewarding.

KENDRA SAYS…

Remind yourself that you’re qualified to be a DBA. You mention that you don’t have a computer science degree. Great news: that’s not required. There’s no degree or certification that is the Official DBA Training Program or Proving Ground.

I had a period where I felt I wasn’t “legitimately a DBA” because I also worked with some C# and drove some non-SQL software development processes. But I was doing some really cool things with SQL Server administration, too. I should have felt awesome about being a DBA, regardless of my job title.

Never feel that your background or your current job have to fit a specific mold for you to be a “real” DBA. There is no mold!

Remind yourself that you are designing your own career as you go. Just like there’s no set educational and certification “solution” to end up with all the right skills, job progression for DBAs is usually not linear. It’s a rare person who starts with a “Junior DBA” job title and works their way up to “Mid Level DBA” and then “Senior DBA”.

Instead, most people these days struggle to find the right training, the right mentor, and discover if they want to specialize (Virtualization? Performance Tuning? Data modeling?), be a generalist, or dive off into uncharted waters (Hadoop? Different Platforms? Business Intelligence?). There are many paths, and there are new paths all the time.

Expect to repeatedly redefine your interests and redesign your career. Make sure that every six months you have a conversation with your manager about what kind of work makes you excited, and where you’d like to be in a year or two.

Remind yourself that you do great stuff: and write it down. For a few years, I had a formal review process where I was regularly required to write out my accomplishments. And you know what? That was great for me! Each item on the list seemed small, but when I put it all together it gave me a new view of myself.

This may be difficult, but it’s worth it. Keeping track of the great things you do boosts your confidence and makes you ready when opportunity comes around.

GET INSPIRED

Is this advice only for women? Heck no! Sometimes it’s just nice to ask advice from someone who’s part of a group you also identify with and hear their perspective.

Want to learn more about how to build a great career working with data? Hop on over to Brent’s classic post, “Rock Stars, Normal People, and You.”


SQL Server 2014 Buffer Pool Extensions

SQL Server
59 Comments

SQL Server 2014 contains some interesting new features. Although SQL Server Standard Edition is limited to 128GB of memory, teams deploying on Standard Edition have an option to fit more of their working set in low latency storage – SQL Server Buffer Pool Extensions.

How SQL Server Normally Deals With Data

During SQL Server’s normal operations, data is read from disk into memory. At this point, the data is clean. Once the data is changed, it is marked as dirty. Eventually the dirty pages are written to disk and marked as clean; clean pages may be flushed from memory when the data cache (the buffer pool) comes under pressure. At this point the data is gone from memory and SQL Server has to read it from disk the next time a user runs a query that requires the data.

As long as you have less data than you have memory, this isn’t a problem. As soon as you have more data than you have memory, you’re at the mercy of physical storage.

Right now, some of you are probably saying “So what? I have an awesome EMC/3PAR/Hitachi VX6.” You also probably have SQL Server Enterprise Edition and a pile of unused RAM sticks. This blog post isn’t for you. Go away.

The rest of you, the 99%ers, listen up.

Speeding Up Data Access with Buffer Pool Extensions

SQL Server 2014 Buffer Pool Extensions are our new secret weapon against not having enough memory. Like most secret weapons, there’s a lot of hype surrounding Buffer Pool Extensions (BPE).

The idea behind BPE is a lot like the idea behind virtual RAM (better known as swap space): fast, low latency persistent storage is used to replace a portion of memory. In the case of BPE, SQL Server will use the disk space to store clean buffers – specifically BPE will hold unmodified data pages that would have been pushed out of RAM.

To see just how fast this was going to perform, I create a test instance of SQL Server and decided to find out.

Test Methodology

I ran SQL Server through a relatively boring test harness – TPC-C running through HammerDB. The database was created at a scale factor of 444 warehouses – this yields 44GB of data on disk, or near enough. SQL Server 2014 RTM was installed on Windows Server 2012 on an Amazon i2.8xlarge instance. To find out more about how the instance was physically configured, you can check out the instance type details page.

SQL Server was set up in a fairly vanilla way:

  • Max degree of parallelism was set to 8
  • Max server memory was left alone
  • tempdb was given 4 data files located on a local all SSD RAID 0 of four drives
  • A second all SSD RAID 0 of four drives was reserved for BPE

Tests were run multiple times and the results of the first test were discarded – many changes during this process could clear the buffer pool as such, the first test results were assumed to be anomalous. The remaining results were averaged to produce the following chart:

It's faster than not having enough RAM.
It’s faster than not having enough RAM.

Conclusions

Having an appropriately sized buffer pool was far more effective than allocating considerable space to buffer pool extensions. BPE improved performance by 42.27%. This is not an insignificant performance gain, but BPE is no substitute for memory.

BPE will shine for customers deploying in dense, virtualized environments where memory is constrained but SSD is cheap and plentiful. Given the near ubiquity of SSD, and high speed consumer grade SSD being available for as little as $0.50 per GB, BPE may seem tempting. It may even provide some respite from performance issues. However, BPE is no substitute for RAM.


Collecting Detailed Performance Measurements with Extended Events

SQL Server
22 Comments

Analyzing a workload can be difficult. There are a number of tools on the market (both free and commercial). These tools universally reduce workload analysis to totals and averages – details and outliers are smeared together. I’m against using just averages to analyze workloads; averages and totals aren’t good enough, especially with the tools we have today.

Collecting Performance Data with Extended Events

A note to the reader SQL Server Extended Events let us collect detailed information in a light weight way. These examples were written on SQL Server 2012 and SQL Server 2014 CTP2 – they may work on SQL Server 2008 and SQL Server 2008R2, but I have not tested on either version.

We need to set up an Extended Events session to collect data. There are three Extended Events that provide information we want:

  • sqlos.wait_info
  • sqlserver.sp_statement_completed
  • sqlserver.sql_statement_completed

In addition, add the following actions to each event, just in case we need to perform deeper analysis at a later date:

  • sqlserver.client_app_name
  • sqlserver.client_hostname
  • sqlserver.database_id
  • sqlserver.database_name
  • sqlserver.plan_handle
  • sqlserver.query_hash
  • sqlserver.query_plan_hash
  • sqlserver.session_id
  • sqlserver.sql_text

In a production environment you should enable sampling. Sampling is just a predicate that filters out random events, typically by using the modulus of the session identifier (e.g. SPID modulo 5 = 0 will sample 20% of activity). Enabling sampling makes sure that you don’t collect too much data (yes, too much data can be a bad thing). During a routine 5 minute data load and stress test, I generated 260MB of event data – be careful about how often you run this and how long you run it for.

To get started, download all of the scripts mentioned in this post.

Reporting on Extended Events

Go ahead and set up the Extended Events session and run a workload against that SQL Server for a few minutes. If you’re analyzing a production server, copy the files to a development SQL Server or to a SQL Server that has less workload – you’ll thank me later. Once you’ve collected some data in the Extended Events session, stop the session, and run the results processing script. On my test VM, processing the data takes a minute and a half to run.

The data processing script creates three tables materialize XML data to speed up processing; shredding XML takes a long time. Relevant data is extracted from each of the different events that were collected and persisted into the processing tables. If you’re going to be doing multiple analysis runs across the data, you may even want to put some indexes on these tables.

Once the data is loaded, run the analysis query. This doesn’t take as long as the processing script, but it does take some time; it’s worth it. The analysis script collects a number of statistics about query performance and waits. Queries are grouped into 1 minute time blocks and metrics around reads, writes, duration, and CPU time are collected. Specifically, each metric has the following statistics built up:

  • Total
  • Average
  • Standard Deviation
  • Minimum
  • Maximum
  • Percentiles – 50th, 75th, 90th, 95th, and 99th

The same thing happens for each wait as well – each wait is time boxed on the minute and then both signal and resource waits are analyzed with the same statistics as query duration metrics.

In both analyses, analysis is performed on a query by query basis. At the end of the analysis we you get a multi-dimensional view of the data by time and query. It should be easy to perform additional analysis on the data to create broader time windows or to analyze the entire dataset at once.

Want to see what the output looks like? Check out these two screenshots:

Query Performance by the Numbers
Query Waits
Query Waits

Why Produce All of These Metrics?

All of these metrics give us insight into how these queries really run; an average just doesn’t help. Standard deviation alone lets us be aware of the variability of a particular metric – high standard deviation on a particular wait type means that we have a lot of variability in how long we wait on a resource. We also collect percentiles of all of these different metrics to help understand the distribution of data.

With this data at our disposal, we can make a better analysis of a workload. Now we can identify variations of a query that are producing bad plans, taking too long, or just reading an excessive amount of data. Or, better yet, if query performance is constant, we know that your code is just plain awful.

How’s that for a parting thought?


Five Reasons a Production DBA Should Learn to Read Execution Plans

Execution Plans
8 Comments

While chatting with attendees before my Don’t Fear the Execution Plan webcast, a question was posed: “As a DBA who mainly worries about backups, index fragmentation and checkdb, should I also be looking at execution plans?”

YES! Here’s why.

  1. Performance is important. A production DBA’s main focus should be the safety and security of the data, but the performance of servers is also something to be concerned with. Companies pay a lot of money in hardware, support, and licensing costs for these servers. Being able to squeeze every bit of performance from them will save the company money – which helps everyone in the company in the long run.
  2. Be a superhero. Your first response to an ongoing, persistent performance problem may be a hardware fix. Add more memory, add more disks, ask the SAN team to give you dedicated LUNs, beg for a new server. But at some point, it is going to be worth your time – and the company’s money – to tune bad queries. By being the person that can identify the bad queries and provide ways to improve them, you are putting on your superhero cape and saving the day.
  3. You’re being proactive, not reactive. We all need to be reactive sometimes – that’s a facet of the job. But being proactive – identifying top resource-consuming queries on a server, identifying problem spots in the queries, and suggesting fixes – makes us look better. We show we are bringing value to the company.
  4. Grow your knowledge of SQL Server. You never know when you may need the information. A new developer may have been able to ask the DBAs questions at her last job; you may need the skill at your next job. You will also learn things along the way about SQL Server internals, and that’s great knowledge to have.
  5. Increase communication between DBAs and developers. If your developers already use execution plans to tune queries, you will be able to speak their language. If they don’t, you can teach them as you learn – and there is no better way to learn than to teach something! Breaking down communication barriers is a goal my clients typically have. It involves some work and willingness to give, but will make your job better.

The SQL 2014 Cardinality Estimator Eats Bad TSQL for Breakfast

SQL Server
33 Comments
Is this really happening?

Sometimes I run into a query plan that just shocks me. It’s like looking up and suddenly seeing an adult dressed as a squirrel riding a unicycle down a busy city street. You have to stop and ask yourself, “Did that really just happen?” (I live in Portland, Oregon, so yeah, I’ve seen that.)

A while back I blogged about how to write a query to demonstrate a big memory grant against the AdventureWorks2012 database. The trick was to stuff the query’s joins full of functions so that the query optimizer became baffled about how many rows might come out of the join. The query is terrible, but it’s useful for demonstrating some problematic situations with memory on a test server.

Recently I dug out the query to set up a demo on SQL Server 2014 and something strange happened: it saw through the awfulness of my query. It made my horrible TSQL fast.

Let’s feed my terrible query to SQL Server 2014

First, make sure the new cardinality estimator will be used for your query. You do this by setting the database compatibility level to 120:

Now we’ll run this terrible, awful, no good query:

Shazam, it finishes using only 63 ms of CPU time. It asks for a 27MB memory grant and estimates 290 rows (quite accurately).

Top of Execution Plan-New Cardinality Estimator

The execution plan contains warnings that “Type conversion in expression … may affect “CardinalityEstimate” in query plan choice”, but wow, it really did a remarkably good job with this!

Using OPTION(QUERYTRACEON 9481) to test Compatibility Level 110

You can go back to the old cardinality estimator with SQL Server 2014 in two ways: You could change the whole database’s compatibility level back to 110 like this:

But that changes it for everything in the whole database. We might just want to see how THIS query would behave using the old cardinality estimator, but still on SQL Server 2014. You can do that by adding OPTION(QUERYTRACEON 9481) to the very end of our gruesome query:

Retesting the query with the old cardinality estimator… Ouch! The query uses 84,109 ms of CPU time and the execution plan is back to a world of confusion, thinking it’s going to have to handle a kazillion rows:

Execution Plan-High Estimations

Hey there new cardinality estimator, I’d like to get to know you better.

I’m not saying the new cardinality estimator will be better at every query, that it won’t have any regressions, or that you should start putting functions around all your joins.

But it’s pretty remarkable when the optimizer takes code that you wrote to be as terrible as possible, and suddenly makes it fast. Sign me up for more of that.


Updated “How to Think Like SQL Server” Videos

SQL Server
2 Comments

On my East Coast user group tour last month, I presented my How to Think Like the SQL Server Engine course to a few hundred folks. I’m always trying to learn and adapt my delivery, and I noted a lot of attendee questions this round, so I updated the course.

This is my favorite course I’ve ever done. In about an hour and a half, I cover:

  • Clustered and nonclustered indexes
  • Statistics, and how they influence query plans
  • How sargability isn’t just about indexes
  • T-SQL problems like table variables and implicit conversions
  • How SQL turns pages into storage requests

If you’ve always wanted to get started learning about SQL internals, but you just don’t have the time to read books, this course is the beginning of your journey.

Attendees give it rave reviews, but this one is one of my favorites:

Go check it out and let me know what you think.


Why Index Fragmentation and Bad Statistics Aren’t Always the Problem (Video)

Do you rely on index rebuilds to make queries run faster? Or do you always feel like statistics are “bad” and are the cause of your query problems? You’re not alone– it’s easy to fall into the trap of always blaming fragmentation or statistics. Learn why these two tools aren’t the answer to every problem in these two videos from Kendra Little.

Does Rebuilding Indexes Make Queries Faster in SQL Server?

Learn if rebuilding indexes is a good way to help queries run faster in SQL Server in this 13 minute video.

https://www.youtube.com/watch?v=qxQv0576iAU

Not convinced that fragmentation isn’t really your problem? Read Brent’s post, “Stop Worrying about Index Fragmentation“.

Why are Statistics Always the Problem? (Or ARE They?)

Once you’ve moved beyond an addiction to rebuilding indexes, you may find that you become an obsessive Statistics Blamer. Learn why you might mistakenly think your stats are “bad” when something else is really the problem in this 12 minute video.

https://www.youtube.com/watch?v=EYzgZGD2kRE

Want to learn more about statistics, parameter sniffing, and hints? Read “Optimize for… Mediocre?” and “Recompile Hints and Execution Plan Caching“.


SQL Server 2014 Licensing Changes

Licensing
159 Comments

With the release of SQL Server 2014, we get to learn all kinds of new licensing changes. While I don’t work for Microsoft legal, I do have a PDF reader and a web browser. You can follow along in the SQL Server 2014 Licensing Datasheet… if you dare.

Server + CAL Licensing is Still Around

It’s only for Standard Edition and BI Edition.

Microsoft are highly recommending that VMs be licensed as Server + CAL (rather than per core). This can make a lot of sense when there are small, single application SQL Servers that cannot be consolidated for security reasons. Having a number of Server + CAL license for 1 or 2 vCPU instances can be much more cost effective than having a large number of core based licensed.

Of course, it makes even more sense to just license the entire VM host…

How much money would it take to give you assurance?


Standby Servers Require Software Assurance

Prior to SQL Server 2014, many shops were able to deploy a single standby server without licensing SQL Server. Log shipping, mirroring, and even failover clustering allowed for an unlicensed passive node, provided that the passive node didn’t become the primary for more than 28 days.

That’s gone.

If you want to have a standby node, you’ve got to pony up and buy software assurance. Head over to the SQL Server 2014 Licensing Datasheet; at the bottom of page three, it reads “Beginning with SQL Server 2014, each active server licensed with SA coverage allows the installation of a single passive server used for fail-over support.” The passive secondary server doesn’t need to have a complete SQL Server license, but Software Assurance is a pricey pill to swallow. In short, Software Assurance (SA) is a yearly fee that customers pay to get access to the latest and greatest versions of products as well as unlock additional features that may have complex deployment scenarios.

In case you were confused, high availability is officially an enterprise feature. Note: I didn’t say Enterprise Edition. I mean enterprise with all of the cost and trouble that the word “enterprise” entails in our modern IT vernacular.

All Cores Must Be Licensed

You heard me.

To license a physical server, you have to license all of the cores. Don’t believe me? Check out this awesome screenshot:

License ALL THE CORES

It’s even more important to consider alternatives to having a number of SQL Servers spread throughout your environment. SQL Server consolidation and virtualization are going to become even more important as SQL Server licensing changes.

Finding new ways to analyze, tune, and consolidate existing workloads is going to be more important than ever before. Your ability to tune SQL Server workloads is going to be critical in successful SQL Server deployments. The days of worrying when the server hit 25% capacity are fading into history – as licensing costs increase, expect server density and utilization to increase, too.

Standard Edition has a new definition

“SQL Server 2014 Standard delivers core data management and business intelligence capabilities for non-critical workloads with minimal IT resources.” You can read between the lines a little bit on this one – SQL Server Standard Edition isn’t getting back mirroring or anything like it. In fact – SQL Server Standard Edition sounds an awful lot like the database that you use to run your non-critical ISV applications, SharePoint, and TFS servers.

Software Assurance Gives You Mobility

If you want to move your SQL Server around inside your VM farm, you need to buy Software Assurance. VM mobility lets teams take advantage of VMware DRS or SCOM VMM. This isn’t new for anyone who has been virtualizing SQL Servers for any amount of time. What is explicitly spelled out, though, is that each VM licensed with SA can be moved frequently within a server farm, or to a third-party hoster or cloud services provider, without the need to purchase additional SQL Server licenses.”

In other words – as long as you’re licensed for Software Assurance, those SQL Servers can go anywhere.

SQL Server 2014 Licensing Change Summary

Things are changing. DBAs need to take stock of their skills and help the business get more value from a smaller SQL Server licensing footprint. Realistically, these changes make sense as you look at the broader commercial IT landscape. Basic features continue to get cheaper. More resources are available in SQL Server 2014 Standard Edition, but complex features that may require a lot of implementation time, and Microsoft support time, come with a heavy price tag.