It’s a little bit of a trick question: what could make a good query plan turn bad?
In the last episode, we used sp_BlitzCache to spot the most resource-intensive, longest-running query plans in your server’s cache. Go run those queries again, right now, and I bet you’re going to see plans in the cache that use parameters. Maybe they’re stored procedures, or maybe they’re parameterized SQL.
To explain it, I’m going to need to run a few demos. I’m going to use the StackOverflow database – particularly, the Users table that I demo in How to Think Like the Engine. I’m going to start with an index on the Reputation field:
|
1 |
CREATE INDEX IX_Reputation ON dbo.Users(Reputation); |
That index is ONLY on the Reputation field – so it can be used for this below query, but it’s not a fully covering index:
|
1 |
SELECT * FROM dbo.Users WHERE Reputation = 2; |
That query finds all of the data for users whose Reputation score = 2. There’s not a lot of folks in the Stack database that match – the default Reputation score is 1, and people either stay there, or they start working their way up the charts.
Here’s what the query plan looks like:

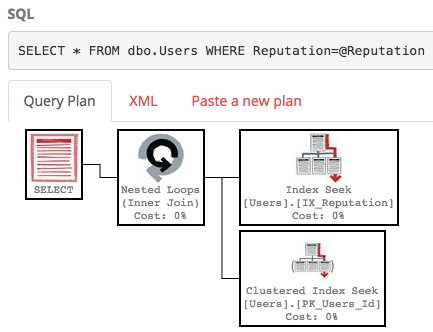
SQL Server does an index seek on our IX_Reputation index to find the 5,305 rows that match, then does a key lookup to get the SELECT * part (because the index doesn’t cover all those fields.) Look at the execution plan, hover your mouse over the index seek, and you’ll see that SQL Server expected 5,305 rows – and 5,305 actually came back. Awesome.
Now let’s try that query looking for Reputation = 1:

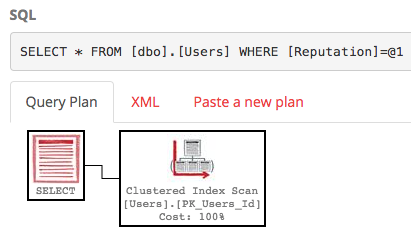
Note that even though SQL Server auto-parameterized the query (that’s the @1 part at the top), SQL Server chose a different execution plan. This time, the actual plan shows that SQL Server expected 3mm rows to come back – so here, it makes more sense to do a clustered index scan rather than first make a list of the users that match, then do 3mm key lookups to get the SELECT * part. SQL Server is using our index’s statistics to guess how many rows will come back.
The same query can produce 2 different plans with 2 different parameters.
(More complex queries can even produce more different plans than that.)
Let’s put it in a stored procedure and see what happens.
This stored procedure is pretty simple:
|
1 2 3 4 5 |
CREATE OR ALTER PROCEDURE dbo.UsersByReputation @Reputation int AS SELECT * FROM dbo.Users WHERE Reputation=@Reputation; GO |
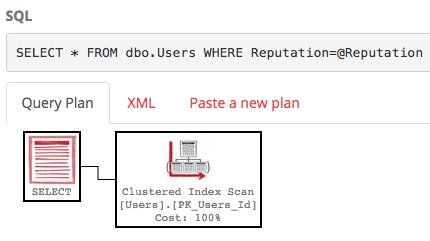
Run it with @Reputation = 1, and you get the clustered index scan:

Then run it with @Reputation = 2, and you get…wait a minute…

You get the execution plan from the first pass. That’s because SQL Server caches stored procedure execution plans – it builds a plan for the first set of parameters that happen to get passed in when the plan needs to be built, then caches that same plan to reuse over and over. The plan will stay in cache until you reboot Windows, restart the SQL Server service, rebuild indexes, update statistics, run DBCC FREEPROCCACHE, etc.
Here, that’s not such a big deal. I know, you see clustered index scan, and you think performance is bad – but it’s not really that big of a deal:
- @Reputation = 1 with index scan – does about 80k logical reads, takes about 30 seconds (but mostly because SSMS has to render 3mm rows)
- @Reputation = 2 with index scan – does about 80k logical reads, takes about a second (because there’s only 5305 rows)
If you look at the actual plan for @Reputation 2 here, and hover your mouse over the Clustered Index Scan operator, you’ll notice that SQL Server doesn’t just save the plan – it also saves the estimates. We’re expecting 3.3mm rows to come back here – even though only 5,305 do. Who cares, though? Overestimating is awesome, right?
But then something goes wrong.
Somebody:
- Restarts Windows
- Restarts the SQL Server service
- Frees the procedure cache
- Puts the server under memory pressure (thereby pushing this plan out of cache)
- Doesn’t run the query for a while
- Rebuilds indexes on the Users table
- Updates statistics on the Users table
And somehow the execution sequence is reversed. First, we run it for @Reputation = 2:

We get an execution plan beautifully designed for tiny amounts of data. Hover your mouse over the index seek, and you’ll see that SQL Server accurately expects that only 5,305 rows will be returned. With the index seek, we only do 16,268 logical reads – even less than before! Great! Now that plan is in the cache.
You can hear the train coming. Let’s run it for @Reputation = 1:

SQL Server uses the cached execution plan, but it’s ugly, which means:
- We do an index seek, plus 3.3mm key lookups
- We do a staggering 10,046,742 logical reads (up from 80k) due to those repeated key lookups
- We only estimate 5,305 rows will come back, which means if we had added joins or sorts in this query, they would have spilled to disk
- We can’t see the terrible awfulness in the plan cache, which only shows estimates, not actuals
This is parameter sniffing:
good plans turning bad.
SQL Server builds one execution plan, and caches it as long as possible, reusing it for executions no matter what parameters you pass in.
If for some reason, the plan disappears from memory, the very next set of parameters determine the new execution plan.
Your next question is, “So how do I get the good plan back?” And here are the next steps on your learning journey:
- How to Start Troubleshooting Parameter Sniffing – how to grab the bad plan and get around the emergency.
- Slow in the Application, Fast in SSMS? Erland Sommarskog’s epic article covering much more details.
- Recompile Hints and Plan Caching – if you choose to use hints the wrong way, they have a drawback.
- Stabilizing Execution Plans with Guides – the combination of a plan guide and the NORECOMPUTE hint can help.
- Query Store – if you want to enable SQL Server 2016’s built-in plan recording feature so you can jump back in time to an earlier plan, start by reading Erin Stellato’s Query Store Best Practices before you enable Query Store. It has a nasty history of pretty ugly bugs and cruel defaults, so knowing these first will help you avoid outages.


2 Comments. Leave new
I don’t think that DBCC SHOW_STATISTICS actually invalidates the cached plans.
Andrej – oh great catch! I meant FREEPROCCACHE. Fixed, and thanks!