Blog

Trace Flag 2330: Who needs missing index requests?

Hey, remember 2005?

What a great year for… not SQL Server. Mirroring was still a Service Pack away, and there was an issue with spinlock contention on OPT_IDX_STATS or SPL_OPT_IDX_STATS. The KB for it is over here, and it’s pretty explicit that the issue was fixed in 2008, and didn’t carry over to any later versions. For people still on 2005, you had a Trace Flag: 2330.

Like most things, there are trade offs. When you enable it, SQL stops collecting missing index requests. Probably not a great idea unless you’re working with extreme edge cases where you’ve already tuned your indexes really well. Most people will never fall into that category, though many of them will think they have.

The issue that it quite commonly addressed was around the creation of many objects in tempdb. You probably don’t need missing index details on a bunch of temp tables. What a lot of people didn’t realize was that it also made SQL stop collecting them for every other database.

Here in 2015

That Trace Flag can still be enabled with the same effect. Some people may not be aware that it’s not fixing anything, and still hurting things. Below is a script to reproduce the lousiness in a user database.

First we’ll clear out missing index requests by rebuilding the index (you know this happens, right?), and verify that there are no missing index requests with sp_BlitzIndex®. Running it in @mode = 3 will generate only missing index request details.

Once we verify that’s empty, we’ll run a query that will generate a missing index request in the Stack Overflow database, and verify it registers with sp_BlitzIndex® again.

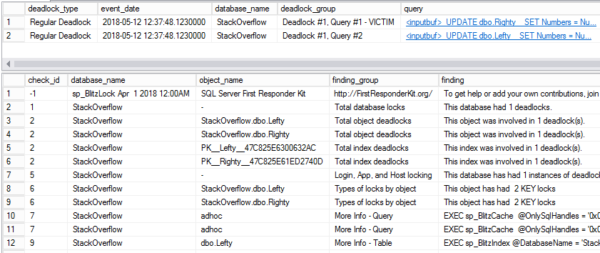
Whaddya know? We got ourselves a missing index.

You look helpful! What's your name?
You look helpful! What’s your name?

Now comes the ugly

We’ll enable TF 2330 globally, and use some GO magic to run the same query 5x consecutively, then check back in on sp_BlitzIndex®.

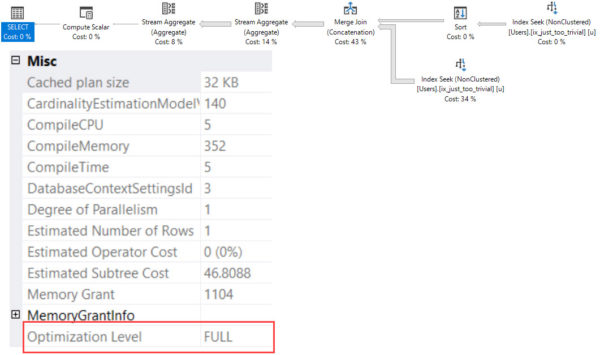
The compiles ticked up one, but SQL stopped counting requests for the index.

Bummer.
Bummer.

There is a light

But hey! We can turn that off. And… Well, you know the drill.

We have stopped breaking SQL!

1 + 5 = 6, FYI
1 + 5 = 6, FYI

What did we learn?

2005! What a lousy year for hair, and Trace Flags, and, uh, I don’t remember much else about 2005. Feel free to tell me what you hated about 2005 in the comments. Just check all your servers to make sure no one turned on this Trace Flag as an April Fool’s Day joke and then never came back from lunch, first.

Thanks for reading!


Angie Walker Joins Brent Ozar Unlimited

Company News
23 Comments
The newest cartoon face at Brent Ozar Unlimited: Angie Walker

Brent says: remember a couple months back when we announced that we were hiring a SQL Server Triage Specialist? We’re really proud to welcome Angie Walker to our funky little medical team. When you bring us in for a SQL Critical Care®, Angie might be the first person you work with to make sure the server’s in a safe place. Let’s hear how she got here….
learn
Angie says: WHERE TO START…?

As with many IT professionals I’ve met, I didn’t intend to find a career in IT, but took when an opportunity came along a few years back, I jumped at the chance.  After a couple of years, I moved to a Junior DBA position and I’ve been learning SQL Server ever since.  When I first started, I couldn’t tell you what a database was.  I remember the first time I forgot the WHERE clause on an UPDATE statement, blindly deploying code into production, and asking why we take backups.

The first session of the first SQL Saturday I attended was so packed, I sat on the floor, and watched Kendra present “How to Find Bad Queries, Fast”.  I didn’t know what she was talking about half of the time (What’s Perfmon?  Activity Monitor is the graphs, right?  She has pink hair!), but I hoped that if I took enough notes, I might be able to absorb some of what I heard.  And I keep going to SQL Saturday and SQL user groups for that exact reason.  I might not understand today, but one day it might click when I see the issue or feature firsthand.

The world of SQL Server is vast, murky, and sometimes scares me, but knowing where to look for help has been vital.  I’ve been following Brent Ozar Unlimited for almost three years; signing up for the Accidental DBA 6 Month Training Plan, taking advantage of Kendra’s “DBA Job Interview Question and Answer Kit” for my first DBA interview, trying (and failing) to score killer Black Friday deals last year, and of course, following the blog every day.

So when I saw the open Triage Specialist position, I knew I HAD to apply.  The morning I woke up, checked my email, and saw Kendra Little was emailing me, I was bouncing around as if I drank three cups of coffee.  I mean, I read the blog and use the tools, and even though I know they might be real people, the possibility to work alongside some of the most well-known folks in the business seemed too good to be true!  When I met with Kendra she was so nice and I thought it went really well, but when she said it would take about two weeks to hear back I had to stop myself from thinking that she was trying to let me down easy.  I didn’t know just how badly I wanted the job until I got the invite for a second interview – It didn’t matter that I didn’t know everything about SQL Server, I have to learn it, and who better to learn from than Brent Ozar Unlimited?!  So I prepared myself for the interview with Kendra, Jeremiah and Brent…  And I must have done something right, because here I am!

I’m super excited for this new adventure as the newest member of the Brent Ozar Unlimited team!


SQL Server 2012 SP3 Adds Memory Grant and Performance Features

New ways to measure your queries. And fish.
New ways to measure your queries

SQL Server 2012 SP3 has just been freshly released! Not only does this release contain bug fixes, it also contains a slew of performance tuning related features.

Many of these features are about memory grants. This is NOT the memory used in the buffer pool/ data cache by the query — it’s the memory also known as Query Workspace Memory. Start reading more here.

Check these out:

KB 3107398 – Improvements to sys.dm_exec_query_stats

This is kind of a big deal. The sys.dm_exec_query_stats DMV will now report on total, last, min and max statistics for granted workspace memory, ideal workspace memory, degree of parallelism, and reserved threads. These columns are in SQL Server 2016 CTP3, but it’s really awesome that they’ve been backported town to 2012!

KB 3107397 – “Actual Rows Read” Added to Query Execution Plans

This is really exciting! It’s hard for people to read execution plans. You may have a very large index seek or scan that reads a ton of rows, and it has a hidden filter in the seek or scan. But it may be hard to diagnose because you only see the number of rows to come OUT of the seek or scan operator. This lets you know not only the rows that exit the operator, but how many it had to consume, too. It’s sorta like having a little bit of STATISTICS IO in your execution plan!

KB 3107401 – New Query Hints for min_grant_percent and max_grant_percent

Previously, if you identified that a query was asking for a problematic memory grant, your options were pretty limited – code changes, index changes, resource governor, or server wide settings. These options let you shoot yourself in the foot tune this just for a single query. Check out the KB– there is a safety in the feature. If the minimum required grant is higher than max_grant_percent, it will still get the minimum.

KB 3107172 – hash_spill_details Added to Extended Events to Diagnose tempdb Spills, Improvements to sort_warning and hash_warning

Ever seen sort or hash spill warnings in execution plans and wondered how much of a difference they were making to the runtime of the plan? That may be less of a mystery with these improvements.

KB 3107173 – query_memory_grant_usage added to Extended Events

This XEvent allows tracing for the ideal memory grant for queries, what they actually got, and the degree of parallelism they used.

What About SQL Server 2014?

I don’t believe any of these are currently available for SQL Server 2014, but looking at past release patterns it’s likely they’ll be available soon.

PSA: Don’t Forget to Test Your Service Packs

Even the best laid plans can sometimes go awry.


Brent’s Bad Idea Jeans: Stop People From Changing Tables with This One Trick

Bad Idea Jeans, Humor, SQL Server
21 Comments

Developers hate his bad idea jeans:

Presto, the schemabinding option means no one can change the underlying tables. (At least, until they figure out about your view.)

Obligatory disclaimer: seriously, this is a really bad idea. But it’s hilarious.


Why is SQL Server Slow Sometimes – But Only Sometimes?

SQL Server
11 Comments

Have you got a SQL Server that usually performs just fine, but every now and then, everything falls to pieces? Users complain about performance, and then minutes – or hours – later, the problem just mysteriously solves itself?

Here’s a few things to look for:

Are data or log files growing? When SQL Server needs to grow a file, it can bring all transactions in that database to a grinding halt. You can mitigate this issue by turning on Instant File Initialization, pre-growing out your data and log files, and using smaller autogrowth sizes. To figure out if this is your root cause and which cure makes the most sense, run sp_Blitz® and look for the warning about data and log file growths that have been taking more than 15 seconds.

Are queries being blocked? If one query takes out a lock that prevents other queries from getting their work done, it presents interesting symptoms. Your SQL Server’s CPU use might look low – but it’s because so many queries are sitting around idly waiting. To diagnose, start by running sp_BlitzFirst® with the @Seconds = 0, @ExpertMode = 1 parameters to check your wait stats since startup. If LCK* waits are significant, then start digging at the database level. Run sp_BlitzIndex® in each database, and look for the Aggressive Indexes warnings about indexes that are a frequent blocking sore spot. Consider dumping indexes you don’t need on those tables (to speed up deletes/updates/inserts), and adding the right indexes that you do need (to speed up other queries).

Sometimes I choose the wrong coffee tap, and I'm predictably slow.
Sometimes I choose the wrong coffee tap, and I’m predictably slow.

Are queries being rolled back? If a query fails – either due to being canceled, or running into an error, or hitting a deadlock – SQL Server has to undo their work. This may cause blocking, or it just may hammer storage. This one’s a little trickier to catch. If you run into it live, then you can see it with sp_BlitzFirst® – it warns about queries that are currently rolling back.

Did a bad plan get into cache? When you run parameterized SQL, SQL Server builds an execution plan based on the first set of parameters it sees. Normally, parameter sniffing is a good thing, but sometimes it goes awry. You can have a plan get pushed out of cache (due to memory pressure or statistics changes) and then get compiled based on the first – possibly unusual – set of parameters that come in. That plan might not work so well for other sets of parameters, and it can degrade performance on the whole box until a new plan is generated for it. You can learn more about solutions in this blog post about parameter sniffing, and to diagnose it, run sp_BlitzCache®. Look at the top resource-consuming queries, and see if an unusual one has suddenly jumped to the top of the charts.

Are shared resources under pressure? In virtualization environments, other guests may be using an increased amount of CPU, memory, or storage throughput, giving your guest less horsepower. In shared storage environments, other servers might be doing backups or disk-intensive workloads. In multi-instance servers, another instance on the same box might be the real culprit. To identify these, check out wait stats with sp_BlitzFirst®.

Looking back at what I’ve written, I’m sure someone’s going to say, “Brent, you’re just trying to pitch tools.” And sure, I am – they’re free. I want you to use the same powerful tools that we use every day in our consulting. Your job is hard enough without reinventing the wheel!


Is My SQL Server Too Big for Virtualization or the Cloud?

SQL Server
15 Comments

Let’s set size aside for a second. Here’s the order in which you should try new technologies – whether it’s virtualization, cloud, storage, or whatever:

  1. Development servers with less than 100GB of data
  2. Production servers with less than 100GB of data
  3. Development servers with <1TB
  4. Production servers with <1TB
  5. Development servers with >1TB
  6. Production servers with >1TB

It’s simple: start with the lowest risk, easiest-to-manage servers first. Learn your lessons on smaller servers, then gradually use the technology on larger and larger servers.

If at any level, your users complain about performance and you can’t figure out how to fix it, stop at that level. Don’t go farther.

It’s not that 1TB of data is too big to virtualize or to move into the cloud – it’s not. But your skills may not be up to the task, and you need to sharpen those skills before you attack a larger performance problem.

It all comes back to my post, “How Many Databases Can I Put on a SQL Server?”


What kCura Relativity Best in Service Means for SQL Server DBAs

kCura Relativity, SQL Server
2 Comments

Best-in-Service

kCura Relativity is a legal e-discovery application that hosts its data in SQL Server. You can host it yourself, or hire a hosting partner who specializes in hosting it for you. The best hosting partners compete for Best in Service status, an award that means what it says on the tin.

Starting this year, kCura’s toughened up the requirements for Best in Service. It ain’t Average in Service, or Good Enough in Service. As a result, database administrators have some extra work to do.

Best in Service requires a disaster recovery plan.

Deep, calming breaths. I didn’t say a warm standby data center – I just said a plan. It might be perfectly okay for your plan to be, “Step 1: panic. Step 2: call Brent to bring our databases back from the dead.”

Here’s the thing, though: at some point, one of your customers is going to ask to see the plan. (I know, because I’ve been involved in some of those conversations.) You don’t want to show them a plan that looks that way.

Use these resources to get started:

Best in Service Requires Transparency

kCura’s all about transparency, right down to the Trust portal that shows Best in Service partner service status. Today, publishing your scores is optional – but come summer, it’s going to be mandatory.

That means if you miss backups or DBCCs, the whole world’s gonna know.

And it’s going to cost your business real money.

I’m wildly excited about this because it brings business focus to a very important DBA job duty. It’s your job to make sure the data is safe and secure. Start measuring it and checking today before you have awkward management conversations this summer.


#FreeCon 2015 PASS Summit Recap

SQL Server
4 Comments

We believe that when you’re at a community event, the most valuable thing isn’t what’s up on the screen. Instead, it’s building relationships with the people around you.

With that in mind, over the last five years, we’ve run a series of FreeCons – totally free networking events for the SQL Server community.

This year’s FreeCon at the PASS Summit in Seattle was our most ambitious yet. We rented out a movie theater for 50 folks and shared:

  • Identifying what you’re proud of now, and sharing that with those around you
  • Setting goals for yourself over your next year
  • Learning about personal branding
  • Understanding the difference between outbound and inbound marketing
  • Planning which inbound marketing tasks to do, in which order, and how long they’ll take
  • And of course, throughout the event, sharing all of that with those around you, and building meaningful lifelong relationships

We’re really proud of the results and the reactions:

Ed Leighton-Dick wrote: “For many years, I focused primarily on the technical aspects of my profession. That focus served me well, but I realized several years ago now that I needed to start developing some soft skills, also. Skills such as marketing have continued to elude me, but yet, they have become critical as I build my consulting practice. Thanks to Brent and Kendra for all their work in putting on the FreeCon, and thanks to all the rest of the attendees for a fantastic day – I learned a lot from all of you!”

Chris Yates wrote: “One thing that stuck out to me was the authenticity shown by both Brent, Kendra, and Doug along with the 50 or so of us who were asking questions.”

https://twitter.com/CraigPurnell/status/658804548941828096

And Richie Rump tried to follow along:

Thanks to everyone who joined us – you were really the secret to making this event a lasting success.


Interviewing: How to Test TSQL Writing Skills

SQL Server
12 Comments
The candidate at work
“Sure, I write great queries!”

We sometimes help clients interview DBAs and Developers for their team. Requirements vary depending by position, but sometimes it’s important to test a candidate’s TSQL skills.

While I can test candidates thoroughly on strategies for TSQL (when they’d use certain constructs, the pros and cons of various approaches), if what you care about is skills writing complex TSQL there’s one surefire test: a lab.

The first step is to pick your dataset and environment, then dream up the TSQL query you’d like your candidate to write. Next, test it with one of your own staff members and make sure the problem is suitable for the job you’re trying to fill.

But you may not want to give candidates access to your production, or even development data — after all, they don’t work for you yet.

Good news, there’s an easy way to do this online! Check out the Stack Exchange Data Explorer. You can assign the candidate a query to write using this tool online.

How to make it work:

  • This only works for in-person interviews. Because human nature.
  • You’re going to need a moderator and at least 30 minutes, because the candidate will need to figure out the schema.
  • A history of queries is kept in the tool. You’ll need to let them know they can’t search that history, and it’s up to you if you’re going to let them use Books Online (hey, we all use it in the real world).

If you don’t want to deal with the hassle of the query history online, you can always download a copy of the Stack Overflow database and set up your problem on a locally installed test instance of SQL Server, too.

The secret test: if your candidate likes writing TSQL, they’re going to love the challenge and it will energize them.

Happy interviewing!


The case for Query Store in tempdb

Query Store is so cool

Billed as a flight data recorder for SQL Server, the Query Store is a repository of execution plan information, like the plan cache, except a bit more actionable. And it has a GUI.

"Try looking into that place where you dare not look! You'll find me there, staring out at you!"
“Try looking into that place where you dare not look! You’ll find me there, staring out at you!”

You can read all about what it does and what you can do with it around the internet. You can be suitably impressed and enchanted by the promise of data that’s persisted between restarts, being able to quickly and easily address plan regression issues, and so forth.

I’m here to bum you out when you’re done with all that.

You can’t use it in tempdb

On tempdb? Whatever.

What? Really? With all the stuff that goes on there? Aside from the many selfish demo reasons I have for wanting it, I know lots of people who make tempdb their default database for user logins so they don’t go messing things up in the real world, or more fragile system databases. I’m also aware of several vendor apps that dump users into tempdb and then use fully qualified names to point them to application data.

I found this all out by accident. I had just nabbed CTP 3 of SQL Server 2016, and was settling in for an evening of staring contests with execution plans and new features.

That’s when tragedy struck I got an error message:

And yeah, it’s an official no-go

Oh, but I model and msdb are fair game?
Oh, but model and msdb are fair game?

I’m all disillusioned and stuff, man.

This is going to be frustrating out in the wild for a lot of people. Not just fancy-pants camo shorts consultants who like to make demos where they treat tempdb like it owes them money. Real people. Who pay real money, for real servers.

Anyway, there’s a Feedback request to get this changed. Vote for it. Or don’t. Just don’t vote more than once, or if you’re dead.


My Favorite Moments from the 2015 PASS Summit WIT Lunch

#SQLPass
0
The speakers are great, but the audience is great, too!

One of the great things about the SQLPASS Summit is the annual Women in Technology lunch. Not only does the lunch feature an interesting presentation, but you get to talk to men and women at your table about diversity, how to build better teams, and how we can help others.

Many of the best moments at conferences happen when you connect with your peers. The two things I found most fascinating at the WIT lunch this year came from my table and from audience questions.

We can give back. Kathi Kellenberger’s doing it!

I was lucky to sit at a table next to Kathi Kellenberger. She shared with me that she volunteers as a mentor for LaunchCode. Kathi volunteers as part of this free, non-profit program to inspire and teach talented people and help them land jobs in IT.  She trains her group regularly in person and provides awesome, free online resources for CoderGirls.

I’m really inspired by the work Kathi is doing. Rock on, Kathi!

Harvard offers free tools to test for unconscious bias

Most of us like to think that we aren’t biased. But we may have unconscious tendencies that we don’t realize. An audience question led to Denise McInerney giving a shout out to Cindy Gross.

Cindy is on the Azure CAT team, and has recently begun presenting to people and encouraging us all to take free online tests to help us identify our unconscious bias as a first step to building better, happier teams.

Thanks PASS, for hosting such a terrific lunch. I’m already looking forward to attending next year.


SQL Server Features I’d Like To See, PostgreSQL Edition

SQL Server
22 Comments

BUT FRANCE HAS A FREE PONY

That’s right. PostgreSQL is basically free. The MIT license is like the Church of England of licenses. They do not care what you do.

But I care what they do! If you read the first part of this article, you saw some Oracle features that I wish SQL Server had. Over here, I’ll be talking about some cool stuff PG does that SQL doesn’t do. At least not ‘natively’. There are workarounds, but we’re still getting some circles run around us.

So here goes!

Unlogged Tables! Forget wrestling with minimal logging, which sometimes just doesn’t work, no matter which Trace Flags and hints you throw at it. You can just tell the engine you don’t care about this table and it won’t log any transactions for it. Yeah, put that in your ETL and smoke it.

Generate_series! This is one of those things that I used, and then spent hours playing with. You know all that crazy stuff we do with Tally Tables and Date tables? Yeah, PG users just use generate_series, and it spits out the range of values they want. It works with numbers and dates, and even handles intervals. It’s pretty wonderful. Sick burn.

Arrays! Between array_agg and UNNEST, PG offers simple ways to handle a couple things that SQL Server users spend a lot of time trying to hack together T-SQL and CLR methods to deal with. If you’ve ever been mortified and confused by those SELECT STUFF FOR XML PATH shenanigans we use to create lists/arrays, or read one of the bounty of articles and arguments about splitting strings in SQL Server, you’d probably buy features like this a steak dinner.

BRIN Indexes! As a guy who has dealt with a lot of large tables, and large indexes, something like this is really awesome. A Block Range Index basically stores high and low keys for each, you guessed it, Block Range within the index, and decides which blocks it needs based on those values. The upside is that indexes of this type are TINY compared to traditional indexes. It’s a lot more like scanning the statistics histogram to figure out which steps you need, and then retrieving those steps.

Multiple language stored procedures! Yep. Write a stored procedure in a language you’re comfortable with. Tell PG what the language is at the end of the stored proc, and it will use it. If you’ve ever used CLR, and struggled with .dlls and trustworthy and blah blah blah, this probably sounds like a dream.

MINDOP! Just kidding. But I do wish we had this. It’d be way more useful than, like, Service Broker, or Resource Governor, or Affinity Masking, or Priority Boost, or… I’m getting carried away. Apologies; Parallelism riles me.

Anyway, I hope you enjoyed these, and I hope that you’ll give other database systems a look. There’s some pretty cool stuff out there.


Free SQL Server Magnetic Poetry Kits

SQL Server
9 Comments

We were looking at magnetic poetry words on a public bathroom wall (true story, insert TempDB joke here) and thought, “You know what would be really awesome? If there was one of these for databases.”

So we made ’em.

SQL Server Magnetic Poetry

Each of us put together our own favorite database words, so we each have our own sheet.

To get one, just track us down at a conference or user group. This week, Doug & Kendra will be at the PASS Summit in Seattle, and I’ll be at SQL Intersection in Vegas. The more of us you meet, the more words you’ll be able to work with, since we’ll each carry our own sheets.

Share your favorites with us on Instagram or Twitter with the tag #SQLpoetry. We’ll pick out our favorites and send you a little something special.


Announcing sp_BlitzCache v2.5.0

SQL Server
14 Comments

Woohoo, it’s another half of the year which means it’s time for another version of sp_BlitzCache®. The last version came out on June 18th, and it’s been about 4 months. In that time frame, you have requested some new features, and they’ve slowly trickled into sp_BlitzCache®.

If you don’t want to wait, head over to the download page and get yourself an sp_BlitzCache®!

In no particular order:

Default Values

Raul Gonzalez pointed out that if you set all of the parameters to NULL, sp_BlitzCache® will fail. This happens by default when you script execution through SSMS. Why SSMS does this is beyond me, but there you have it. sp_BlitzCache® will now get really upset and fail to run with a nice error message if you set any of the following to null:

  • @top
  • @sort_order
  • @query_filter
  • @reanalyze

Yay, errors!

Expert Mode

You guys are smart. I mean really smart. To help you keep being smart, I added a bunch of columns to expert mode. Ready?

  • Compilation memory
  • Compilation CPU time
  • Compilation wall clock time
  • Query hash and query plan hash
  • Cached plan size
  • Serial desired and required memory

Lean Options

sp_BlitzCache® used to pull back a lot of data by default. I mean… a lot of data. This could cause execution time to go through the roof on busy systems and systems with big plans. The default value for @top has been reduced to 10. You can still set it back to whatever you want, but just know that you can change it back to the way it was before.

There’s also an option to @skip_analysis. This bypasses the XML shredding that goes on in the execution plans. When you skip the XML analysis, you won’t find out if you have plan warnings or missing indexes, but your executions of sp_BlitzCache® will be much faster and you’ll use less CPU. Use this on heavily resource constrained systems.

Speaking of XML – The XML checks were re-written to be smarter and require less CPU time. We still have to scan the CPU, but I’ve re-written the XQuery in ways that shouldn’t need anywhere near as much CPU time as it used to. The upside is that this also makes it easier to add more checks to sp_BlitzCache®.

Sorting Results

There are two big changes to how results are sorted. One for speed and one for functionality.

An additional sort order option has been added for recent compilation. If you want to sort by recent compiles, just run EXEC sp_BlitzCache @sort_order = ‘compiles’

Some sort orders have always been slow (I’m looking at you “executions per minute”). New changes have pushed the sort earlier int he query and, in testing, these changes make performance faster, especially on busy systems.

Making Big Numbers Smaller

There was a potential for the totals temporary table to have integer overflows. I fixed that.

Basically, there was a significant chance that you might run into problems where you’ve burned through more than 600 hours of CPU time (that’s 2,147,483,647 milliseconds BTW). To help you avoid errors when you’re actually using your CPUs, I added a bunch of math to make numbers smaller. No, really, that’s about all that I did.


In Review: SQL Server 2005 Waits and Queues

Wait Stats
7 Comments

Back in November of 2006, Microsoft released “SQL Server 2005 Waits and Queues” as a best practices article. Many people in the SQL Server community have referenced this article as a great place to get started with understanding waits in SQL Server. Heck, I’ve recommend it on a regular basis.

The last time I recommended it I told the recipient, “This is great, but only read it from page X to Y.”

After nearly 10 years, this paper is showing its age. As you read this critique, and if you read the paper, it’s important to consider the historical context. “SQL Server 2005 Waits and Queues” is the first of its kind for SQL Server.

High Level Overview

The idea of the article is that developers and DBAs should use the waits information to identify areas of slow performance in SQL Server (waits) and then associate that with performance monitor counters (queues). The authors imply a methodology that starts with waits, correlates through other data, and, if followed correctly, eventually arrives at a solution for your performance problems.

The core concepts of “SQL Server 2005 Waits and Queues” are solid; queries wait, SQL Server records the waits, you interpret the waits. The overall methodology that the authors propose is a good one, too. Gathering evidence and correlating the evidence with other signifiers is a sound way to approach problem solving.

The devil is in the details. And, in this case, the devil has a hangover.

In the Beginning…

The “SQL Server 2005 Waits and Queues” paper starts off benignly enough. There are places where it sounds downright revolutionary. Even today very few people consider things like:

We outline a methodology that considers performance from the perspective of application, SQL Server, and correlates this to the system or resource perspective.

The Purpose section goes on to mention “This paper outlines a best practice methodology and provides guidelines and thought processes to identify poor perfoming applications”. If “SQL Server 2005 Waits and Queues” stuck to defining process and high level guidelines, this paper would be gold. The process that the authors outline takes a top down approach that allows an observer to start at a system level, rapidly identify problem areas, drill down to the root cause, and then solve the problem.

This Is How We Do It

Immediately after the Purpose section, the authors dive into their performance methodology. Waits are dsecribed as the observed symptom of a problem and perfmon counters are the proof. Or, to look at it another way, waits are what the application observes and perfmon counters are resource waits.

In a stroke of genius, there’s a lengthy example where the authors explain how correlating between lock waits and perfmon counters can help an observer determine if there’s really a problem going on. The crux of the argument is that “associations or correlations allow us to determine relevancy to overall performance”.

Averages are all that we have to go on when passively observing SQL Server. But in many cases, averages are misleading. In the example given, the authors mention looking at average lock time over a given window (the use of averages comes up a lot in this paper). It’s important to remember that averages can be heavily skewed by outliers.

Remember, the methodology described in this paper is a good first glance, but you can’t use it to rule out a specific problem. You can only use this methodology to determine which areas of SQL Server are a performance problem.

The methodology section doesn’t skimp on details. It provides a description of the SQL Server query wait model (running, waiting, runnable) and examples of how a query can move through this.

Unfortunately, it’s in this section where the first hints that’s something isn’t right show up. “A low signal (where signal is less than 25% of the total waits) to resource wait ratio indicates there is little CPU pressure.” The problem isn’t with the statement; if queries are spending 25% of their time waiting to get on a CPU, you’ve got problems. The problem is that the statement comes with no context – there’s no information about why the signal:resource wait ratio is bad and what should be done about it. This problem persists throughout a lot of the paper, too. It’s assumed that the reader knows where to go for verification of the absolute ratios that are provided.

Blueprints

Building a better SQL Server future

The authors of “SQL Server 2005 Waits and Queues” attempt to provide performance tuning blueprints for both OLTP and data warehouse applications. If you’ve ever build a house, you know that blueprints change the minute you go out in the real world and these blueprints are no exception. When I was reviewing this article, I scrawled in the margin “here’s where things go south for a while”.

The blueprints attempt to set up a list of scenarios that DBAs need to watch out for. These are typically based on hard and fast thresholds for perfmon counters and DMVs – more on that in a minute.

Although many people have pure data warehouse systems, it’s increasingly rare to find a purely transactional system. A pure transactional system is entirely single item select, insert, update, and delete; there are no reports. This was uncommon back in 2005/2006 and it’s even less common today – business users insist on viewing live data and we have no choice but to deliver. It’s left up to the reader to determine how to synthesize appropriate metrics based on the pure OLTP and pure data warehouse blueprints.

Here’s my first major issue with this article: hard and fast advice is rarely correct. The OLTP blueprint contains a huge amount of advice that could put users in a lot of trouble. In no particular order, developers will run into advice like:

  • Have three or fewer indexes on frequently updated tables.
  • Queries with more than 4 joins can be too normalized for high OLTP scalability.
  • Avoid scans on tables since a missing index flushes the cache.
  • Page Life Expectancy should always be over 300.
  • Page Life Expectancy should never drop by more than 50%.
  • Reads should take 4-8 ms without any IO pressure.

Take that in for a minute.

All of these statements are listed in the “SQL Server 2005 Waits and Queues” article. They’re all presented as hard rules to follow and that indicate performance problems. But there’s no evidence given for any rule being true, nor is there any condition given for re-evaluating them. The authors do provide a single line caveat “the values in Value column are good starting point. The actual values will vary.” At least their bases are covered for being wrong.

Computers have changed significantly in the last 10 years. SQL Server has seen 4 releases since this paper was published and we’re about to be on SQL Server 2016. The query optimizer has seen improvements, storage devices have seen improvements, and memory has seen improvements. When this paper was released, a dual core Xeon was a high end server CPU. In 2015 I have a quad core processor in my phone; it’s not uncommon to see 4, 6, or 8 core processors in modern servers.

As you read through the blueprints, it’s important to remember how things have continued to change in the SQL Server world. The first rule for data warehousing insists that data warehouses should have more indexes, not fewer. Whereas a lot of modern thinking on data warehouses runs counter to this and is focused on making sure disk throughput is fast enough.

Other gems from the data warehouse blueprint include:

  • Avoid plan re-use.
  • If top 2 sys.dm_os_wait_stats values contain IO, there’s a blocking bottleneck. (Never mind that a data warehouse will usually have more data than RAM and will need to read from disk)
  • Avoid big scans because a missing index flushes the cache.
  • “The time taken for plan generation of a large query is not nearly as important as having the right plan”.

It’s noble that the authors make these attempts, but the blueprint requires a significant amount of customization and modification to make it worth considering, much less using in production.

The real value of the blueprint comes from suggested correlations between counters and waits, but you need to have solid baselines and a good understanding of how different parts of SQL Server work in order to synthesize this into something meaningful.

By the way, this only gets us to page 16 of 94.

Just eat the candy, already.

What’s Stopping You?

The next major section deals with finding the typical resource bottlenecks in a SQL Server. This is a pretty boring section, truthfully. It contains descriptions of problem areas (“memory”, “IO stalls”) and a sample query that will help the reader look into the problem.

The biggest specific complaint I have about this section is that the authors insist on usingPage Life Expectancy as a meaningful performance indicator.

Outside of that, there a glaring general concern – at no point does this paper tell the reader what to do with the information gathered by these queries. It’s left up to the reader to interpret IO stalls, memory pressure, missing indexes, and query plan problems. During a presentation I’ll sometimes answer an unforeseen question with “that’s an exercise left up to the reader”, readers of 100 page best practices articles come to an article expecting best practices, not homework.

It’s also in this section where vague guidelines start to creep in. Readers are instructed to “make sure that the [blocked process] threshold is not too low” – the default for this is 5 seconds, earlier in the article it is recommended that the blocked process threshold should be 30 seconds. But no guidance is provided to help a DBA determine the right threshold.

And, ultimately, that’s my chief complaint – there’s very little reasoning given around the numbers presented in this best practices article. It’s assumed that the reader knows SQL Server well enough to read between the lines, refine existing numbers, and synthesize additional performance metrics. When support information is provided, it’s often in the form of another best practices article. These vary in length from 20 pages to 100 pages – I don’t know about you,but the idea of reading War & Peace: Best Practices Edition over the weekend doesn’t sound that fun.

The “Good” Part

Starting on page 22, this best practices paper turns into a list of SQL Server wait types and correlating performance monitor counters. This goes from page 22 – 79. At that point, the “queues” portion kicks in and then you’re looking at performance monitor counters. I used to recommend that people read through the list of waits to get a better idea of what’s going on inside SQL Server.

Don’t use this part of the article.

Look at sys.dm_os_wait_stats. It has a much better explanation of individual waits.

Nowhere in this article do the authors explain which waits are ignorable and which aren’t.SOS_SCHEDULER_YIELD is given just as much weight as QPJOB_KILL. It’s left to you to determine if any of these waits are significant. Thankfully, we’ve got a wait stats script that will ignore many waits for you.

What’s worst of all is that some of the advice in this section is just plain crazy.

  • ASYNC_IO_COMPLETION – This is your SQL Server asynchronously writing to disk. To solve the problem, the authors suggest you check for memory pressure and bad query plans.
  • CXPACKET – The guidance for this wait type has been superseded by KB 2806535
  • DBTABLE – This wait is labeled “internal only”, but additional information is given on correlating it to performance problems. Should I even worry if it’s internal only? Can I even do anything about it?
  • Failpoint – if you made it to the Failpoint, you clearly haven’t reached your own internal fail point.
  • LATCH_x – SQL Server 2005 introduced sys.dm_os_latch_stats which helps a DBA determine which latches are causing problems. Does this paper point the reader to the right DMV? Nope. It just says “Possibly the most common case is contention on internal caches (not the buffer pool pages), especially when using heaps or text.”
  • LATCH_x + PAGELATCH_UP means you should partition the table, BTW.
  • If you see LCK_x you should check for memory pressure. Unfortunately, we’re left to our own devices to figure out how. If you’ve been taking this article at its word, you’re probably running for the First Church of Page Life Expectancy to find everything else.
  • OLEDB is explained to largely be caused by traces and linked servers. The mitigation, set up more traces, figure out where your client apps sit and whether or not they’re loading files, or query sys.dm_exec_requests to find out which SPIDs are seeing this wait. Nowhere does it mention stopping your traces and not using linked servers.
  • WRITELOG waits suggest looking in sys.dm_io_virtual_file_stats (good) and query plan output (bad). Raise your hand if you’ve ever successfully used a query plan to spot I/O problems.
Context switches are an important measurement of... something.
Context switches are an important measurement of… something.

Surely the queues section must be better… He said, hopefully.

  • Queue lengths are regarded as important. Disk queue length is especially spurious given modern storage technology. Formerly alarming numbers are now considered anemic – it’s not uncommon to see recommended queue depths as high as 128 or 256.
  • “Under typical circumstances reads should take 4-8ms” – they going on to remind you to check with your vendor. Which is good because 4-8ms of storage latency is either some kind of local solid state storage or else the time it takes your HBA to acknowledge a write.
  • Page Faults/sec – this metric is trash. It measure when your CPU can’t find a page in memory OR when the page isn’t in the cache the CPU thought it should’ve been in. This is normal. Also – you can’t control it. Even with all of your data in memory, your server will still show page faults occurring.
  • Pages/sec – this measures reading data to and from memory. Once again, this is junk. Microsoft PFE Clint Huffman debunked Pages/sec as a meaningful counter back in 2009.
  • Page Splits/sec is a counter to watch, right? Well, any addition of page to the end of an index is technically a page split. So is splitting a page. So we don’t know if these are good or bad, but they’re happening!
  • Context Switches/sec is mentioned as something to watch, too. According to the paper, if this goes over 20,000 there’s a problem and if it goes over 50,000 there’s a big CPU problem. One time I opened a program and it produced 33,000 context switches per second. Time to throw this laptop away.

At this point, I literally can’t even.

Conclusion

If you’re reading “SQL Server 2005 Waits and Queues” for the first time, read pages 1-7 and then skip to the conclusion. Ignore everything in between.

It’s important to consider this article in a historical perspective – it’s the first serious attempt at documenting a tuning process for SQL Server that combines perfmon counters and wait stats. In today’s context, the concrete advice from the article doesn’t hold up; but the concepts and broad methodology are still useful for identifying SQL Server problems.

If you are looking for guidance on tuning SQL Server using wait stats, more accurate information can be found in SQL Server Books Online and third party sites (like this blog).


The Five Stages of Dynamic SQL Grief

Development
18 Comments

Dynamic SQL can be an incredibly powerful tool in the pocket of a SQL Server developer. Developers frequently express amazement at the level of flexibility dynamic SQL offers, an astonishment at how quickly things get out of hand, and finally the humbling realization that such machinery nearly tore their limbs off. This process can be broken into five stages: The Five Stages of Dynamic SQL Grief. Here’s how to recognize where you, or someone you know, is at in their relationship with dynamic SQL.

Stage One: Denial

"Here's the flow control for our new switchboard proc."
“Here’s the flow control for our new switchboard proc.”

“THIS IS INCREDIBLE AND I’m going to use it everywhere!”

Stage one is where the developer will stare slack-jawed in amazement as the statement they just glued together like a words-cut-from-magazines collage not only compiles but returns results as expected. Suddenly, an entire universe of possibilities presents itself. What if we have one code path for admins and a separate one for power users? What if we just roll our INSERTs, UPDATEs, DELETEs, and SELECTs into one stored proc? That way we only have to make one proc per table.

But why stop there? What if we allow the user to pass in the name of the table they want to use? Then it’s one proc for the whole database! Oh this is going to rock people’s worlds when we roll it out.

SYMPTOMS OF DENIAL:

  • Over-exuberance
  • Disregard for/obliviousness to code performance, security, and the general lunacy of contemplating a universal stored procedure
  • Not yet tired of typing single quotes (‘)

Stage Two: Anger

“HOW MANY SINGLE QUOTES do i need?”

Stage two sees the developer having struggled to get their code to production due to a multitude of issues, including but not limited to:

  • Coding each of the many branches created by nested IF statements
  • Testing and debugging each branch of the code
  • Trial and error to figure out how many single quotes it takes to get the statement to compile

During this stage, the developer is irritable, but still resistant to the idea of simplifying anything. Their most important task is to get the code to run, and then ship.

If you see errors like these over the developer's shoulder, walk away slowly and quietly.
If you see errors like these over the developer’s shoulder, walk away slowly and quietly.

SYMPTOMS OF ANGER:

  • Refusal to believe complexity is part of the problem
  • Profanity-laced tirades about single quotes
  • Unwillingness to discuss the code with others
  • Disinterest in security flaws
  • Unfamiliarity with Erland Sommarskog
  • Occasional lower back pain

Stage Three: Bargaining

“WHAT DO I HAVE TO CHANGE TO GET THIS TO run?”

Stage three begins when the developer can no longer deny being overwhelmed, and they begin to simplify their code. They start looking for areas of obvious frivolity to remove in order for it to test successfully. It is a turning point; they have reached high tide of complexity and must send their wildest ideas back out to sea in order to make their code viable again.

SYMPTOMS OF BARGAINING:

  • Willingness to discuss code with others
  • Receptivity to feature-cutting suggestions
  • Continued disinterest in security flaws
  • Admission that they have been overly ambitious in the application of dynamic SQL

Stage Four: Depression

“WHAT WAS I THINKING?”

Stage four is the low point for the developer writing dynamic SQL. At this stage, refactored code now works as designed. However, the security issues which the developer refused to address are now at the forefront, and cause a second round of rewrites. Forcing the developer to undergo a second set of rewrites is the proverbial kicking them while they’re down, and their spirits are at an all-time low.

SYMPTOMS OF DEPRESSION:

  • A sudden interest in Erland Sommarskog
  • Realization that many of their other dynamic SQL patterns were ill-conceived
  • Extended work hours to fix their many, many bad ideas and security holes
  • Increased interest in large quantities of ice cream and Netflix

Stage Five: Acceptance

“I was a fool, but now I know better.”

Stage five is the rebound stage for a developer’s initial encounter dynamic SQL. The fog of depression begins to lift as they work through the second rewrite process. This may seem counter-intuitive. It is not the rewrite that lifts the spirits of the developer, but rather the transformation from uneducated caterpillar to educated butterfly that improves their mood. They now have clearer insight into the consequences of their code decisions. They realize dynamic SQL is not a universal translator for turning business logic into a single script, and they will not make that mistake again.

SIGNS OF ACCEPTANCE:

  • Willingness, if not eagerness, to discuss the topic of dynamic SQL
  • Close familiarity with Erland Sommarskog
  • Interest in other dynamic SQL references
  • Sense of humility about their code abilities
  • Return to nominal interest in ice cream and Netflix

If you encounter a SQL Server developer writing dynamic SQL, use this guide to identify which stage they are progressing through and treat them with empathy. They are going through a difficult time.


Introducing Our 2016 Scholarship Program for SQL Server Training

Company News, SQL Server
32 Comments

You work with Microsoft SQL Server – maybe as a developer, report writer, analyst, sysadmin, or DBA.

You want to learn more about how to make it faster and more reliable.

But your company can’t afford training. Maybe it’s a charity that needs to save every dollar to make a difference in the lives of others. Or maybe it’s a non-profit arts foundation, or a small startup that’s barely making ends meet.

We want to hear from you. We’re going to pick 25 SQL Server professionals to get access to a tailored set of training classes that focus on issues relevant to each person’s pain points.

The fine print:

  • You must already have a job working with SQL Server.
  • You must work for a foundation, non-profit, charity, or similar company that’s doing good work. It can totally be a for-profit company, just as long as they’re making a difference. (If you work for Ginormous Profitable Global Corporation, forget it.)
  • Your company or government rules must allow you to receive free or discounted training. (Some companies prohibit their employees from accepting gifts.)
  • You can be anywhere in the world. (Some of our scholarships will involve in-person training, and some will be online video training.)

Apply now – applications close Friday, November 6th.


Announcing Brent’s SQLSaturday DC Pre-Con: Performance Tuning When You Can’t Fix the Queries

SQL Server
11 Comments

Your users are frustrated because the app is too slow, but you can’t change the queries. Maybe it’s a third party app, or maybe you’re using generated code, or maybe you’re just not allowed to change it. Take heart – there’s still hope.

I do this every week, and I’ll share my proven methodologies to performance tune with indexes, SQL Server configuration switches, and hardware.

In this one-day workshop on Friday, December 4 at the Microsoft office in Chevy Chase, you’ll learn:

  • Simplified internals – how SQL Server turns your query into an execution plan
  • Wait stats solutions – a list of fixes for most common bottlenecks
  • Plan cache analysis – how to discover the most resource-intensive queries so you know if indexes and hardware will work
  • Monitoring metrics – what DMVs and Perfmon counters to monitor, and what thresholds to alert on
  • Hardware warning signs – how to prove your server is undersized for your workloads
  • Tools and scripts – the best free and paid tools to make your tuning job easier

This session is for developers, DBAs, and consultants who have to make SQL Server go faster. You should be comfortable writing queries and creating tables, but not as confident about interpreting SQL Server’s DMVs and diagnostic data. I’ll train you the same way I train my own clients.

This session will be demo-heavy, and you can play along. Bring a laptop running SQL Server 2005 or newer, with at least 100GB of free drive space. We’ll distribute the Stack Overflow demo databases on USB drives for you to restore, and you can follow along with the demos. You’ll get the load test scripts, run them against your laptop, and see how we solve various challenges.

https://www.youtube.com/watch?v=MMX9uh9Fn58

Space is limited to 100 attendees. Get your spot now for $199, and then register for SQLSaturday DC too. See you there!


SQL Server Features I’d Like To See, Oracle Edition

Oracle, SQL Server
55 Comments

BUT FRANCE HAS A PONY

I really like SQL Server. Most of the time. Okay, so most of the time I like SQL Server most of the time. Don’t get me wrong, if I had to go back through the career-time continuum and pick a RDBMS to work with, I’d probably still choose it over Oracle. Probably. And, because I don’t exclusively grow facial hair from my neck, I wouldn’t be allowed to choose PostgreSQL. They’d kick me off the mailing list.

Just kidding. You’re all handsome rogues. We could have had a nice life together, staring longingly into each other’s shoes and trying to implement parallelism.

I’d have DB2 here, but the cost of entry to the Developer Edition is rather steep. So, you know, I’m sure it’s great! But no. Though I would be really happy if Microsoft implemented ANSI Standard constructs into T-SQL half as fast as IBM does.

I have poked at Oracle and PostgreSQL a bit, and found they have some really cool stuff. Heresy, right?

Check out some of these Oracle gadgets and tell me they wouldn’t make your life a whole lot easier.

In no particular order:

Table restores! Built in! I’m very surprised we never got a feature like this. You can do it with a 3rd party tool like Dell LiteSpeed.

Adaptive Plans! Go to the link and read the second paragraph. Read it twice. Wipe the drool off your face.

UPDATE: Geoff Patterson has created a Connect item to get Adaptive Plans for SQL Server.

In-Database Row Archiving! You know all that stuff you do with partitions that Oracle already does better? Where you’re basically praying for partition elimination to not undo the two weeks of work you put in to setting up this partitioned table that developers are writing horrible MERGE upserts to? Yeah. You can just tell the engine to not pay attention to rows you don’t care about anymore when it accesses the index. Fancy that.

Bitmap Indexes! It’s kind of like a filtered index, except for all values of a highly non-selective column.

Materializing CTEs! Even though it’s undocumented, we use plenty of undocumented stuff in SQL Server to get the job done. This is really cool to me, since I’ve discussed this limitation in CTEs before. I’d love to see a way to do this in SQL with the same behavior; not having to create temp tables. It would be a nice way to get around issues with caching statistics for temp tables, and especially since MS is still fixing bugs around temp tables.

Are there more? Yeah, but this is a blog. Go grab a VirtualBox and read the documentation if you’re interested in learning more.


Training Plan for a SysAdmin to Manage Availability Groups

How hard is it for a systems administrator who’s used to running SQL Server on Windows Clusters to tackle Availability Groups? Our example system administrator knows a bit of TSQL and their way around Management Studio, but is pretty new to performance tuning.

Well, it might be harder than you think. First, let’s look at the skills needed to succeed. Then let’s tackle a sample training plan to get those skills.

Do You Have the Skills to Manage AGs? Take this Test!

sp_Blitz® Sanity Test

Incident Management Skills Test

  • Do you regularly use techniques to learn what’s running and how long it’s been waiting at any given point in time that are NOT SQL Server’s Activity Monitor or sp_who/sp_who2?  (Sorry for the bias, but Activity Monitor is full of lies, and those SQL Server 2000 tools don’t really help anymore.)
  • Do you have a documented incident response process to collect data when performance or availability suffers that at least 2 people can run?
  • Do you regularly execute a process to perform root cause analysis when performance is bad or the SQL Server is offline? (Only answer “yes” if it has successfully led to a real root cause 3 times in the last year.)

Performance Tuning Skills Test

  • Do you regularly analyze your SQL Server wait statistics and baseline them? (A “yes” means that you know what your top 10 bottlenecks mean, what “poison” waits are and what they mean if they show up, and you could quickly identify any changes in your top waits and react.)
  • Do you know the top 10 queries that run against your SQL Server by CPU, and have you tuned their indexes?

SQL Server Scripting/Configuration Skills Test

  • Do you have the scripting skills to be able to handle managing jobs across all nodes? Jobs must all run everywhere, and be smart enough to know who is the primary replica.
  • Do you have the scripting skills and security knowledge to be able to manage linked servers and logins across all replicas? (Don’t say yes if you haven’t done it before– it’s trickier than you think!)

Windows Clustering Skills Test

  • Have you successfully executed basic Windows clustering management tasks with the version of Windows you plan to go live on? These tasks are: configuring quorum, getting clean cluster validation reports, and using the Cluster Failover Manager.
  • Have you practiced advanced cluster rescue scenarios at least twice within the past year? (These tasks are: forcing quorum, generating and reading cluster logs)

Testing and Patching Skills Test

  • Are you subscribed to and do you actively review all hotfixes that come out for your version of Windows Failover Clustering and SQL Server?
  • Do you test and apply hotfixes and selective updates to a test environment on a regular basis as part of a patching deployment for production?

Here’s the deal: to do well with Availability Groups you need to honestly say yes to every single question on this list.

Closing the Gap: A Training Plan

The right training plan for Availability Groups includes learning from others as well as hands-on experience. To make this work, you need to be devoting at minimum 12 full days per quarter to learning. That’s at least one full day a week, and even then, your time may be very, very tight.

First Quarter: Learn the Pitfalls of AGs and Build your Incident Response Process

If you didn’t score two “yes’s” on the sp_Blitz® sanity test, that’s priority #1. Make sure you have completely covered that section before moving on.

Next, make sure you understand why you need to learn so much, and also make sure you really need AGs! Dig in and learn the basics about Availability Groups and why they’re so tricky, and how to choose the right HA/DR solution in SQL Server. Options:

Next, get working in production and build your incident response kit.  It will take work and time to get incident response and root cause analysis really working, but this is an absolute pre-requisite for working with AGs.

Second Quarter: Baseline and Analyze Wait Stats and top Queries

Focus on establishing lightweight monitoring and baselining your top waits and queries in SQL Server.

Third Quarter: Build a Prototype and Get Advanced Training

At this point, you’ve learned a lot about how to understand what SQL Server is telling you. It’s time to start understanding Availability Groups specifically.

  • Review your notes from what you learned about looking out for in AGs– and make sure you plan the right version of Windows and SQL Server that’s really right to use.
  • Set up a prototype environment. You need the same hardware and storage that you’re going to use in production. This isn’t a temporary environment, either: to live well with AGs you need a pre-production environment!
  • Restore full sized production databases to your AG environment and generate activity against it.
  • Make the environment fail! You need to cause failures in multiple places and validate that your incident and performance management tools really work in this brave new world.
  • Oh, and work on all those scripting skills, too.

At this point in the process, it’s time to learn from others and really make sure you’re on the right track. You can do this in multiple ways:

  • Attend a SQL Server conference that lets you attend “lessons learned” style panels– such as the SQL PASS Summit
  • Attend an advanced SQL Server DBA training class like our Senior DBA course

Fourth Quarter: Reassess Your Progress and Fill the Gaps

You’ve come a long way. But you still had a job to do with other tasks in it.

Step back and re-take the quiz. How are you executing on all of those tasks, and how many people can execute on them? Return to the areas where you’ve scored the weakest and build those skills up.

Yep, it Takes a Year

Availability Groups are a very cool, cutting edge tool in SQL Server. They’re expensive, but people are willing to pay the price because availability and performance really matter for them.

But if you’re not careful, the tool that you’re using to try to improve performance can slow you down– or take you offline entirely. And if you don’t have really strong incident management and performance tuning skills, you’ll have no idea if the problem is the AG or something completely unrelated.

The good news is that if you have a foundations in system administration, you know some TSQL, and you really focus your efforts, you can learn these skills in a year!

Not Sure Where to Find the Time?

Show your manager this post and talk about your answers to the questions above, and the fact that you need to fill the gap. Be clear about areas where you and your team are weak and strong, and what risks you’re concerned about if you take on more complex technology that you can’t handle. It may not always be obvious, but usually your manager wants you to succeed as much as you do!