Performance Tuning
In Review: SQL Server 2005 Waits and Queues
Back in November of 2006, Microsoft released “SQL Server 2005 Waits and Queues” as a best practices article. Many people in the SQL Server community have referenced this article as a great place to get started with understanding waits in SQL Server. Heck, I’ve recommend it on a regular basis.
The last time I recommended it I told the recipient, “This is great, but only read it from page X to Y.”
After nearly 10 years, this paper is showing its age. As you read this critique, and if you read the paper, it’s important to consider the historical context. “SQL Server 2005 Waits and Queues” is the first of its kind for SQL Server.
High Level Overview
The idea of the article is that developers and DBAs should use the waits information to identify areas of slow performance in SQL Server (waits) and then associate that with performance monitor counters (queues). The authors imply a methodology that starts with waits, correlates through other data, and, if followed correctly, eventually arrives at a solution for your performance problems.
The core concepts of “SQL Server 2005 Waits and Queues” are solid; queries wait, SQL Server records the waits, you interpret the waits. The overall methodology that the authors propose is a good one, too. Gathering evidence and correlating the evidence with other signifiers is a sound way to approach problem solving.
The devil is in the details. And, in this case, the devil has a hangover.
In the Beginning…
The “SQL Server 2005 Waits and Queues” paper starts off benignly enough. There are places where it sounds downright revolutionary. Even today very few people consider things like:
We outline a methodology that considers performance from the perspective of application, SQL Server, and correlates this to the system or resource perspective.
The Purpose section goes on to mention “This paper outlines a best practice methodology and provides guidelines and thought processes to identify poor perfoming applications”. If “SQL Server 2005 Waits and Queues” stuck to defining process and high level guidelines, this paper would be gold. The process that the authors outline takes a top down approach that allows an observer to start at a system level, rapidly identify problem areas, drill down to the root cause, and then solve the problem.
This Is How We Do It
Immediately after the Purpose section, the authors dive into their performance methodology. Waits are dsecribed as the observed symptom of a problem and perfmon counters are the proof. Or, to look at it another way, waits are what the application observes and perfmon counters are resource waits.
In a stroke of genius, there’s a lengthy example where the authors explain how correlating between lock waits and perfmon counters can help an observer determine if there’s really a problem going on. The crux of the argument is that “associations or correlations allow us to determine relevancy to overall performance”.
Averages are all that we have to go on when passively observing SQL Server. But in many cases, averages are misleading. In the example given, the authors mention looking at average lock time over a given window (the use of averages comes up a lot in this paper). It’s important to remember that averages can be heavily skewed by outliers.
Remember, the methodology described in this paper is a good first glance, but you can’t use it to rule out a specific problem. You can only use this methodology to determine which areas of SQL Server are a performance problem.
The methodology section doesn’t skimp on details. It provides a description of the SQL Server query wait model (running, waiting, runnable) and examples of how a query can move through this.
Unfortunately, it’s in this section where the first hints that’s something isn’t right show up. “A low signal (where signal is less than 25% of the total waits) to resource wait ratio indicates there is little CPU pressure.” The problem isn’t with the statement; if queries are spending 25% of their time waiting to get on a CPU, you’ve got problems. The problem is that the statement comes with no context – there’s no information about why the signal:resource wait ratio is bad and what should be done about it. This problem persists throughout a lot of the paper, too. It’s assumed that the reader knows where to go for verification of the absolute ratios that are provided.
Blueprints

The authors of “SQL Server 2005 Waits and Queues” attempt to provide performance tuning blueprints for both OLTP and data warehouse applications. If you’ve ever build a house, you know that blueprints change the minute you go out in the real world and these blueprints are no exception. When I was reviewing this article, I scrawled in the margin “here’s where things go south for a while”.
The blueprints attempt to set up a list of scenarios that DBAs need to watch out for. These are typically based on hard and fast thresholds for perfmon counters and DMVs – more on that in a minute.
Although many people have pure data warehouse systems, it’s increasingly rare to find a purely transactional system. A pure transactional system is entirely single item select, insert, update, and delete; there are no reports. This was uncommon back in 2005/2006 and it’s even less common today – business users insist on viewing live data and we have no choice but to deliver. It’s left up to the reader to determine how to synthesize appropriate metrics based on the pure OLTP and pure data warehouse blueprints.
Here’s my first major issue with this article: hard and fast advice is rarely correct. The OLTP blueprint contains a huge amount of advice that could put users in a lot of trouble. In no particular order, developers will run into advice like:
- Have three or fewer indexes on frequently updated tables.
- Queries with more than 4 joins can be too normalized for high OLTP scalability.
- Avoid scans on tables since a missing index flushes the cache.
- Page Life Expectancy should always be over 300.
- Page Life Expectancy should never drop by more than 50%.
- Reads should take 4-8 ms without any IO pressure.
Take that in for a minute.
All of these statements are listed in the “SQL Server 2005 Waits and Queues” article. They’re all presented as hard rules to follow and that indicate performance problems. But there’s no evidence given for any rule being true, nor is there any condition given for re-evaluating them. The authors do provide a single line caveat “the values in Value column are good starting point. The actual values will vary.” At least their bases are covered for being wrong.
Computers have changed significantly in the last 10 years. SQL Server has seen 4 releases since this paper was published and we’re about to be on SQL Server 2016. The query optimizer has seen improvements, storage devices have seen improvements, and memory has seen improvements. When this paper was released, a dual core Xeon was a high end server CPU. In 2015 I have a quad core processor in my phone; it’s not uncommon to see 4, 6, or 8 core processors in modern servers.
As you read through the blueprints, it’s important to remember how things have continued to change in the SQL Server world. The first rule for data warehousing insists that data warehouses should have more indexes, not fewer. Whereas a lot of modern thinking on data warehouses runs counter to this and is focused on making sure disk throughput is fast enough.
Other gems from the data warehouse blueprint include:
- Avoid plan re-use.
- If top 2
sys.dm_os_wait_statsvalues contain IO, there’s a blocking bottleneck. (Never mind that a data warehouse will usually have more data than RAM and will need to read from disk) - Avoid big scans because a missing index flushes the cache.
- “The time taken for plan generation of a large query is not nearly as important as having the right plan”.
It’s noble that the authors make these attempts, but the blueprint requires a significant amount of customization and modification to make it worth considering, much less using in production.
The real value of the blueprint comes from suggested correlations between counters and waits, but you need to have solid baselines and a good understanding of how different parts of SQL Server work in order to synthesize this into something meaningful.
By the way, this only gets us to page 16 of 94.

What’s Stopping You?
The next major section deals with finding the typical resource bottlenecks in a SQL Server. This is a pretty boring section, truthfully. It contains descriptions of problem areas (“memory”, “IO stalls”) and a sample query that will help the reader look into the problem.
The biggest specific complaint I have about this section is that the authors insist on usingPage Life Expectancy as a meaningful performance indicator.
Outside of that, there a glaring general concern – at no point does this paper tell the reader what to do with the information gathered by these queries. It’s left up to the reader to interpret IO stalls, memory pressure, missing indexes, and query plan problems. During a presentation I’ll sometimes answer an unforeseen question with “that’s an exercise left up to the reader”, readers of 100 page best practices articles come to an article expecting best practices, not homework.
It’s also in this section where vague guidelines start to creep in. Readers are instructed to “make sure that the [blocked process] threshold is not too low” – the default for this is 5 seconds, earlier in the article it is recommended that the blocked process threshold should be 30 seconds. But no guidance is provided to help a DBA determine the right threshold.
And, ultimately, that’s my chief complaint – there’s very little reasoning given around the numbers presented in this best practices article. It’s assumed that the reader knows SQL Server well enough to read between the lines, refine existing numbers, and synthesize additional performance metrics. When support information is provided, it’s often in the form of another best practices article. These vary in length from 20 pages to 100 pages – I don’t know about you,but the idea of reading War & Peace: Best Practices Edition over the weekend doesn’t sound that fun.
The “Good” Part
Starting on page 22, this best practices paper turns into a list of SQL Server wait types and correlating performance monitor counters. This goes from page 22 – 79. At that point, the “queues” portion kicks in and then you’re looking at performance monitor counters. I used to recommend that people read through the list of waits to get a better idea of what’s going on inside SQL Server.
Don’t use this part of the article.
Look at sys.dm_os_wait_stats. It has a much better explanation of individual waits.
Nowhere in this article do the authors explain which waits are ignorable and which aren’t.SOS_SCHEDULER_YIELD is given just as much weight as QPJOB_KILL. It’s left to you to determine if any of these waits are significant. Thankfully, we’ve got a wait stats script that will ignore many waits for you.
What’s worst of all is that some of the advice in this section is just plain crazy.
ASYNC_IO_COMPLETION– This is your SQL Server asynchronously writing to disk. To solve the problem, the authors suggest you check for memory pressure and bad query plans.CXPACKET– The guidance for this wait type has been superseded by KB 2806535DBTABLE– This wait is labeled “internal only”, but additional information is given on correlating it to performance problems. Should I even worry if it’s internal only? Can I even do anything about it?Failpoint– if you made it to theFailpoint, you clearly haven’t reached your own internal fail point.LATCH_x– SQL Server 2005 introducedsys.dm_os_latch_statswhich helps a DBA determine which latches are causing problems. Does this paper point the reader to the right DMV? Nope. It just says “Possibly the most common case is contention on internal caches (not the buffer pool pages), especially when using heaps or text.”LATCH_x+PAGELATCH_UPmeans you should partition the table, BTW.- If you see
LCK_xyou should check for memory pressure. Unfortunately, we’re left to our own devices to figure out how. If you’ve been taking this article at its word, you’re probably running for the First Church of Page Life Expectancy to find everything else. OLEDBis explained to largely be caused by traces and linked servers. The mitigation, set up more traces, figure out where your client apps sit and whether or not they’re loading files, or querysys.dm_exec_requeststo find out which SPIDs are seeing this wait. Nowhere does it mention stopping your traces and not using linked servers.WRITELOGwaits suggest looking insys.dm_io_virtual_file_stats(good) and query plan output (bad). Raise your hand if you’ve ever successfully used a query plan to spot I/O problems.
Surely the queues section must be better… He said, hopefully.
- Queue lengths are regarded as important. Disk queue length is especially spurious given modern storage technology. Formerly alarming numbers are now considered anemic – it’s not uncommon to see recommended queue depths as high as 128 or 256.
- “Under typical circumstances reads should take 4-8ms” – they going on to remind you to check with your vendor. Which is good because 4-8ms of storage latency is either some kind of local solid state storage or else the time it takes your HBA to acknowledge a write.
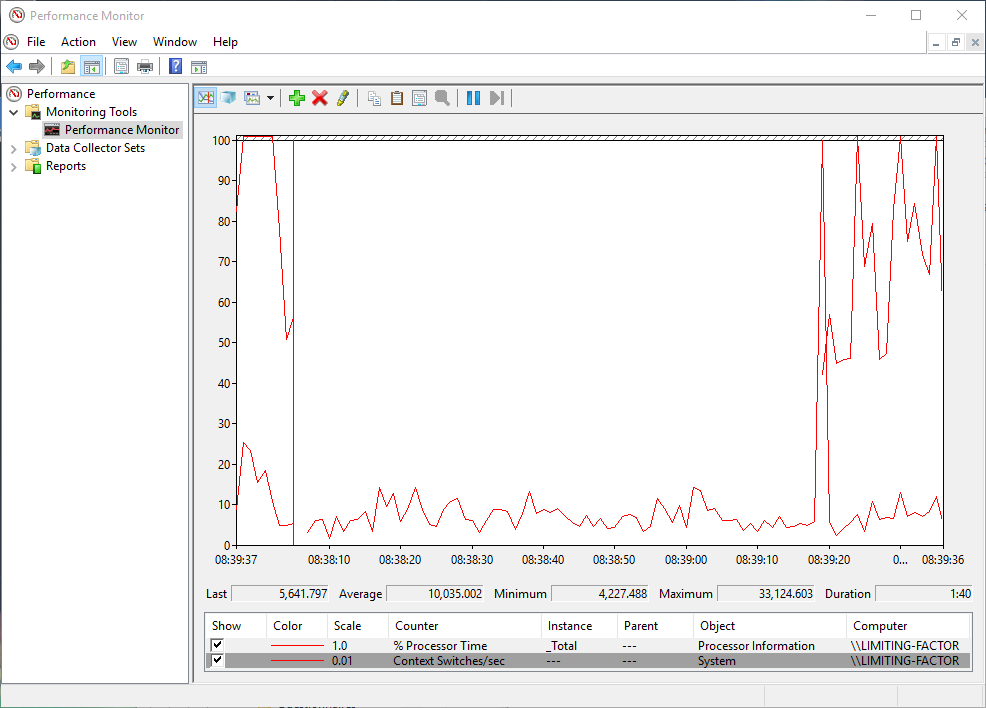
Page Faults/sec– this metric is trash. It measure when your CPU can’t find a page in memory OR when the page isn’t in the cache the CPU thought it should’ve been in. This is normal. Also – you can’t control it. Even with all of your data in memory, your server will still show page faults occurring.Pages/sec– this measures reading data to and from memory. Once again, this is junk. Microsoft PFE Clint Huffman debunked Pages/sec as a meaningful counter back in 2009.Page Splits/secis a counter to watch, right? Well, any addition of page to the end of an index is technically a page split. So is splitting a page. So we don’t know if these are good or bad, but they’re happening!Context Switches/secis mentioned as something to watch, too. According to the paper, if this goes over 20,000 there’s a problem and if it goes over 50,000 there’s a big CPU problem. One time I opened a program and it produced 33,000 context switches per second. Time to throw this laptop away.
At this point, I literally can’t even.
Conclusion
If you’re reading “SQL Server 2005 Waits and Queues” for the first time, read pages 1-7 and then skip to the conclusion. Ignore everything in between.
It’s important to consider this article in a historical perspective – it’s the first serious attempt at documenting a tuning process for SQL Server that combines perfmon counters and wait stats. In today’s context, the concrete advice from the article doesn’t hold up; but the concepts and broad methodology are still useful for identifying SQL Server problems.
If you are looking for guidance on tuning SQL Server using wait stats, more accurate information can be found in SQL Server Books Online and third party sites (like this blog).
Free, 3× a week
Get my new posts by email
Three posts a week, plus a Monday roundup of the best database news from around the web.
“clap,clap,clap”
Nice article guys, once again showing why your newsletter is the best in the business.
Thanks, Dustin. Glad you enjoyed it.
I actually just discovered and finished reading the “SQL Server 2005 Waits and Queues” white paper in the past couple of weeks. Incidentally, I had skipped almost the entire middle part, figuring I’d use it more as a reference. Now I feel slightly less guilty 🙂 Your article is a great sanity check…def going to keep it handy. Thanks a lot!
Thanks for dissing pages/sec. I hate it when people overfocus on this counter because of magic number thresholds pulled from PAL or Microsoft’s site. Several times I’ve seen sysadmins or DBAs notice a certain value of pages/sec and then stop thinking, as if that was enough to reach a conclusion. When I hear “pages/sec > $magic_number, omg” I just hear “it looks like the server is doing work.”
“Under typical circumstances reads should take 4-8ms”
Definitely not 3 or 9. Those aren’t powers of 2.
The thing I find missing from articles on analysing wait stats is the time spent using CPU. You can find where your biggest waits are and thanks to Paul Randall you can see a pie chart of what the typical wait proportions are, but 20 years ago in DB2 (mainframe) I expected to be able to say CPU burned + Waits = Elapsed Time. I knew at that time that around 30% of my elapsed time was typically waits. There were mitigating factors moving the figure either way such as massive memory or fast I/O systems but you could work them out for yourself.
Would it be true to say that on a 4 core processor if you add up the wait time per second and divide by 4 that would give you a better idea if a problem exists or not?
Yup! The same principles still apply. Of course, you have to be looking at the right subset of waits. SQL Server has many ignorable waits, but it doesn’t list them as being
IDLElike, say, Oracle. There’s a waits script in our that ignores many worthless waits.