Why Multiple Plans for One Query Are Bad
65 Comments
I’m going to demo this using the Stack Overflow public database. We’ll use the Users table – which has exactly what you think it has, everyone who’s asked/answered/commented at StackOverflow.com.
I need to search for people by their DisplayName, so I’ve created an index on that:
|
1 |
CREATE INDEX IX_DisplayName ON dbo.Users(DisplayName); |
And now I’m going to search for a couple of different people – me, and the lady in the meat dress – and then examine what’s in my plan cache:
|
1 2 3 4 5 6 7 |
DBCC FREEPROCCACHE; GO SELECT * FROM StackOverflow.dbo.Users WHERE DisplayName = 'Brent Ozar'; GO SELECT * FROM StackOverflow.dbo.Users WHERE DisplayName = 'Lady Gaga'; GO sp_BlitzCache; |
Here’s the results:

Hey, whaddya know, Lady Gaga uses Stack Overflow too! We’re practically meant for each other.
But let’s zoom in a little on that last result set, the output of sp_BlitzCache:

SQL Server built and cached two query plans.
This has a few interesting problems:
- It built an execution plan for each one of them – which meant the query took a little longer to finish
- It cached each execution plan separately – meaning it takes up more memory
- Each plan could be different – in cases where the different name has a different number of estimated rows, SQL Server might choose to use (or avoid) an index
With just 2 queries, who cares? But if your app is sending in the same query thousands of times, each with different parameters, this can add up to more CPU time, more memory used for caching plans, and less memory used for caching data.
Our tools warn you about this in a few different ways:
- sp_Blitz warns you that you have a large number of plans for a single query, and that it’s time to dig deeper by looking at the plan cache
- sp_BlitzCache shows a warning for queries that have multiple plans (indicating that the query you’re looking at might just be a bad one out of several). You can do EXEC sp_BlitzCache @SortOrder = ‘query hash’ to find the queries to focus on, too.
- SQL ConstantCare® suggests forced parameterization when we see that you have a ton of these over time, and can’t keep plans in the cache as a result
You could fix this by changing the application so that it uses parameterized SQL instead of strings. Run this query to tell your developers which queries are involved:
|
1 2 3 4 5 6 7 8 9 10 11 12 13 14 15 16 17 18 19 20 21 22 23 24 25 26 27 28 29 30 31 32 33 34 35 36 37 38 39 40 41 42 |
WITH RedundantQueries AS (SELECT TOP 10 query_hash, statement_start_offset, statement_end_offset, /* PICK YOUR SORT ORDER HERE BELOW: */ COUNT(query_hash) AS sort_order, --queries with the most plans in cache /* Your options are: COUNT(query_hash) AS sort_order, --queries with the most plans in cache SUM(total_logical_reads) AS sort_order, --queries reading data SUM(total_worker_time) AS sort_order, --queries burning up CPU SUM(total_elapsed_time) AS sort_order, --queries taking forever to run */ COUNT(query_hash) AS PlansCached, COUNT(DISTINCT(query_plan_hash)) AS DistinctPlansCached, MIN(creation_time) AS FirstPlanCreationTime, MAX(creation_time) AS LastPlanCreationTime, MAX(s.last_execution_time) AS LastExecutionTime, SUM(total_worker_time) AS Total_CPU_ms, SUM(total_elapsed_time) AS Total_Duration_ms, SUM(total_logical_reads) AS Total_Reads, SUM(total_logical_writes) AS Total_Writes, SUM(execution_count) AS Total_Executions, --SUM(total_spills) AS Total_Spills, N'EXEC sp_BlitzCache @OnlyQueryHashes=''0x' + CONVERT(NVARCHAR(50), query_hash, 2) + '''' AS MoreInfo FROM sys.dm_exec_query_stats s GROUP BY query_hash, statement_start_offset, statement_end_offset ORDER BY 4 DESC) SELECT r.query_hash, r.PlansCached, r.DistinctPlansCached, q.SampleQueryText, q.SampleQueryPlan, r.Total_Executions, r.Total_CPU_ms, r.Total_Duration_ms, r.Total_Reads, r.Total_Writes, --r.Total_Spills, r.FirstPlanCreationTime, r.LastPlanCreationTime, r.LastExecutionTime, r.statement_start_offset, r.statement_end_offset, r.sort_order, r.MoreInfo FROM RedundantQueries r CROSS APPLY (SELECT TOP 10 st.text AS SampleQueryText, qp.query_plan AS SampleQueryPlan, qs.total_elapsed_time FROM sys.dm_exec_query_stats qs CROSS APPLY sys.dm_exec_sql_text(qs.sql_handle) AS st CROSS APPLY sys.dm_exec_query_plan(qs.plan_handle) AS qp WHERE r.query_hash = qs.query_hash AND r.statement_start_offset = qs.statement_start_offset AND r.statement_end_offset = qs.statement_end_offset ORDER BY qs.total_elapsed_time DESC) q ORDER BY r.sort_order DESC, r.query_hash, r.statement_start_offset, r.statement_end_offset, q.total_elapsed_time DESC; |
That gives you the top 10 most duplicated queries in cache, plus for each one, 10 sample texts, plans, and a more-info query for sp_BlitzCache to let you slice & dice them by reads, CPU, etc. Note that the “Total” numbers like Total_Reads and Total_CPU_ms are for ALL of the different executions of the query text, not just the one line you’re looking at.
I’m filtering for only queries that have at least 100 duplicate entries in the plan cache.

And then when they say, “Sorry, we can’t fix those,” keep reading.
Optimize for Ad Hoc does not fix this.
When turned on, this server-level setting tells SQL Server to expect a lot of different queries that will never be seen again. That means:
- SQL Server still compiles every string, every time it sees it
- Just now it doesn’t cache that query’s plan until it sees the query a second time (which it almost never will, because you’re sending in a different string every time)
So your CPU is still high – you’ve just saved some memory, but not a lot. This isn’t a full fix.
Forced Parameterization fixes this.
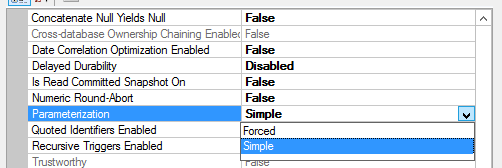
If you right-click on a database, click Properties, Options, and scroll to the Miscellaneous section, you’ll see Parameterization. The default is Simple, but you can also choose Forced.
Setting it to Forced takes effect instantly, doesn’t require a restart, and then has a different behavior.
If I run the same queries again, here’s the new output:

SQL Server takes a little more time with each incoming query, turns the literals into variables, and then checks to see if there’s an execution plan already compiled for it. That means:
- Faster query runtime because we can skip compiling a full plan for it
- Less memory wasted on duplicate plans being cached in memory
- Easier to spot performance issues because now the same query is grouped together easier in tools like sp_BlitzCache
Things to know about Forced Parameterization:
- It’s set at the database level, and needs to be set in the database where users are running queries.
- It could theoretically be a performance drag – if all of your queries had literals, but they really were totally different queries, this could slow things down. I only recommend using this tool to fix a problem, not to proactively prevent a problem.
- When enabled, plans do get reused – which means you may suddenly have parameter sniffing issues that you didn’t have before (because before, every query got its own hand-crafted plan.)
So when should you use Forced Parameterization?
- When our tools are alerting you about a high number of plans for a single query (like, say, 10,000 or more)
- You can’t fix that query to be parameterized
- You want to reduce CPU usage and increase memory available to cache data
- You’re comfortable troubleshooting parameter sniffing issues that may arise with that query
For more on the topic, check out Eitan Blumin’s post Too Many Plans for the Same Query Hash.