
Why Multiple Plans for One Query Are Bad
I’m going to demo this using the Stack Overflow public database. We’ll use the Users table – which has exactly what you think it has, everyone who’s asked/answered/commented at StackOverflow.com.
I need to search for people by their DisplayName, so I’ve created an index on that:
|
1 |
CREATE INDEX IX_DisplayName ON dbo.Users(DisplayName); |
And now I’m going to search for a couple of different people – me, and the lady in the meat dress – and then examine what’s in my plan cache:
|
1 2 3 4 5 6 7 |
DBCC FREEPROCCACHE; GO SELECT * FROM StackOverflow.dbo.Users WHERE DisplayName = 'Brent Ozar'; GO SELECT * FROM StackOverflow.dbo.Users WHERE DisplayName = 'Lady Gaga'; GO sp_BlitzCache; |
Here’s the results:

Hey, whaddya know, Lady Gaga uses Stack Overflow too! We’re practically meant for each other.
But let’s zoom in a little on that last result set, the output of sp_BlitzCache:

SQL Server built and cached two query plans.
This has a few interesting problems:
- It built an execution plan for each one of them – which meant the query took a little longer to finish
- It cached each execution plan separately – meaning it takes up more memory
- Each plan could be different – in cases where the different name has a different number of estimated rows, SQL Server might choose to use (or avoid) an index
With just 2 queries, who cares? But if your app is sending in the same query thousands of times, each with different parameters, this can add up to more CPU time, more memory used for caching plans, and less memory used for caching data.
Our tools warn you about this in a few different ways:
- sp_Blitz warns you that you have a large number of plans for a single query, and that it’s time to dig deeper by looking at the plan cache
- sp_BlitzCache shows a warning for queries that have multiple plans (indicating that the query you’re looking at might just be a bad one out of several). You can do EXEC sp_BlitzCache @SortOrder = ‘query hash’ to find the queries to focus on, too.
- SQL ConstantCare® suggests forced parameterization when we see that you have a ton of these over time, and can’t keep plans in the cache as a result
You could fix this by changing the application so that it uses parameterized SQL instead of strings. Run this query to tell your developers which queries are involved:
|
1 2 3 4 5 6 7 8 9 10 11 12 13 14 15 16 17 18 19 20 21 22 23 24 25 26 27 28 29 30 31 32 33 34 35 36 37 38 39 40 41 42 |
WITH RedundantQueries AS (SELECT TOP 10 query_hash, statement_start_offset, statement_end_offset, /* PICK YOUR SORT ORDER HERE BELOW: */ COUNT(query_hash) AS sort_order, --queries with the most plans in cache /* Your options are: COUNT(query_hash) AS sort_order, --queries with the most plans in cache SUM(total_logical_reads) AS sort_order, --queries reading data SUM(total_worker_time) AS sort_order, --queries burning up CPU SUM(total_elapsed_time) AS sort_order, --queries taking forever to run */ COUNT(query_hash) AS PlansCached, COUNT(DISTINCT(query_plan_hash)) AS DistinctPlansCached, MIN(creation_time) AS FirstPlanCreationTime, MAX(creation_time) AS LastPlanCreationTime, MAX(s.last_execution_time) AS LastExecutionTime, SUM(total_worker_time) AS Total_CPU_ms, SUM(total_elapsed_time) AS Total_Duration_ms, SUM(total_logical_reads) AS Total_Reads, SUM(total_logical_writes) AS Total_Writes, SUM(execution_count) AS Total_Executions, --SUM(total_spills) AS Total_Spills, N'EXEC sp_BlitzCache @OnlyQueryHashes=''0x' + CONVERT(NVARCHAR(50), query_hash, 2) + '''' AS MoreInfo FROM sys.dm_exec_query_stats s GROUP BY query_hash, statement_start_offset, statement_end_offset ORDER BY 4 DESC) SELECT r.query_hash, r.PlansCached, r.DistinctPlansCached, q.SampleQueryText, q.SampleQueryPlan, r.Total_Executions, r.Total_CPU_ms, r.Total_Duration_ms, r.Total_Reads, r.Total_Writes, --r.Total_Spills, r.FirstPlanCreationTime, r.LastPlanCreationTime, r.LastExecutionTime, r.statement_start_offset, r.statement_end_offset, r.sort_order, r.MoreInfo FROM RedundantQueries r CROSS APPLY (SELECT TOP 10 st.text AS SampleQueryText, qp.query_plan AS SampleQueryPlan, qs.total_elapsed_time FROM sys.dm_exec_query_stats qs CROSS APPLY sys.dm_exec_sql_text(qs.sql_handle) AS st CROSS APPLY sys.dm_exec_query_plan(qs.plan_handle) AS qp WHERE r.query_hash = qs.query_hash AND r.statement_start_offset = qs.statement_start_offset AND r.statement_end_offset = qs.statement_end_offset ORDER BY qs.total_elapsed_time DESC) q ORDER BY r.sort_order DESC, r.query_hash, r.statement_start_offset, r.statement_end_offset, q.total_elapsed_time DESC; |
That gives you the top 10 most duplicated queries in cache, plus for each one, 10 sample texts, plans, and a more-info query for sp_BlitzCache to let you slice & dice them by reads, CPU, etc. Note that the “Total” numbers like Total_Reads and Total_CPU_ms are for ALL of the different executions of the query text, not just the one line you’re looking at.
I’m filtering for only queries that have at least 100 duplicate entries in the plan cache.

And then when they say, “Sorry, we can’t fix those,” keep reading.
Optimize for Ad Hoc does not fix this.
When turned on, this server-level setting tells SQL Server to expect a lot of different queries that will never be seen again. That means:
- SQL Server still compiles every string, every time it sees it
- Just now it doesn’t cache that query’s plan until it sees the query a second time (which it almost never will, because you’re sending in a different string every time)
So your CPU is still high – you’ve just saved some memory, but not a lot. This isn’t a full fix.
Forced Parameterization fixes this.
If you right-click on a database, click Properties, Options, and scroll to the Miscellaneous section, you’ll see Parameterization. The default is Simple, but you can also choose Forced.
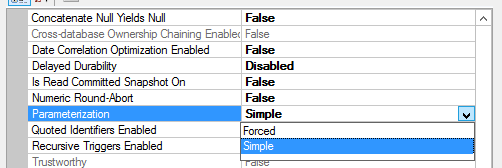
Setting it to Forced takes effect instantly, doesn’t require a restart, and then has a different behavior.
If I run the same queries again, here’s the new output:

SQL Server takes a little more time with each incoming query, turns the literals into variables, and then checks to see if there’s an execution plan already compiled for it. That means:
- Faster query runtime because we can skip compiling a full plan for it
- Less memory wasted on duplicate plans being cached in memory
- Easier to spot performance issues because now the same query is grouped together easier in tools like sp_BlitzCache
Things to know about Forced Parameterization:
- It’s set at the database level, and needs to be set in the database where users are running queries.
- It could theoretically be a performance drag – if all of your queries had literals, but they really were totally different queries, this could slow things down. I only recommend using this tool to fix a problem, not to proactively prevent a problem.
- When enabled, plans do get reused – which means you may suddenly have parameter sniffing issues that you didn’t have before (because before, every query got its own hand-crafted plan.)
So when should you use Forced Parameterization?
- When our tools are alerting you about a high number of plans for a single query (like, say, 10,000 or more)
- You can’t fix that query to be parameterized
- You want to reduce CPU usage and increase memory available to cache data
- You’re comfortable troubleshooting parameter sniffing issues that may arise with that query
For more on the topic, check out Eitan Blumin’s post Too Many Plans for the Same Query Hash.

65 Comments. Leave new
32k queries for a 3rd party app that’s been running for a month. Their developers will most certainly say, “Sorry, we can’t fix those,”
PeopleSoft was pretty bad for this.
And then there is the odd query that once in a while runs forever unexpectedly. Argh!
If you’re using the Query Store in 2016+, do the two queries show as separate with individual query plans, or does the Query Store parameterize the queries much like the “Parameterization=Forced” database setting?
Query Store stores query information in the same fashion as the pre-2016 DMVs did — if the query is getting multiple plans (due to non-parameterization as in this post’s examples, or because of an OPTION(RECOMPILE) hint, or due to the plan cache getting dumped), then Query Store will show the different plans that were compiled for the query.
I really like the sound of this but am concerned about the impact on other queries. Is there a way to used Forced parameterization for specific queries?
Hi Pete, as soon as you use a SqlParameter object in your Code in. Net, .Net will automatically turn your query into a parametrized query too and you will have the same effects, maybe this is an Option for you.
Sadly I can’t touch the code. It’s Vendor supplied software which was badly ported from an IBM universe system to SQL Server. It’s riddled with dynamic SQL and scalar UDF’s wrapped in CLR’s. (more than 36,000 of them). I have thousands of query plans for trivial dynamic queries. I’m trying to find clever ways to help SQL cope better with it all.
Take a look at sp_create_plan_guide for a “template” plan guide. So long as the query is fully non parameterized (i.e. some values hardcode some parameterized) this should do the trick.
Ha, you got more downvotes than Lady Gaga!
Awesome post! I love this. A post I wish I wrote myself.
This is something that I probably should have known about a long long time ago.
This helped me very quickly identify a bunch of sneaky queries that were hiding in our code. Sneaky code that concatenates integer values into a sql string rather than using real parameters. Our worst offender had 15K plans for a single query_hash in cache.
I adapted your query to show me a single instance of each query because thousands of rows per query_hash was a bit unwieldy for me. You can find that here:
https://gist.github.com/mjswart/109a641f35adb7ffcbe46a5f8d4bc259
My plan cache thanks you.
I manage the database for an application that is based on Entity Framework, so my assumption was that all queries would be picked up as parameterised. However, it seems that almost two thirds of the cache (30k) are ad-hoc single use plans for what look to be the same query. I’m noticing that I see multiple versions of the same query in tools like Redgate SQL Monitor too.
I’m considering enabling forced parametrization in the hope that plan reuse will kick in. Does this sound feasible?
Jon – that’s what the post is about, yes.
Thanks Brent – Following reading the post I was pretty much convinced my issues were one and the same.
Is it possible that using a local variable to supply the value to a predicate could result in multiple plans for a single statement? I’ve got a pair of DELETE’s that have 28K rows from the query listed here; however, most of them have NULL as the QueryPlan. The statements are issued in a stored procedure; I wouldn’t think parameterization would be an issue, but I’ve been wrong before…
Roland – why not give it a shot and find out? Sounds like it’d be easy to build a quick repro test in your development environment.
Everybody has a test environment; in a few places it’s separate from production.
“397 plans are present for a single query in the plan cache – meaning we probably have parameterization issues.”
when i am doing forced parameterization ,it is not effecting any change in plans but also creating performance issues in database ( as after this sp_blitz) showing performance issue of forced parameterization ,may i know the solution as because of this i am getting my procedure cache hit ratio also bad
The query in this post returns absurd results. Such as including CREATE PROC statements that I know for certain only execute once when generating the DB. But your query shows 24 executions for each of them. Do you need help with SQL?
Thanks for your constructive criticism. Yes, I do need help with SQL! By all means, I’d love to see your updated version. Thanks in advance for your help!
*Not sure if serious…* I can’t tell if this should be read at face value and given the benefit of the doubt. Or if it’s really sarcastic and arsey. Should I read it using Stimpy’s voice in my head or Ren’s?
Hint – If executing a stored procedure is creating many cached plan versions, what is the SQL used for the query? Have you looked at sys.sql_modules lately?
Seems like forced parameterization could cause issues with filtered indexes.
Yep, has all kinds of interesting effects.
[…] Brent Ozar has a good overview of why this happens, but the short answer is to force parameterization on your queries. When you enable force parameterization, SQL Server will not automatically parameterize your queries if they aren’t already, reducing the number of one off query plans in your cache. […]
Our most frequent INSERT queries show about 6000 plans cached. These are queries that goest INSERT INTO Table (Col1, col2, col3) values (@Col1, @Col2, @Col3) and parameters are passed in the C# SqlCommand. Is is possible to optimize those? How would you optimize INSERT queries? I understand about SELECT but I don’t get it for INSERTs. Thanks
Danielle – anytime you’ve got a development question, start by searching StackOverflow.com. You’d be stunned at how many of ’em have been answered over there, it’s bananas:
https://stackoverflow.com/questions/19956533/sql-insert-query-using-c-sharp
Thanks, we are already inserting the parameters as said in the answers in the link you provided. But still, is it normal to have about 6000 plans for that kind of query? Is there something more to do to reduce the amount of query plans for INSERT statements? I have already enabled the “Optimize for AdHoc” since we had problems with that too.
Danielle – I really do wish I could do unlimited free personal consulting in the Q&A, but that’s why I guided you to StackOverflow.com.
ok thanks, I’ll keep searching then 😉
If it’s just a few then if it can use an index then so much the better.
For a lot then the impact of indexes being updated needs to be looked at and if you an bulk insert or at least order your inserts that can also help.
Or the dba answer is …. it depends! Good luck!
The standby DBA answer is “it depends”. Always. People wonder why I can’t explain this stuff in a sentence or two.
Were you able to fix this? Most of my duplicate plans are INSERTs.
I have the forced parameterization parameter enabled on my hospital database but still, I found 4-5 plans for a single procedure on my SolarWinds dashboard. The stats are updated overnight and Index maintenance over the weekends. Any suggestions to drill down and make the optimizer pick the best plan.
Adil – sure, that’s the kind of work I do in my consulting. You can click Consulting at the top of the site to get started. Thanks!
The title of this article is “Why Multiple Plans for One Query Are Bad” but I’m not sure that it explains why multiple query plans for one query are bad. Different parameters may require wildly different execution plans, and simply reusing the same execution plan every time can cause disastrous performance. One of your arguments is that they use memory, but it’s just a cache right? It will evict cache items from memory to make room as necessary.
Another problem you list is that “in cases where the different name has a different number of estimated rows, SQL Server might choose to use (or avoid) an index”. Well yes, but isn’t that a good thing? I mean making those kinds of decisions is the whole point of a query optimizer.
Not saying you’re necessarily wrong, but this text doesn’t have enough substance to convince me.
OK, cool! Thanks for taking the time to leave your thoughts.
Really? If one query has has 10,000 plans cached, how many queries then don’t have a plan cached and therefore have to be completely redone every time they are executed? Can you see the problem there?
Would enabling optimize for ad-hoc queries while boosting CPU cores be ‘more’ of a fix if I cant enable forced parameterization due to application constraints?
JHutch – troubleshooting that one in a blog post comment is kinda tough. That’s where consulting comes in.
Boosting CPU cores might be a solution but remember you now have to pay licensing for those cores. If there weren’t other things pointing to CPU utilizations problem, I wouldn’t go this route.
I have a problem that looks like the problem you sketch, but probably won’t be solved by setting Parameterization to forced. My topmost resource consuming query has two plan id’s, one good performing plan id and one bad performing plan id. The xml of both plans is exactly the same. Forcing the good plan id doesn’t help. This is what we expect, since basically we only have one plan. The statistics are up to date. Basically, on the morning the query performs badly, in the afternoon, performance is good. My guess, different workloads cause different performance. I will try to rewrite the query, but have you any idea why I get two plan id’s? I spend a lot of time finding the difference between the ‘good’ and the ‘bad’ plan, but there was no difference.
Chris – for general Q&A, you can either hire me (click Consulting up at the top) or post your question at a free Q&A site like https://dba.stackexchange.com. Thanks!
Thank you. For your information, rewriting the query did help. The problem was different workloads and also different distribution over the indexed values.
If you don’t want to enable forced parameterization on the whole database, but only for a handful of your most problematic queries you can create a template plan guide.
Hi Brent,
The “top 10 most duplicated queries in cache” query spacing seems to be scrambled… if you are not logged in.
Sorry about that! Fixed.
Hi Brent,
The other thing for the “top 10 most duplicated queries in cache” query is for
SUM(total_worker_time) AS Total_CPU_ms,
SUM(total_elapsed_time) AS Total_Duration_ms,
They are actually in microseconds instead of milliseconds
According to https://docs.microsoft.com/en-us/sql/relational-databases/system-dynamic-management-views/sys-dm-exec-query-stats-transact-sql?view=sql-server-ver15
Thanks.
I have seen a common anti-pattern in C# code regarding using the deprecated .AddWithValue method to declare string parameters for SQL that causes the parameter to be declared as the size of the value for each execution. For example:
(@ID int,@String1 nvarchar(73),@String2 nvarchar(27),@String2 nvarchar(41))
If the value for each string variable could theoretically vary between 1 and 100 in length, then you are looking at one million possible permutations of length values for those declarations. That’s a lot of different plans for one “fully parameterized” query.
Even though the query text (the “SELECT” and beyond) itself remains identical for every execution, the differences in the parameter declaration causes SQL to see each of these variations as an entirely new statement, causing all the same problems as if parameters hadn’t been used at all. Instead, use .Add to declare the variable as the size of the column it represents or with which it will be compared. My favorite blog post about this is: https://www.dbdelta.com/addwithvalue-is-evil/
Forced Parameterization won’t fix this, it has to be fixed in the C# code. If it is a third-party application, you should file a support ticket to hopefully get it fixed in a future release. It is appalling how many software vendors have never had a DBA on staff, even though they have databases with hundreds of tables as part of the application.
You are absolutely right! At my job the applications where all like that! It took me months of talking to the developers and teaching them why it’s a bad thing before they actually changed the code. Now they define correctly parameters in C#, so I don’t get multiple plans anymore (or less of it because they didn’t change all of the code, just part of it.)
Brent, you are great. I’ve learned a lot from you and this article is another great value added to my knowledge.
My question is, should I consider running the DBCC FREEPROCCACHE and remove the plan from cache before forcing Parameterization ?
Thanks, glad the article helped! I don’t think freeing the plan cache is a good long term solution, no.
For the redundant query, the DistinctPlanCached column is currently based on ‘query_hash’ column via ‘COUNT(DISTINCT(query_hash)) AS DistinctPlansCached’. Should this column be instead be based on ‘query_plan_hash’ as COUNT(DISTINCT(query_plan_hash)) AS DistinctPlansCached? Currently, the underlying query is grouping on
query_hashand the logic in this query to me is not clear on its intent. Thank you in advance for any clarification.You’re absolutely right, good catch! And here’s a demo query if you want to test it:
USE StackOverflow;
GO
DropIndexes;
GO
CREATE INDEX Reputation ON dbo.Users(Reputation);
GO
DBCC FREEPROCCACHE;
GO
SELECT TOP 10000 * FROM dbo.Users WHERE Reputation = 3 ORDER BY DisplayName;
GO
SELECT TOP 10000 * FROM dbo.Users WHERE Reputation = 2 ORDER BY DisplayName;
GO
SELECT TOP 10000 * FROM dbo.Users WHERE Reputation = 1 ORDER BY DisplayName;
GO
Reputations 1 and 3 should get the same plan, and 2 should get a different one. That’ll show 3 plans cached, 2 distinct plans cached.
Hi Brent,
Can we use query store to force the most effective plan for a re-use instead of using forced parametarization
How, when every query is different?
oh, the topic got me. (multiple plan, one query — i was thinking same query id), i should have dug down properly.
Thanks for the post
Parameter sniffing is well known problem that is often solved by finding one query that works OK for all data.
I would like to take a different approach and let SQL keep different plans for different parameters.
In your example above, I want to make an SP with
if @rep = 3
SELECT TOP 10000 * FROM dbo.Users WHERE Reputation = @rep ORDER BY DisplayName;
if @rep = 2
SELECT TOP 10000 * FROM dbo.Users WHERE Reputation = @rep ORDER BY DisplayName;
if @rep = 1
SELECT TOP 10000 * FROM dbo.Users WHERE Reputation = @rep ORDER BY DisplayName;
I want multiple plans for one query to fix parameter sniffing.
But SQL is going to use one plan for all three cases here.
I am wondering if adding some no affect hint like with(maxrecursion = 99), 100, 101
would force sql to make multiple plans.
I will let you know after I try it.
You can learn why that doesn’t work, and what you should do instead, in my Mastering Parameter Sniffing class. See you there!
I have to agree with some of the comments in here. The title of this article is simply click bait. Same as a few other inflammatory ones Brent has posted over the years 🙂 OF COURSE we should have multiple plans per query, depending on the parameters and what story the stat histograms are telling, ESPECIALLY when you’re dealing with very high cardinality variation. You might be thinking that good old Brent was simply presenting the parameterization option. He did, and did a good job, but that’s not why he picked that title 🙂
I have a 3rd party ERP (big software) that runs everything via cursors. Using the top 10 query above, my first result is FETCH API_CURSOR… and the other nine all end with WHERE CURRENT OF [different cursor names]. I’m trying to think how forced parameterization would affect this. On one hand, FETCH API_CURSOR… could have wildly different SQL SELECT statements behind it. On the other hand, the WHERE CURRENT OF all have similar plans but different cursor names. I should also mention the WHERE CURRENT OF statements ARE ALREADY parameterized (something like this: @P1 nchar(10),@P2 float)UPDATE dbname.schemaname.tablename SET UKOBNM=@P1,UKUKID=@P2 WHERE CURRENT OF C9B25928).
My current hardware is WAY overpowered so I don’t have a problem I’m trying to address. However, I’m wondering if there is any opportunity for improvement with this setting.
Anyone have experience playing with this setting with Cursor workloads?
[…] source: Brent Ozar […]
Despite enabling forced parameterization, parameterization issues are still occurring.
How can this be resolved?
Hi! That’s beyond the scope of this blog post, but you can click Consulting at the top of the page for personalized help.
[…] Parameterization v2: The original implementation of this feature helped mitigate the multiple-plans-for-one-query issue, but it has a ton of gotchas, like not fully parameterizing any partially parameterized queries, […]
[…] Store are damn near useless because every query that comes in is seen as a “new” query. I wrote about this back in 2018, and since then, the problem seems like it’s gotten continuously worse. I’ve been […]