SQL Server 2017 CU5: Finding Problems With Parallelism
Snow Is Temporary
Cumulative Update 5 dropped for SQL Server 2017. Hooray.
Nooooooooo, I just patched!
— Taryn (@onlybluefeet) March 20, 2018
These new servicing models sure do make me glad I don’t have a real job.
I’m also happy because I get to write weird queries to test interesting new functionality.
This SQL Server update improves troubleshooting parallelism-related (exchange) deadlocks by adding the following enhancements:
-
The exchange_spill xEvent reports how much data parallelism operators spill per each thread, in the event field name worktable_physical_writes. Each thread may report an exchange_spill xEvent multiple times.
-
The DMVs sys.dm_exec_query_stats, sys.dm_exec_procedure_stats and sys.dm_exec_trigger_stats now include the data that is spilled by parallelism operators, in the columns total_spills, last_spills, max_spills, and min_spills.
-
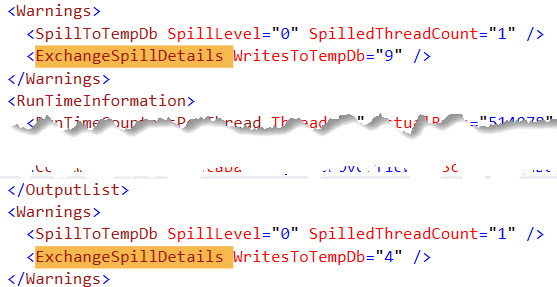
A showplan warning is reported at run time if there are parallelism spills. This warning is rendered in a showplan xml attribute (<ExchangeSpillDetails WritesToTempDb=”spill_amount” />).
There’s some other cool stuff in there too, but I’m only talking about exchange spills here.
How Do I Spill In Parallel?
The easiest way to encourage spills in a parallel plan is to force lots of order preserving operators — stuff like Merge Joins and Stream Aggregates — to occur around Exchange operators.
Exchange operators can Distribute, Redistribute, and Gather parallel streams of data. When they’re not required to keep data in order, things are a lot easier.
When they are, you run into problems.

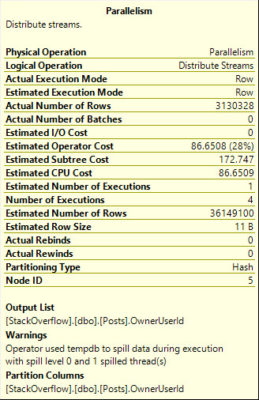
In this case, the Exchange operators on either side of the Merge Join spill.
Exchange Spill Extended Event
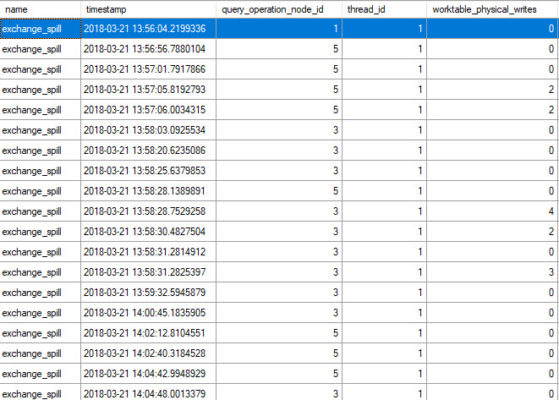
I set up an extended event to watch this query, which runs for a touch over 9 minutes. The results are somewhat interesting.

Over 19 exchange events, only five of them admit to physically writing to a worktable, for a total of 13 writes.
Over 9 minutes.
Lesson learned: it doesn’t take many exchange spills to make a parallel query really slow.
Exchange Spill DMV Data
sp_BlitzCache will grab these columns if you’re on 2017 CU3+. Otherwise… Well, nothing really.
Please upgrade.

The DMVs agree! There were only 13 spills here. Happy Days — this is included in here. I’m not sure that this was always the case…
Query Plan (Actual Only)
Spills aren’t tracked in estimated or cached plans. Unfortunately, SSMS 17.6 doesn’t show the writes to tempdb, however it does exist in the XML.

Perhaps the next version will display this in the tool tips.

But the plan shows us 13 total spills again, so… If it’s wrong, it’s wrong everywhere. That’s a start.
For the record, I don’t think it’s wrong. I’m just surprised that it only takes 13 writes to make a parallel query crap the bed.
Thanks for reading!
An update, and a confession
This was not the optimizer’s first choice for a plan. No, no, my sweet and innocent readers. I had to throw an army of hints at this query to get it to happen.
I had to force it to run parallel with a certain number of cores, I had to force choosing merge joins, and I had to throw a Trace Flag That Shall Not Be Numbered at it.
I also had to choose tables where I knew a NOT EXISTS would be problemaaaaaaaaaatic (NPR voice) because of data distributions.
Like I tell myself when I go to the gym: it takes a lot of work to look this mediocre.
Related

Hi! I’m Brent Ozar.
I make Microsoft SQL Server go faster. I love teaching, travel, cars, and laughing. I’m based out of Las Vegas. He/him. I teach SQL Server training classes, or if you haven’t got time for the pain, I’m available for consulting too.
Get Free SQL Stuff
"*" indicates required fields

2 Comments. Leave new
Did you just use the “ripped paper” screenshot? That’s so 2011.
Yeah, it’s the black and white head shot of blogging.