Blog

Indexing for GROUP BY

Indexing, SQL Server
9 Comments

It’s not glamorous

And on your list of things that aren’t going fast enough, it’s probably pretty low. But you can get some pretty dramatic gains from indexes that cover columns you’re performing aggregations on.

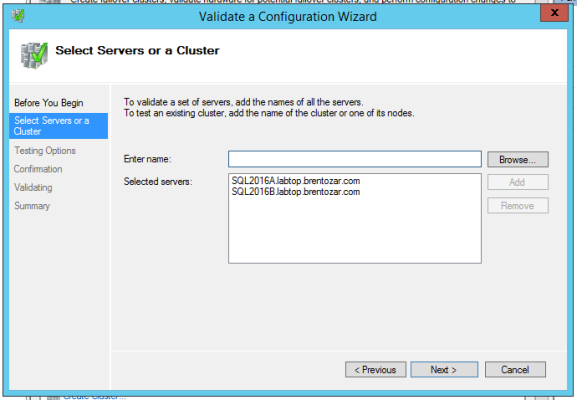
We’ll take a quick walk down demo lane in a moment, using the Stack Overflow database.

Query outta nowhere!

Looking at the plan, it’s pretty easy to see what happened. Since the data is not ordered by an index (the clustered index on this table is on an Id column not referenced here), a Hash Match Aggregate was chosen, and off we went.

Look how much fun we're having.
Look how much fun we’re having.

Zooming in a bit on the Hash Match, this is what it’s doing. It should look pretty familiar to you if you’ve ever seen a Hash Match used to JOIN columns. The only difference here is that the Hash table is built, scanned, and output. When used in a JOIN, a Probe is also built to match the Residual buckets, and then the results are output.

It's basically wiping its hands on its pants.
It’s basically wiping its hands on its pants.

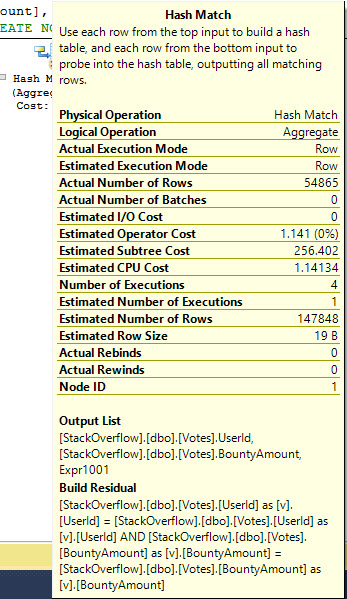
It took quite a bit of activity to do a pretty simple thing.


/*
Table 'Votes'. Scan count 5, logical reads 315406, physical reads 0, read-ahead reads 0, lob logical reads 0, lob physical reads 0, lob read-ahead reads 0.
Table 'Worktable'. Scan count 0, logical reads 0, physical reads 0, read-ahead reads 0, lob logical reads 0, lob physical reads 0, lob read-ahead reads 0.
Table 'Workfile'. Scan count 0, logical reads 0, physical reads 0, read-ahead reads 0, lob logical reads 0, lob physical reads 0, lob read-ahead reads 0.

SQL Server Execution Times:
CPU time = 3609 ms, elapsed time = 1136 ms.
*/

Since this query is simple, our index is simple.

I’m using the BountyAmount column in the first position because we’re also filtering on it in the query. We don’t really care about the SUM of all NULLs.

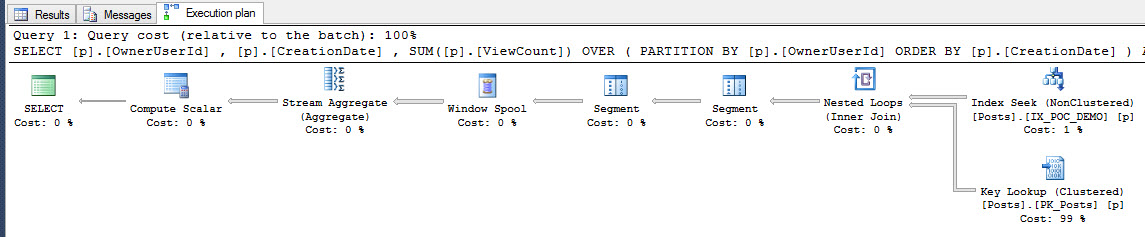
Taking that new index out for a spin, what do we end up with?

Stream Theater
Stream Theater

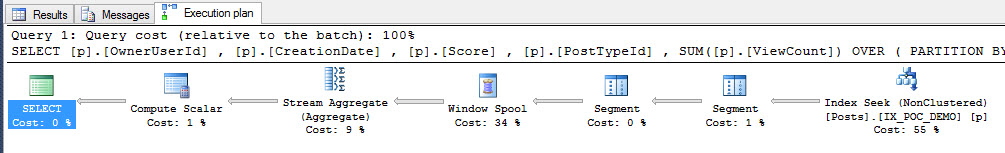
The Hash Match Aggregate has been replaced with a Stream Aggregate, and the Scan of the Clustered Index has been replaced with a Seek of the Non-Clustered Index. This all took significantly less work:


/*
Table 'Votes'. Scan count 1, logical reads 335, physical reads 0, read-ahead reads 0, lob logical reads 0, lob physical reads 0, lob read-ahead reads 0.

SQL Server Execution Times:
CPU time = 0 ms, elapsed time = 278 ms.
*/

Zooming in on the Stream Aggregate operator, because we gave the Hash Match so much attention. Good behavior should be rewarded.

You make it look so easy, Stream Aggregate.

Filters, filters, filters

If we want to take it a step further, we can filter the index to avoid the NULLs all together.

This results in very slightly reduced CPU and IO. The real advantage of filtering the index here is that it takes up nearly 2 GB less space than without the filter. Collect two drinks from your SAN admin.


/*
Table 'Votes'. Scan count 1, logical reads 333, physical reads 0, read-ahead reads 0, lob logical reads 0, lob physical reads 0, lob read-ahead reads 0.

SQL Server Execution Times:
CPU time = 0 ms, elapsed time = 233 ms.
*/

And, because I knew you’d ask, I did try making the same index with the column order reversed. It was not more efficient, because it ended up doing a Scan of the Non-Clustered Index instead, which results in a bit more CPU time.


Should You Put Things in the master Database?

Growing up as a young boy, my elementary teachers always warned me about the perils of putting stuff in master. But what’s the real deal? Why is this such a bad idea?

System databases are often located on space-limited drives. The default installation parameters for SQL Server throw master, model, and msdb all on the C drive. I’d rather not create tables that might grow when I’m not looking, and then possibly run my server’s limited boot drive out of space. Starting Windows with a full C drive is not a lot of fun.

In the event of a disaster, we don’t usually restore master. While you can indeed restore one server’s master database over to another, it’s just not a good idea. You’re failing over to another server because things are already going wrong – why make things worse by doing something you rarely practice? Plus, if you’re failing over due to corruption, you probably don’t want to bring over a possibly corrupt master database.

Even if you could restore it, you’ll lose data. You can’t do transaction log backups for the master database, so you’ll lose whatever changes were made since the last full backup.

Now, having said all this, I’m completely okay with putting utility stored procedures in the master database – things like sp_WhoIsActive, sp_Blitz®, and the like. After all, those objects take hardly any space, and we don’t need to restore them over to our DR environment.

Kendra says: You may have more in your master database than you think! It just takes one ‘oops’ on a deployment script, and there you go.

Want to learn more?

We just launched our new Fundamentals of Database Administration class – an online video course that teaches you a lot of things you should have been taught when you first took this job. (No, none of us learned it the smart way.)


Why Zero Data Loss in SQL Server is Harder Than You Think

But Kendra, it can’t be that hard… after all, we have synchronous modes in Database Mirroring and Availability Groups, right?

Synchronous Commit doesn’t mean “zero data loss”

When we think about limiting data loss, the first thing we think of is a technology that lets us reduce points of failure. If every transaction must be written to two separate storage systems, we have a pretty good chance to have no data loss, right?

Maybe.

Let’s say you’re using a SQL Server Availability Group in SQL Server 2014 with a synchronous replica to do this. The secondary replica fails and is offline, but you don’t lose quorum. If you want 0 data loss, the primary needs to stop accepting writes immediately, right?

It doesn’t do that. The primary replica keeps going and writes can continue. Here’s what that looks like:

Synchronous AG Exposed
Tabloid headline: Synchronous AG Running Exposed! Scandal!

You could write custom scripts to detect the situation and stop the primary replica, but there’s a couple of problems with that. First, you’re offline, and you probably don’t want that. And second, it’s going to take some time to get that done, and that means that you don’t have zero data loss– you could lose anything written in the meanwhile. You could add another synchronous commit replica, but there’s obvious cost and support impacts, and you still aren’t guaranteed zero data loss.

Synchronous writes don’t necessarily guarantee zero data loss, you’ve got to dig into the details.

This stuff isn’t obvious

I’ll be straight up: I’ve been working with high availability and disaster recovery for a long time, and I hadn’t actually thought very critically about this until a recent chat room conversation with Brent discussing why it’s not super easy for cloud hosting providers to offer zero data loss in return for a lot of dollar signs.

Crazy facts: you can learn things from chat rooms and from the cloud. Who knew?

NEED TO PROTECT YOUR DATA? YOU NEED A FULL TIME EMPLOYEE WHO IS RESPONSIBLE FOR THAT.

If data loss is important to you, don’t just assume that you’ve got it under control because you’re paying a vendor to take care of it. If you look closely, you may find that nothing’s working like you think! When your data is important, you need to make someone responsible for ensuring that you’re meeting your RPO and RTO, and have them prove that it works on a scheduled basis. Their job title doesn’t have to be “Database Administrator,” but they need to work for you, and they need to take their responsibility seriously.

Want to Learn More About High Availability and Disaster Recovery?

We just launched our new DBA’s Guide to SQL Server High Availability and Disaster Recovery – a 6-hour online video course that teaches you about clustering, AlwaysOn AGs, quorum, database mirroring, log shipping, and more.


How to Configure Always On AG Backups with Ola Hallengren’s Scripts

With SQL Server AlwaysOn Availability Groups, you can offload backups to a replica rather than running them on the primary. Here’s how to do it:

1. Install Ola Hallengren’s utility scripts on all of the replicas. During the install, it creates a laundry list of SQL Agent jobs, but doesn’t set up schedules for any of them. More on that in a couple of steps.

Backup preference settings

2. Set your backup preferences. In SSMS, right-click on your Availability Group, click Properties, and click the Backup Preferences pane.

The first option, “Prefer Secondary,” means that your backups will be taken on a secondary server unless all secondaries go offline, at which point they’ll be taken on the primary. There’s some risk here: if communication falls behind, your secondary may be running backups of old data, as Anthony Nocentino explains. In that case, you won’t get backup failure alerts, but you won’t be able to meet your RPO. Monitoring for that is an exercise left for the reader.

In the “Replica backup priorities” window, rank your replicas to choose who will do the backups first.

Say I have three servers – two in my primary data center, and one in my disaster recovery site. I’d rather have my full backups running in my primary data center because if I need to do a restore, I want the backups nearby. (You can also run backups in both places – and I would – but more on that in a future post.)

To configure that, I’d set priorities as:

  • SQLPROD1 and SQLPROD2 (my primary data center replicas) – both 50 priority
  • SQLDR1 (my disaster recovery replica) – priority 40

3. Test your backup preferences. Run this query on each replica:

This returns a list of databases in an AG, and whether or not they’re the preferred backup replica right now. Check that on all of your replicas to make sure backups are going to run where you expect, and if not, revisit your backup preferences in the last step.

4. Configure Ola’s Agent full backup jobs. On any replica, in the Agent job list, right-click on the “DatabaseBackup – USER_DATABASES – FULL” job, click Properties, click Steps, and edit the first step. By default, it looks like this:

sqlcmd -E -S $(ESCAPE_SQUOTE(SRVR)) -d master -Q “EXECUTE [dbo].[DatabaseBackup] @Databases = ‘USER_DATABASES’, @Directory = N’C:\Backup’, @BackupType = ‘FULL’, @Verify = ‘Y’, @CleanupTime = NULL, @CheckSum = ‘Y’, @LogToTable = ‘Y'” -b

You need to change these parts:

  • @Directory – set this to your backup path. I like using a UNC path that all of the replicas can access.
  • @Verify – I’d recommend turning this off to make your backup jobs go faster. If you really want to verify your backups, restore them on another server.
  • If you want to run the backups on a secondary replica rather than the primary, add a parameter for @CopyOnly=’Y’
  • If you only want to back up specific databases, modify the @Databases parameter. I don’t like doing that – I’d rather have one job for all of my backups. The way this is set now (USER_DATABASES), this one job will back up all of my databases that aren’t in an AG, plus it’ll back up the AG-contained databases where this replica is the preferred backup right now.

With AlwaysOn AGs, replicas can only run copy-only backups, and people often think that’s a problem. It’s only a problem if you want to use differential backups – otherwise, with AGs, it doesn’t affect transaction log handling at all. I don’t recommend using differentials with AlwaysOn AGs, but if you insist on doing it, you’ll be running your full backups on your primary replica.

Other parameters you may want to set:

  • @CleanupTime – how many hours of backup files you want to keep around
  • @Compress – Ola inherits the default compression setting at the server level, but you can hard code this to Y if you want to make sure backups are always compressed

So here’s what my Agent job script ends up looking like, with my changed parts in bold:

sqlcmd -E -S $(ESCAPE_SQUOTE(SRVR)) -d master -Q “EXECUTE [dbo].[DatabaseBackup] @Databases = ‘USER_DATABASES’, @Directory = N’\\FILESERVER1\SQLBackups’@CopyOnly=’Y’, @CleanupTime=48, @Compress=’Y’, @BackupType = ‘FULL’, @Verify = ‘N’, @CleanupTime = NULL, @CheckSum = ‘Y’, @LogToTable = ‘Y'” -b

5. Copy these changes to all replicas and test the full jobs. Make sure each replica that isn’t supposed to run the fulls, doesn’t, and the replica that IS supposed to run the fulls, DOES. In really mission-critical environments where we’re building the new AG servers from the ground up, we actually fail the AG around to different servers to test behavior when different servers are the primary – and when entire data centers go down.

6. Repeat the setup with your log backup jobs. Right-click on the “DatabaseBackup – USER_DATABASES – LOG” job and click Properties, Steps, and edit the first step. Set the @Directory and @Verify steps as we did earlier.

Here’s where things get a little tricky – you don’t have to add @CopyOnly=’Y’ for the log backup steps. There’s no such thing as a copy-only log backup in an Availability Group secondary, much to my dismay.

You might also consider setting the @ChangeBackupType parameter to Y. By default, if Ola can’t do a transaction log backup (like if it’s a brand new database that has never had a full backup before), then the log backup is skipped. If you set @ChangeBackupType=’Y’, then Ola will do a full backup in that situation, and then do a log backup. However, if it’s a large database, this might take a while to perform the full, and this will tie up your log backup job while it runs. Say the full takes 20 minutes to perform – this might blow your RPO/RTO commitments.

7. Copy these changes to all replicas and test the jobs. Same thing here that we did with the full backups.

8. Configure your DBCC CHECKDB jobs. You need to check for corruption on any server where you’re running backups – here’s why.

9. Design your monitoring. Sadly, SQL Server doesn’t centralize backup history, so it’s up to you to poll all of your replicas to find out where backups are happening for any given Availability Group. In one case, I had a DBA change the backup preferences and Ola’s job settings incorrectly, and all of the backup jobs were succeeding – but none of them were backing up one of his Availability Groups.

10. Set yourself a weekly reminder to test restores. AG backups are notoriously complex, and if you cared enough to set up this whole expensive infrastructure, then you should care enough to test it. Make sure you have a good, restorable set of backups.

Kendra says: In a complex environment, I’m a fan of some paid third party tools that help you control the compression on your backups and which can keep a central repository of backup history, to help you monitor. Good news: Ola’s solution integrates with them! You can have your backup cake and eat it, too.


New SQL Server Management Studio 2015/June – with Check for Updates!

SQL Server
30 Comments

This morning, Microsoft announced a new standalone SQL Server Management Studio download:

This is our first effort to release SQL Server Management Studio (SSMS) in a mechanism outside of the SQL Engine releases. Our goal is to update this frequently with new features, fixes and support for the newest SQL Server features in SQL Server Engine and Azure SQL Database.

Awww yeah! Lightweight installer, and here’s the best part: there’s a built-in check for updates.

Check for Updates in SSMS

That’s right: Microsoft might start shipping updates to SSMS outside of the regular SQL Server Service Pack scenario!

This telegraphs a couple of interesting things: first, they had to do it because Azure SQL Database ships updates much faster than SQL Server does, so this gives Microsoft a way to enable those updates in SSMS without releasing a separate service pack.

But more interestingly – to me at least – is that this means SQL Server Management Studio is now considered The Way to Manage Azure SQL Database. There isn’t a separate tool coming, nor will designer/developer tools like Visual Studio become a management tool.

SSMS is finally getting some much-needed love. Rejoice, dear readers.


How Do You Manage DBAs? Part 1: Measuring Backups

When the DBA reports to you, ask yourself two questions:

  1. “What would I fire the DBA for?”
  2. “How can I prove that they’re not doing that?”

There’s a lot of possible answers to #1, many of which involve cocaine and the office copier, but let’s focus on one I hear a lot: an inability to restore data that they claimed was backed up.

Backups are the foundation of our Hierarchy of Database Needs. They’re incredibly important, but yet they often get ignored because nobody’s banging on the DBA’s cubicle telling them to focus on backups. Instead, users are screaming about performance or too-tight security.

It’s up to you, their manager, to enable them to get the basics down. Here’s how to do it.

1. Ask for a report of most recent backups, by database.

KPI: Coffee Cups Consumed (by André Freitas)

Call in the DBA and give them a list of columns you want in the report:

  • Server name
  • Database name
  • Database size
  • Purpose (production, QA, development)
  • Last full backup finish date/time
  • Last log backup finish date/time
  • Last successful DBCC CHECKDB finish date/time
  • Last date/time the backups were restored for testing

They can produce the report in any format that works for them, but they have to be able to produce it on demand with less than five minutes of manual work. (Ideally, they’d give you a solution you can run on your own, without telling them, but let’s start with something easy.)

Tell them this first task is about getting the lay of the land first, not fixing the problems. Oh, they’re going to find problems alright – but focus on just getting a clear picture of the work ahead first.

This task may take them a day or two because they have to assemble an exact list of the servers they’re responsible for, plus build the report process. (The good DBAs reading this are thinking, “I could do this in fifteen minutes!” If you’re just saying that now, that means you haven’t done it yet, and you’re not quite as good as you think. The great DBAs are thinking, “Yeah, that’s about how long it took me to get it right the first time.”)

2. Help the DBA come up with an improvement plan.

They’re going to be ashamed/disappointed by some of these numbers. (Or if they’re not, there’s your answer about their fit for the DBA position.)

Let them build a back-of-the-napkin mini-project plan to improve the metrics for your most important server. Give them that time – typically there’s a day or two of work involved – and after they finish, review what worked about the mini-project and what didn’t. Use that knowledge to build out a plan for the rest of the servers.

Your job is to run interference for them while they get the backups and DBCCs under control. When the DBA gets “urgent” help requests from end users, here’s what I coach them to say:

“Right now, I’m focused on a project to get our backups under control. If this issue is more important than getting our production data backed up, let’s go into my manager’s office together and talk through it. If not, I hate to say this, but I’ll need you to file a help desk ticket and I’ll get to it once we’ve got the backups under control.”

Yes, this means admitting that the backups aren’t under control. It’s the only way end users will accept a “no” from the DBA.

After this project finishes, run the report again, talk through the results, and then take the results to the business users who are storing data on these servers.

3. Ask the business if this amount of data loss is acceptable.

Take the backup numbers to the business along with our free RPO/RTO Worksheet. By default, the business usually wants zero data loss and zero downtime, but as good IT managers, we have to communicate the realities of today’s databases.

Armed with the costs and timelines in that worksheet, bring written RPO goals back to the DBA. (Yes, to be a good manager takes work, and these are political problems, not technical problems – save your DBA for the technical problems.) Sometimes, this will mean bringing budget numbers back as well – if the business wants tighter RPO/RTO goals than the current infrastructure provides, the DBA will need resources to build the infrastructure improvements.

4. Measure the gap between IT’s RPO goals and the DBA’s delivery.

Remember that report the DBA built? Add two columns:

  • IT’s goal for this database’s data loss (in minutes/hours) – you and the DBA come to an agreement on a realistic goal. In underfunded shops, this is sadly less ambitious than the business’s goals. (Example: “The business wants us to lose no more than 1 minute of data, but I understand that they’re not giving you space for log backups, so let’s aim for losing no more than 1 hour of data.”) In well-funded shops, the IT goal may actually be more ambitious than the business’s goal.
  • The gap between the DBA’s delivery and IT’s goal – if the last successful backup was 45 minutes ago, but we’re aiming for <30 minutes of data loss, we’re in the red by 15 minutes. This metric is how we measure DBAs.

As long as this gap is in the black, the DBA is doing a good job on backups. (Note: I’m not even talking about restore tests or DBCCs here – this is just what I consider table stakes on managing a DBA.)

When this number goes into the red, the DBA should stop focusing on anything else – anything – and focus exclusively on getting the data protected again.

For bonus points, trend the total server count, database count, and total data size over time. This helps your user base understand that the infrastructure will come under more pressure as the data size grows – you can only cram so much data into a server before performance issues arise.

In the next post in this series, I discuss training budgets for DBAs.


New Updates for sp_Blitz®, sp_BlitzCache™

SQL Server
24 Comments

We’ve just updated our First Responder Kit to include new versions of these tools:

sp_Blitz® v41 – June 18, 2015:

  • Added check 162 for CMEMTHREAD waits on servers with >= 8 logical processors per NUMA node.
  • Added check 159 for NUMA nodes reporting dangerously low memory in sys.dm_os_nodes.
  • Added check 161 for a high number of cached plans per KB 3026083.
  • Fixed a bug in the SkipChecks routines. Reported by Kevin Collins.
  • Backup-to-same-drive-as-databases check (93) now includes the number of backups that were done so you can tell if it was a one-off problem, or if all backups are going to the wrong place.
  • Bug fixes and improvements.

sp_BlitzCache™ v2.4.6 – June 18, 2015:

  • Temporary object cleanup will actually occur – thanks to Bob Klimes for
    spotting this
  • Adding memory grants to expert mode and export to excel mode
  • Parent object name is now displayed next to statements that come from a
    stored procedure
  • Run clean up in ##bou_BlitzCacheProcs before executing – this should
    prevent duplicate records from building up over multiple executions on
    the same SPID.
  • Added a @sql_handle parameter to filter on queries from a specific
    sql_handle or sql_handles
  • Added support for filtering on database name

How will the sp_BlitzCache™ changes look?

When you have a stored procedure with an expensive statement inside it, you’ll now see the parent procedure’s name in the Query Type column:

Presenting-2015-06-19T07-46-27

Database name filtering works just like you’d expect – use the @database_name parameter to limit the analysis to a single database.

And, finally, if you want to look for a single stored procedure or batch of statements, you can grab the SQL handle. A SQL handle identifies a procedure or batch, but they’re only included in the expert mode results. Use @results = 'expert' and scroll very far to the right in the results. You’ll see a bunch of binary gibberish in there – one of the columns will be SQL Handle. Grab that and add a @sql_handle parameter to your execution of sp_BlitzCache™, just like this:

What next?

If you’ve already subscribed to email updates about our tools, you got an email this morning with a direct link to the zip file. For the rest of you, hit up the download/EULA page, and enjoy! Hope this makes your database work easier.


The Nine Circles of Developer Hell

Humor
8 Comments
Commit message: Duck!

Everyone’s code is terrible. But exactly how terrible is yours?

First Circle: Code Limbo

We can’t say this is good code, but for the most part nobody notices it.

Second Circle: Code Lust

Cool function, bro!

Third Circle: Gluttonous Code

There’s always one simple piece of logic that’s been written hundreds of times, all over the codebase, but in slightly different ways. And then, one day, you need to change it.

Fourth Circle: Angry Code

Your application has periodic timeouts, which disappear as soon as users report them.

Fifth Circle: Greedy Code

This code was only supposed to run once when a user logged in and their profile was loaded. But sp_BlitzCache® says it runs 4,000 times per minute when you’re hardly doing anything.

Sixth Circle: Code Heresy

This code looks incredibly bad. It violates common sense, but it works right now. You’re afraid to touch it, for fear it will burst into flames.

Seventh Circle: Violent Code

Your application is deadlocking, and literally killing itself.

Eighth Circle: Code Fraud

That day you find out that large portions of your source code don’t actually belong to your company. And now you need to fix it.

Ninth Circle: Treacherous Code

When your database corrupts itself.


Indexing for Windowing Functions

Indexing, SQL Server, T-SQL
6 Comments

Hooray Windowing Functions

They do stuff that used to be hard to do, or took weird self-joins or correlated sub-queries with triangular joins to accomplish. That’s when there’s a standalone inequality predicate, usually for getting a running total.

With Windowing Functions, a lot of the code complexity and inefficiency is taken out of the picture, but they still work better if you feed them some useful indexes.

What kind of index works best?

In general, what’s been termed a POC Index by Itzik Ben-Gan and documented to some extent here.

POC stands for Partition, Order, Covering. When you look at your code, you want to first index any columns you’re partitioning on, then any columns you’re ordering by, and then cover (with an INCLUDE) any other columns you’re calling in the query.

Note that this is the optimal indexing strategy for Windowing Functions, and not necessarily for the query as a whole. Supporting other operations may lead you to design indexes differently, and that’s fine.

Everyone loves a demo

Here’s a quick example with a little extra something extra for the indexing witches and warlocks out there. I’m using the Stack Exchange database, which you can find out how to make your favorite new test database here.

The query above is running on the Posts table which only has a Clustered Index on the Id column, that does us absolutely no good here. There are tons of access operations and logical reads. Taking a look at the plan doesn’t offer much:

I am a plan. Love me.

Let’s try a POC index to fix this up. I’m keeping ViewCount in the key because we’re aggregating on it. You can sometimes get away with just using it as an INCLUDE column instead.

We can note with a tone of obvious and ominous foreshadowing that creating this index on the entire table takes about 15 seconds. Insert culturally appropriate scary sound effects here.

Here’s what the plan looks like running the query again:

I'm a Scorpio. I like Datsuns and Winston 100s.
I’m a Scorpio. I like Datsuns and Winston 100s.

That key lookup is annoying.

Not all key lookups are due to output columns. Some of them are predicates.

We did a good job of reducing a lot of the ickiness from before:

But we’re not happy. Why? Because we’re DBAs. Or developers. Or we just have to use computers, which are the worst things ever invented.

Behold the filtered index

Cool. This index only takes about three seconds to create. Marinate on that.

This query is so important and predictable that we can roll this out for it. How does it look now?

Well, but, WHY?
Well, but, WHY?

That key lookup is still there, and now 100% of the estimated magickal query dust cost. For those keeping track at home, this is the entirely new missing index SQL Server thinks will fix your relationship with your dad:

But we took a nice chunk out of the IO and knocked a little more off the CPU, again.

What can we do here?

Include!

Running the query one last time, we finally get rid of that stinky lookup:

Bully for you!
Bully for you!

And we’re still at the same place for IO:

What did we learn? Windowing functions are really powerful T-SQL tools, but you still need to be hip to indexing to get the most out of them.

Check out our free resources on Windowing Functions here.

Jeff Moden talks at length about triangular joins here (registration required).


Announcing the Dell DBA Days: August 25-28

SQL Server
22 Comments

If you want to work on the cutting edge, you can’t just read best practices – you have to go create them. Somebody’s gotta teach you how to use SQL Server 2016, right?

We asked Dell if we could fly out to their headquarters in Round Rock, Texas and borrow a bunch of hardware and storage gear for a week. Doug, Erik, Jeremiah, Kendra, and I will set up shop to do lab tests, experiments, and learning with the latest hardware, shared storage gear, and SQL Server 2016.

And we bet you wanna watch online.

So we’re bringing you Dell DBA Days. Twice a day, we’ll take a break from our work to do a one-hour webcast with you, talking about how we’re testing and what we’re learning.

Here’s the webcast lineup:

  • Tuesday morning – How Do You Fix a Slow TempDB?
  • Tuesday afternoon – TempDB Load Testing with SQL 2012, 2014, 2016, and SSDs
  • Wednesday morning – Introducing This Week’s Lab
  • Wednesday afternoon –  Advanced Shared Storage Features
  • Thursday morning – Find Your Slow SQL Server’s Bottlenecks Fast
  • Thursday afternoon – How to Prove Hardware is a Problem
  • Friday morning – SQL Server High Availability Options Explained
  • Friday afternoon – Watch SQL Server Break and Explode

Register now to watch us live.


PASS Summit #FreeCon2015: What We’re Talking About

#SQLPass, Blogging, SQL Server
3 Comments
FreeCon SQLSaturday Chicago 2012

On the Monday before the PASS Summit in Seattle this year, we’re putting on another one of our FreeCons. The FreeCon is different from a typical conference pre-con – it’s free, and it’s about the SQL Server community, presenting, marketing, branding, networking, and yes, some technical stuff too.

In the past, they’ve been invitation-only, but this year we opened up applications to the public. One of the application questions asked, “What’s the one thing you want to learn from the Brent Ozar Unlimited team?”

The answers were really enlightening, and we figured you’d like to hear ’em too, so here’s some of the highlights:

Business / Branding / Marketing Answers

How some of the brilliant marketing initiatives come about (brainstorming, creativity, etc) .

Tips on protecting IP and what works for you.

How to know when you are really ready to become a consultant.

Shameless self promotion 🙂 I’ve got skills and I want to market them better. I know about many different aspects of IT and SQL Server, but aimed at the small to medium shops. A more personal relationship with my customers is key.

How to build brand. I’m not a consultant or self-employed, but I am interested in expanding beyond the user group core of my local community. I don’t really know where to start or have a very solid idea of what it would entail–aside, of course, from the limos and champagne…

Presenting Answers

How to build demos that don’t suck.

How to build an plan to move from being a known speaker to one of the best speakers. I have had some great success but would love some help getting to the next level.

How to approach New technical initiatives at work and how to approach upper management correctly to gain buy-in.

Tips about presenting and stage-presence.

Technical Answers

Performance tuning especially query optimization and hardware optimization.

SQL 2014 in-memory tables; service broker; pushing the limits of availability groups, interesting stuff with larger/distributed setups

Best arguments to convince my employer that my unofficial, very-time-limited accidental DBA-ing isn’t going to cut it (especially since I got primarily other responsibilities), we need a dedicated DBA.

Community / Volunteering Answers

Finding the right mix of technical ‘up-keep’ and community leadership/involvement.

What you define as community success

Why public speaking at SQL events is so important.

I would love to learn how you guys structure your days and manage everything that you do (working, speaking, blogging, training). What are your personal stories, how did you get to where you are today, and what have you learned along the way?

Your Answers Help Us Build the Agenda – and the Community

As I wrote five years ago in my post Rock Stars, Normal People, and You, building a successful community means reaching out to those around you, giving back, and propelling the community forward. It’s been so exciting to hold these events and see the graduates go on to do amazing things for themselves and the community.

This year’s FreeCon is about finding 50 people who are excited to keep pushing the boundaries of community, and then us all helping each other fill in the gaps to multiply our efforts.


New sp_BlitzFirst® Reports on Waits, Files, Perfmon Since Startup

SQL Server
7 Comments

When your SQL Server is slow right now, you can run sp_BlitzFirst® to find out what’s going on. It checks for things like long-running queries, backups, blocking, files growing, and will tell you the top wait stats right now.

You can use the @Seconds parameter to control the sample length – by default, it samples for 5 seconds.

In the newest version, you can use @Seconds = 0 to skip the sampling altogether, and turn on @ExpertMode = 1 to see all the dirty details:

sp_BlitzFirst with @Seconds = 0 - click to enlarge
sp_BlitzFirst with @Seconds = 0 – click to enlarge

The top result set is about urgent warnings, and you can skip those if you’re doing over-time analysis. The wait stats and physical reads/writes are useful, though – these show you the top files by reads and writes for your instance.

Also in the news, when you fill out our EULA to download it (along with all of our goodies), there’s a checkbox to get alerted whenever we update our First Responder Kit. If you check that, we now send you a direct link to the zip file so you don’t have to hassle with the EULA again.

Enjoy, and hope this helps make your life easier.


Faster queries using narrow indexes and CROSS APPLY

Indexing, SQL Server
32 Comments

It’s common to try to build the perfect index for a query. This index only uses the exact right columns for the key columns and other, presentational, data is pushed to the INCLUDE section of the index. While you can create a narrow key this way, the entire index row can become wide.

A Sample Report

For this blog post, we’re going to work with the StackOverflow dataset. For more information on getting started with the StackOverflow database, check out How to Query the StackExchange database.

We want to find interesting, unanswered questions that have been asked in the last 90 days.

We’ll start by creating some indexes:

And here’s our sweet query:

This query uses a lot of CPU and uses nearly 5 seconds of CPU time on my machine between parsing, compilation, and execution. Overall it does around 1 million logical reads. That’s a few too many reads for my liking. I think we can make it better.

Simple, Small, Indexes and APPLY

We need a way to make this query faster and lighter. First, we get rid of the wide index we created before.

We add two more indexes:

And then we re-write the query with magic:

The new query performs 800,000 reads but it only takes 1.2 seconds to execute and it goes parallel (1.9 total CPU seconds are used). This is a big improvement over the first query, and I’ll explain how we got there.

What makes the CROSS APPLY faster?

This query has a lot of differences from the first query. Let’s break down what’s going on in here.

We’ve split out the core of the query into two CTEs. In this case, we’re using the CTEs as optimization fences. Rather than let SQL Server do its own thing with optimization, we’re tricking it into providing the optimization path that we want – recent_votes and posts will be optimized separately. Because of this optimization fence, we’ve been able to construct very narrow indexes that bring back the data that we need for each.

After tricking SQL Server into optimizing our CTEs separately, we use CROSS APPLY to pull back the details we want based on a primary key lookup. This helps our query run faster – we need fewer pages allocated for our indexes which means that SQL Server estimates that less memory will be used. The results speak for themselves, too – the second query performs 1/4 the I/O of the first query.

What’s the Result?

The end result is that we have query that’s fast. Our indexes are free of bloat caused by wide INCLUDE columns.


Careful Testing the 2014 Cardinality Estimator with Trace Flags

SQL Server
34 Comments

When you migrate to SQL Server 2014, rather than turning on the new cardinality estimator right away, I recommend sticking with the old cardinality estimator initially by leaving your database in SQL Server 2012 compatibility mode. Let the database settle down for a few weeks, let folks air out their grievances, and give yourself some time to make sure the system is working at least as well as the old system.

Once you’re on 2014, you can check out the new CE’s execution plans by playing around with trace flag 2312. That flag turns on the new CE in one of two ways:

  1. At the query level using OPTION (QUERYTRACEON 2312), or
  2. At the session level using DBCC TRACEON(2312)

The latter is easier if you have to test a lot of queries at once, or if you need to test a stored procedure. Just turn on the trace flag, and it’s on for only your session.*

* – I lied. It’s not.

If you set trace flag 2312 for your session, and then run a stored procedure whose execution plan isn’t already cached, that stored procedure gets compiled using the new cardinality estimator, and the resulting plan is put into cache.

Subsequent sessions will use that plan even if they don’t have trace flag 2312 enabled.

Here’s how to prove it on a SQL Server 2014 server in a 2012 (or earlier) compat mode database:

  1. Pick a rarely-executed stored procedure. (If you’re doing this in production, don’t use a stored procedure that will cripple your server if it happens to get compiled with the 2014 CE.)
  2. Recompile it using sp_recompile ‘myprocname’.
  3. In a new SSMS window, run DBCC TRACEON(2312) to enable the new CE in your session.
  4. Click Query, Include Actual Query Plans.
  5. Execute the stored procedure.
  6. Right-click on the query plan and click Show Execution Plan XML.
  7. In the first few lines, look for the string “CardinalityEstimationModelVersion” – if it’s 120, that’s the new CE. 70 is the old one. You’ll see 120 as shown in the example below.
  8. Close that query window, and start a new one. Run DBCC TRACESTATUS to verify that you don’t get a line for 2312, indicating you’re still on the old CE.
  9. Make sure Query, Include Actual Query Plans is on.
  10. Execute the stored procedure again.
  11. Right-click on the query plan and click Show Execution Plan XML. Even though you’re in the old compat mode, you’ll be looking at a 120-level CE plan.
  12. Recompile that stored proc using sp_recompile ‘myprocname’ just to make sure it gets out of cache.
Execution plan XML - note the CardinalityEstimationModelVersion at the top right.
Execution plan XML – note the CardinalityEstimationModelVersion at the top right.

So how do you test stored procedures with the new CE?

You could test on a different server with the databases set to the new 2014 compatibility level, but of course when you’re testing execution plans and query performance, the servers need to be identical. That’s not always possible.

If you have to test both the old & new CEs on the same server, you’ll need to create new stored procedures (like myprocname_2014) with OPTION (QUERYTRACEON 2312) on every single query in the stored proc – or, at least, all of the queries where you’re concerned about performance variances.

Kendra says: Well, there’s always plan guides. Kidding! I’M JUST KIDDING!


What Permissions does QUERYTRACEON Need?

SQL Server
9 Comments

The QUERYTRACEON hint can be particularly useful for testing the new cardinality estimator in SQL Server 2014 on individual queries using Trace Flag 2312, if your database is still using compatibility level 110:

Conversely, if you’re using the new estimator everywhere by having database compatibility set to 120, you can use the old estimator for an individual query by using QUERYTRACEON 9481:

But… Permissions?!?!

There’s a little problem. Turning on a trace flag requires high permissions. Let’s say that I’m attempting to use this hint from an account which doesn’t have superpower permissions. Here we create a login and user for app_account and grant it data reader, and execute on the dbo schema:

We can now impersonate app_account to run some tests!

Meet Error 2561, User Does Not Have Permission to Run DBCC TRACEON

When I try to run the query, things screech to a halt:

Error 2571 - no permission to run DBCC TRACEON
Oh, sad panda

Even if I try to get tricky, I can’t sneak this into a temporary procedure as app_account, either:

cannot sneak this into a temp procedure, either
Deferred name resolution doesn’t help me here. I guess it’s not a name.

Stored Procedures to the Rescue

We need a little help from a stored procedure. We’re going to revert back to our sa role, and create a procedure around our query:

Due to the magic of ownership chaining, we can now run the query as app_account:

No errors to be seen


This Means You Don’t have to Give Your applications Sysadmin Rights

… but you may have problems if those applications need to run a lot of adhoc queries.


New Free Quizzes: Indexing, Query Writing, and More

SQL Server
4 Comments
Quiz time!
Quiz time!

Want to test your knowledge on indexes and query tuning in SQL Server?

Curious how your query tuning style compares to others?

Looking to have a little fun?

Interested in a coupon code?

Your Monday just got better. Check out our new free online quizzes right now:

  1. Test your SQL Server indexing prowess
  2. See how your query writing skills compare to others
  3. Take the SQL Server query tuner personality test

When does a Query Get Trivial Optimization?

We had some great questions about trivial execution plans in SQL Server in our Advanced Querying and Indexing class a few weeks ago. Here’s a little glimpse into what we talked about.

For really simple queries, SQL Server can use “trivial optimization”. If there’s a very limited number of ways to run the query, why do a bunch of fancy, CPU burning cost-based optimization? Just chuck the plan at the query and let it go!

Downside: Trivial plans don’t ask for indexes

With a trivial plan, SQL Server never gets to the phase of optimization where it would ask for an index. This means you might have a really frequently executing query running against your SQL instance, burning lots of CPU which might be vastly improved by an index, but nothing ever registers in the missing index dynamic management views.

How Trivial Does A Query Need to be for this Optimization?

I find trivial plans frequently, but it’s also a little trickier than you’d think. Let’s look at some examples:

I’m starting off with a simple query, running against a large table:

The Posts table has only a clustered primary key on on the Id column. This query gets FULL optimization, and SQL Server asks for an index.

full optimization with an index request
I’d like this to go, with an index please.

Why wasn’t this plan trivial? Well, even though SQL Server didn’t have its choice of indexes to use, notice the parallel lines in there. SQL Server did have to decide whether or not to use more than one processor!

Let’s Take Away SQL Server’s Choices

Sorry SQL Server, I’m writing this blog post, and I know that I can remove this query’s chance to go parallel by raising one setting: Cost Threshold for Parallelism.  This setting is the “estimated cost bar” for who gets to use multiple cores. I’m going to pump this setting up so my query doesn’t qualify.

Be careful, this setting impacts all queries on the instance, and maxdop hints don’t override it.

Now, rerunning my query:

trivial plan, no missing index request
I’ll just scan the clustered index and keep my mouth shut.

This time I got trivial optimization – the query’s estimated cost for running a single threaded plan doesn’t even qualify for parallelism, so that choice doesn’t exist.

No missing index shows up, even though SQL Server did 346,913 logical reads for this query.

What if I Add an Unrelated Nonclustered Index?

Now that we have a trivial plan, let’s give SQL Server a choice– but not a very good choice. We’re going to create an unrelated non-clustered index:

Our query doesn’t reference the LastActivityDate column at all.

Rerunning our query…

full optimization due to an an NC index
I had to think about things this time.

Full optimization is back! Even though the LastActivityDate index seems really unrelated to what we’re doing, just adding it puts us back in FULL optimization.

Let’s Clean Up That Cost Threshold

Otherwise I’ll forget about it and not understand the weird plans on my test machine later. I’m just setting it back to the default here:

Takeaways: Beware the Creeping Trivial Plan

While most of your tables may be indexed well, it’s easy for changes in code to result in poorly indexed changes creeping out. While SQL Server’s default setting of 5 for “Cost Threshold for Parallelism” is generally far too low for modern processors, understand that raising it may increase your chances of getting trivial execution plans, which won’t ever ask for indexing help.

Want to find out if you’ve got trivial plans among your top queries? Our free sp_BlitzCache™ procedure sniffs around in your query XML and warns you right away.


Features SQL Server Needs to Add (And Drop)

SQL Server
30 Comments

When you work with the same database server day in and day out, you can get a bit blinded by your assumptions. You might just assume that the way SQL Server does it is how every database does it.

But check out these features from other database platforms:

Cache query results – SQL Server only caches raw data pages. If you join ten tables together and do an ORDER BY on the results, SQL Server doesn’t cache any of its work tables or the final results. It rebuilds that wheel again every time the query runs – even if the data hasn’t changed, and even if the data is read-only. Oracle’s SQL Result Cache does just what it says on the tin.

Transactional DDL – When you need to change a bunch of database objects as part of a deployment, better have your prayer beads handy. If any change goes wrong, especially in a long, complex script with no error handling, you can find yourself with a mess of a database where some changes worked and others didn’t. PostgreSQL’s transactional DDL support lets you start a transaction, make your table changes, and then only commit if they all worked.

Warm up the cache automatically – Restart a SQL Server or fail it over to another cluster node, and performance starts over from scratch: all queries will hit disk because nothing’s in the buffer pool yet. PostgreSQL’s pg_prewarm and pg_hibernator let you write the buffer pool to disk during a graceful shutdown, and warm up the cache on other nodes before you fail over so that they’re ready to fly.

Refresh indexed views on your terms – SQL Server’s indexed views are persisted to disk, but they’re always updated in real time with every delete/update/insert of the underlying tables. While that sounds like a good thing, it’s not a great idea for data warehouses where we want the fastest possible loads, or reporting tables for an OLTP system. Oracle’s materialized views can be refreshed on a scheduled basis. Need more up-to-date data? Just refresh ’em. Need to hold off while you run a database-intensive Black Friday sale? No problem, leave the views as-is.

Like these? I’ve got more. In a fun, relaxed webcast on Tuesday, June 23rd, I’ll will show you a few features from other database platforms, plus give you a tour through my favorite Connect.Microsoft.com requests. I’ll also discuss features that just didn’t catch on – and probably need to be taken out to the farm. We’ll talk through the whole thing live over Twitter, too.

Register for the webcast now.


Who’s Backing Up That Database?

A question came up on Twitter recently– how you can you figure out where a rogue backup is coming from?

I’ve run into this question with clients before. In an enterprise environment where backup tools come and go, it’s not unusual to find backups being run by some mysterious account.

By the way, when’s the last time you changed your service account password?

Uncomfortable discussion time: should something unknown out there have permission to do this?

Lecture over, let’s track down the culprit

If the backup command is failing, it’s probably generating a level 16 error much like this:

The good news is that you can easily set up an alert to notify you right away when these problems happen.

The bad news is that the alert doesn’t tell you who tried to run the backup. Neither does the SQL Server Error log, it just says:

But, uh, who exactly is the backup application?

If the Backup is Failing, You Can Trace Based On the Error

SQL Server doesn’t capture the details for Severity 16 alerts by default, but you can trace failing commands in your SQL Server like I show in this earlier post. In this case, we want to customize the Extended Events Trace so we can get more information about who is trying to run the backup.

Here’s an example script to set up a trace (SQL Server 2012 and higher only):

Now, when my backup fails, I can open up my trace file and see info like this:

backup being run from the sa account
It’s in the walls!

IF THE BACKUP IS Succeeding, YOU CAN TRY ANOTHER TRICK

You might have a situation where the backup isn’t failing, you just aren’t sure who’s running it and what permissions they’re using. Maybe you notice a message like this in your SQL Server Error Log:

Someone’s backing up my master database, but writing it out to NUL: and throwing it away? That’s crazy! Why would someone do that? I need to track them down right away. I think a little user action is required.

In this case, since the backup command succeeded, I can get more information right away from SQL Server’s default trace. It saw the name of the host I was running from (“UNLIMITED”), the fact that I was running under the SA account, and even the fact that I was dumping the data to NUL:

backup event in the default trace
The default trace sees the terrible thing I did

How to Set Up Standard Edition Always On Availability Groups in SQL Server 2016

SQL Server 2016 adds Availability Groups in Standard Edition. While the licensing details can obviously change right up to release date, here’s what was announced at the Ignite conference:

  • Limited to two nodes only (a primary and a secondary)
  • Like mirroring, you can’t read from the secondary, nor take backups of it
  • But like database mirroring, you can take snapshots of the secondary for a static reporting copy
  • Each database is in its own Availability Group

In CTP2, this is referred to as a Basic Availability Group.

Yes, a BAG. I can’t make this stuff up people. But here’s what I can make up:

  • If you use HammerDB for load testing of a BAG, that’s a BAG of Hammers
  • If you have ten databases, each in its own BAG, that’s a Dime BAG
  • It could be worse – it could be a Database Basic Availability Group, or a D-BAG

Enough laughing – let’s implement it. For this scenario, I’m already in production with one SQL Server 2016 machine, and I’d like to add a second one to give me some high availability or disaster recovery protection.

I’m setting up a simple AG with two standalone machines:

  • SQL2016A – this will be my primary instance where my databases will normally run.
  • SQL2016B – this will be my secondary, with less horsepower. Could be in the same data center, or in a different one. (To keep things simple for this explanation, I’m going to stick with the same data center and the same IP subnets.)

This checklist will focus on the Availability Groups portion, not the SQL Server installation, so go ahead and set up your second SQL Server using our SQL Server Setup Checklist. Make sure the second one uses the same user database data/log drive letters and paths as your primary server. If you use different paths, then whenever you add a data or log file to an existing database, it will succeed on the primary but then fail on the replica where the drive letters are different. (Only the user database paths have to match – not TempDB, system databases, binaries, etc.)

In theory, you might be able to do this in production without a major outage.

In practice, I wouldn’t bother trying – you’re probably behind on Windows Updates, and you need to apply these prerequisite Windows patches. Because of that, I’d schedule a separate (long) maintenance window to get up to speed on Windows patches, the latest SQL Server updates, and do the first few steps. Even when you rehearse it in a lab, it’s not unusual to run into several restarts-and-check-again-for-updates in the wild, or brief outages to

Let’s get started!

ADD THE CLUSTERING FEATURE TO BOTH WINDOWS SERVERS.

“But wait, Brent – I don’t want to build a cluster!” Unfortunately, SQL Server’s AlwaysOn Availability Groups is built atop Windows Failover Clustering Services, and you have to join your AG replicas into a single Windows cluster.

Fear not – this is nowhere near as scary as it sounds, and it can be done after-the-fact to an already-in-production SQL Server. (I’d recommend you set up a lab or staging environment first to get used to it, though.)

After installing those clustering prerequisites, open Server Manager and click Manage, Add Roles and Features, select your server, and on the Features list, check the Failover Clustering box:

Adding the clustering feature

You can move on to the next step after this feature has been installed on all of the servers that will be involved in the Availability Group.

Validate your cluster candidates.

Open Server Manager and click Tools, Failover Cluster Manager. (I know – you thought Failover Cluster Manager would be under Manage instead of Tools, but it’s these clever switcheroos that keep us all employed as IT professionals.) Click Validate Configuration on the right hand side to start the wizard:

Validate a Configuration Wizard

Put in the names of all the servers that will be participating in the Availability Group, and hit Next. It’s going to ask if you want to run all tests – this is another one of those gotchas where, in theory, you could do this in production without an outage if you chose to run specific tests. I don’t recommend that – just run all tests. If SQL Server is running on any of these nodes, it’ll likely stop while this wizard runs, so do this during a maintenance window.

The validation wizard can take several minutes depending on the number of replicas, environment complexity, and phase of the moon.

Your cluster will probably fail, and that’s okay. This isn’t like school. Nobody has to know if you fail several times. (Chemistry was hard for all of us.) Even if you think you passed, you probably failed a portion of it. (The wizard, not chemistry.)

Click the View Report button, and Internet Explorer will launch because why wouldn’t we take every opportunity to open a browser on a production server:

1998 called, and they want their web developer back

You’ll be tempted to scroll down through it because that’s how most web pages work. This is not most web pages. Click on the first error – in my case, Network – and then click on the first warning it takes you to – in my case, Validate Network Communication – and then read the warnings in yellow:

Validation warnings
Validation warnings

This is where things get a little weird.

Some errors are completely okay to ignore. The most common two are:

  • Single network interface warnings – if you’re doing network teaming or virtualization, you’re probably protecting your network through means that the clustering wizard can’t detect.
  • No disks found for cluster validation – if you’re building an AlwaysOn configuration with no shared disk, like failover clustering on a UNC path or a pair of Availability Group replicas with local disk, this isn’t a problem.

But otherwise, read this report really carefully and fix the warnings before you go on to the next step. For example, if the two nodes have different Windows patch levels, get the missing updates installed first. (If you’re having difficulty getting some of the patches to apply, there’s your first sign that this isn’t a good candidate for a reliable AlwaysOn implementation – more like OftenOn, or OffAndOn.)

After you fix the issues, run the validation wizard again. This is important because the last validation report is saved in Failover Cluster Manager, and you always want that report to look good. When you call Microsoft (or a team of highly skilled consultants) for Availability Groups help, they’re going to start by looking at this validation report, and if it didn’t pass last time, that’s going to be a bad start.

Create the Cluster.

After a successful validation report, leave the “Create the cluster now” checkbox checked, and click Finish – your cluster will be created:

Creating the cluster

This checkbox is particularly diabolical – it will be checked by default as long as you didn’t have any heinously ugly showstopper errors, but even with mildly serious errors, it will still let you create the cluster. Make sure you fix the errors first.

You will be prompted for a cluster name – again, a little diabolical here, because this is not how you will address SQL Server. This name is how you will control the cluster itself:

Picking a cluster name

Think of your cluster like a kitchen – a restaurant can have lots of cooks, but it will have only one head chef. Your head chef knows who’s doing what at all times, and bosses people around. The head chef never actually cooks anything – he just tells other people what to do.

Your cluster can have lots of SQL Server instances in it, and they can have lots of Availability Groups. We need one controller to know what’s going on, and that’s the cluster name.

In my case, I’m using SQL2016CLUSTER. You’ll notice that in my screenshot, it says “One or more DHCP IPv4 addresses were configured automatically” – don’t do that in your production environment. Use static IP addresses. You always want to know where the head chef is.

The next screen will prompt you to add all eligible storage to the cluster – uncheck that unless you’re building an AlwaysOn Failover Clustered Instance.

In a perfect world, the wizard finishes, your cluster is completed successfully, and your Failover Cluster Manager looks something like this:

Cluster Mangler
Cluster Mangler

Pay particular attention to the “Witness: None” line. Just like any good preacher, your cluster needs a witness, so right-click on the cluster name on the left side of the screen, click More Actions, and Configure Cluster Quorum Settings. In the next wizard, choose “Select the quorum witness” and choose either a disk (shared drive) or file share (UNC path) witness.

For my simple two-server configuration, I need a really reliable tiebreaker, so I’m going with a file share witness. I need it hosted on my most reliable server possible – in my simple lab, that’s one of my domain controllers, so I type in the server name and then click the Show Shared Folders button:

Picking a file share for quorum

Click the New Shared Folder button, configure your file share, and exit the wizard. What I just did there is right for my lab, but only my lab – you’ll want to make some better-informed decisions in your production environment. For example, if all of my SQL Servers lived on virtual machines backed by NetApp storage, I’d probably use a file share right on the NetApp itself, because if that thing goes down, all my SQL Servers are hosed anyway.

Enable AlwaysOn Availability Groups on Each Server

On each replica, launch SQL Server Configuration Manager, then go into SQL Server Services, right-click on the SQL Server service, and click Properties.

Service Properties
Service Properties

On the AlwaysOn High Availability tab, check the box to Enable, and click OK. This won’t take effect until the SQL Server service is restarted. Repeat this on all of the SQL Servers.

Now let’s take a moment to reflect: we’ve got a pair of Windows servers that are in the same cluster, but at this point, there are no dependencies between the SQL Server services running. They can be hosting different databases, doing log shipping or mirroring between them, or have absolutely nothing in common. If you’re planning your first AG in production, the work done up to this point is a good amount of work to tackle in one maintenance window. I would schedule all of this for the first outage, and then let things simmer down for the next week or two before assembling the Availability Group components.

Create the Availability Group

Whew! We’re finally done with the Windows portion of setup. Let’s fire up SQL Server Management Studio and have some fun.

On my SQL Server, I have a copy of the StackOverflow.com database that I want to copy over to my secondary replica. It’s already in full recovery mode, and I’ve been taking full backups, so it already meets the lengthy AlwaysOn Availability Group prerequisites.

In Object Explorer, right-click on AlwaysOn High Availability and click New Availability Group Wizard. Starting in SQL Server 2016, we’ve got a few new options:

Availability Group Wizard

As of this writing, the AG documentation hasn’t caught up with the product yet, so here’s an explanation of each option:

Basic Availability Group – terminology can always change leading up to release, but as of CTP2, this functionality is called a Basic AG. I would just like to take another second to point out that the acronym is BAG.

Database Level Health Detection – in Super Availability Groups (as opposed to Basic – look, if they can make up stupid acronyms, so can I) with multiple databases, the SAG doesn’t drop if one database happens to go offline, become corrupt, or take the day off. New in SQL Server 2016 is the ability to force that failover if any one database goes down, so the SAG stays up.

Per Database DTC Support – The Distributed Transaction Coordinator (DTC) enables simultaneous commits across multiple SQL Servers hosted on different hardware. Prior to SQL Server 2016, AG databases didn’t support DTC participation, but now, just check this box.*

* – You’ll probably have to do more than that, but hey, the infrastructure is here.

Since we’re doing Standard Edition, we’ll just check the Basic Availability Group box and move on. Check the box to pick which database you want in your BAG, and then it’s time for replica selections. On this screen, click the Add Replica button and connect to your new soon-to-be secondary:

Choosing your replicas

Here’s what the choices mean, and I’m going to explain them a little out of order:

Synchronous Commit – say SQL2016A is the primary, and a user does a delete/update/insert there. If I check the Synchronous Commit boxes for SQL2016A and SQL2016B, then SQL2016A will write the user’s transaction locally, send the transaction over the network to SQL2016B, write it to disk there, and then wait for confirmation back before telling the user that the transaction is committed. (Most of the time. If SQL2016B drops offline, that’s another story.)

If I don’t check the Synchronous Commit boxes, then I get asynchronous transactions – the SQL2016A primary transaction will succeed right away, and SQL2016A just sends the transactions over to SQL2016B later. SQL2016B can be seconds (or minutes, or hours) behind, so I’ll lose data on failover, but the primary’s transactions won’t be subject to that killer latency.

Automatic Failover – if the Synchronous Commit boxes are checked, then you can do automatic failover between two of the replicas. (This is where the cluster witness starts to come into play – in my two-node setup, SQL Server needs a tiebreaker to know the difference between single node failures and a split-brain scenario.)

For my evil purposes, I only need a disaster recovery copy of my databases, and I don’t want to fail over to DR if my primary just happens to restart or hiccup. I’m going to leave the Automatic Failover and Synchronous Commit boxes unchecked.

Readable Secondary – in Super Availability Groups, you can offload reads and backups to your secondaries. Since I’m dealing with a BAG here, the Readable Secondary dropdown only offers the “No” option.

The tabs for Endpoints, Backup Preferences, and Listener don’t really matter here. SQL Server automatically creates the endpoints for you, and you can’t offload backups or create a listener for BAGs.

The next step in the wizard syncs the data between replicas:

Data synchronization options

The Full option performs one full and one transaction log backup on the primary, then restores them over to the secondary to start the replication. (Keep in mind that if your databases are large, you’ll want to set database backup compression on by default in order to speed this process – you don’t get to choose compression settings in the wizard.)

The other two options are useful if you performed the backups yourself manually, or if you’re using storage replication technologies to get it started.

If you choose the Full option, you can track backup and restore status with sp_WhoIsActive’s percent-completed column.

After the AG wizard finishes, you can right-click on your Availability Group in Object Explorer and click Show Dashboard:

Availability Group Dashboard

Voila! Papa’s got a brand new BAG.

Want help? Talk to Brent for free.

See sample findings now

The problem probably isn’t fragmentation – you keep defragmenting and the problems keep coming back.

Our 3-day SQL Critical Care® is a quick, easy process that gets to the root cause of your database health and performance pains.

Learn more, see sample deliverables, and book a free 30-minute call with Brent.