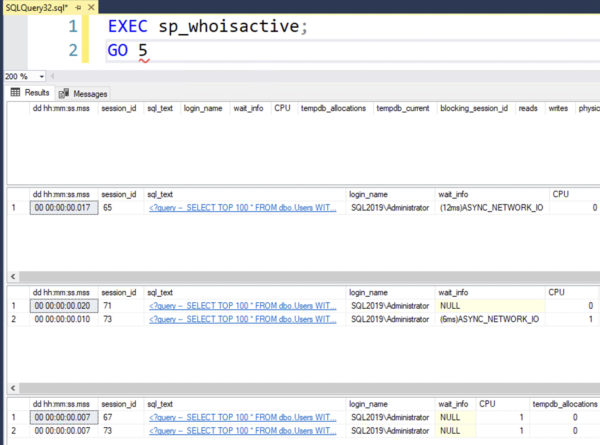
When your SQL Server’s top wait stat is ASYNC_NETWORK_IO, that indicates SQL Server is waiting on the app to ask for the next part of the result set.
This is a real pain in the rear to troubleshoot because often these waits happen for really short duration each time – think milliseconds, not seconds. It’s an issue of death by a thousand cuts.
The easiest way to get a quick idea what’s happening is to use sp_WhoIsActive (Github – releases) repeatedly with no pauses in between:
|
1 2 |
EXEC sp_whoisactive; GO 5 |
Here, I’m running a workload with a lot of short queries running simultaneously. If I just run sp_whoisactive now and then, I don’t see any activity – only a query or two now and then, and they’re rarely waiting on network. However, if I run it several times in a row, right away:
Then I can get a fast, seat-of-the-pants idea of which queries are waiting on networking. I can also scroll across to the right in the result set and see which app it’s coming from, which servers, which logins, etc.
This isn’t an exact science by any means, but when I’m working with a client, it helps me quickly get a rough idea of what’s going on. It helps me start a conversation about the kinds of queries we’re running, how much data we’re bringing back (both in terms of rows and columns), and find out whether the app servers might be underpowered or swapping to disk.
Clients have said things like:
- “Oh, we had no idea that app was bringing back all of the columns, and that’s problematic since we added a few XML/JSON/MAX columns in the table since that query was written.”
- “Oh, we had no idea that application was taking so long to digest the results of those queries. We can give that app server more memory.”
- “Oh, we had no idea that it was bad if we ran the database server in one data center, and the app servers elsewhere.”
ASYNC_NETWORK_IO isn’t necessarily a bottleneck for SQL Server – fixing the above problems may not make a big performance difference overall for other users – so solving it is often a relatively low value during the engagement. sp_whoisactive helps me dedicate the appropriately small amount of time & effort into the problem, and then move on to the bigger problems.


10 Comments. Leave new
Shameless link to my blog in the same subject : https://www.linkedin.com/pulse/my-favourite-wait-state-asyncnetworkio-dave-ballantyne/
There you go, nicely done!
Sp_WhoIsActive and ASYNC_NETWORK_IO helped my friend a couple of times:
“Oh, we had no idea that application was taking so long to digest the results of those queries”. And the application can use only one CPU core, and the appserver is 10 years old – time to budget some upgrades: faster CPU, shiny new web-based bug-free application.
“The application has been very slow since last month”. “Well, the server is fine. But you started WFH last month because of the Covid lockdown, and users’ laptops have been quering the database over the VPN.”
Oh wow, I didn’t think about how COVID affected wait stats! That’s kinda awesome.
I work a government agency and we found the same issues with WFH. I had a ticket open with Microsoft trying to figure it out.
It came down to 2 main factors. First was the VPN was limiting the bandwidth to 35Mbps; so any significant query over 250MB of data was taking minutes instead of seconds. Second, was at this same time we implemented Windows Defender and it seemed that all TDS/SQL traffic was being heavily scanned but regular SMB traffic wasn’t. So we are stuck with Async_NETWORK_IO issues when using VPN, WFH, or anywhere outside of the permitted IP subnet range.
Our workaround, a virtual desktop within the network…
We’ve a shed load of old school odata queries that send 10k rows then wait and possibly wait and wait…. I had to collect data every 10 minutes and if they were async after 1 hour I was allowed to automatically kill them. We never had a memory brownout after that – some were taking 6GB memory.
Also shows the inherent danger of same server for both reporting AND transactional data. Kept me a job, I guess, and with kudos. Sigh.
I imagine ASYNC_NETWORK_IO could lead to blocking, correct?
Can do if somebody is trying to update the object eg the view that is the held open by cause of ASYNC_NETWORK_IO.
Last week I was contacted by one of our developers saying your server is running slow and the CPUs were hammering at 100%. This was causing a major issue accessing the server.
It did throw me to start with, I bounce the server (‘IT Crowd’ power off and on) so to clear the memory and the stats.
Using “sp_BlitzFirst @SinceStartup = 1, @OutputType = ‘Top10’;” to top two were:
Hours Sample Thread Time (Hours) wait_type wait_category Wait Time (Hours) Per Core Per Hour Number of Waits Avg ms Per Wait
23.4 2.7 SOS_SCHEDULER_YIELD CPU 1.1 0.0 3917017 1.0
23.4 2.7 ASYNC_NETWORK_IO Network IO 0.9 0.0 2010009 1.6
23.4 2.7 WRITELOG Tran Log IO 0.1 0.0 1831261 0.3
I also set up an agent job with sp_BlitzFirst to run every fifteen minutes to capture data to prove the issue.
From my ‘Brent Ozar’ training notes I wrote back to the developer:
“ASYNC_NETWORK_IO – not a database problem
Your applications are requesting data that they are not then able to process in a reasonable time.”
The developer accepted this situation.
So I have found Brent’s training useful 🙂
My lead architect takes that feedback and then deflects to the network engineers… LOL “It’s our slow network”
(We have a 10-gig backbone ?)