
There’s a bottleneck in Azure SQL DB storage throughput.
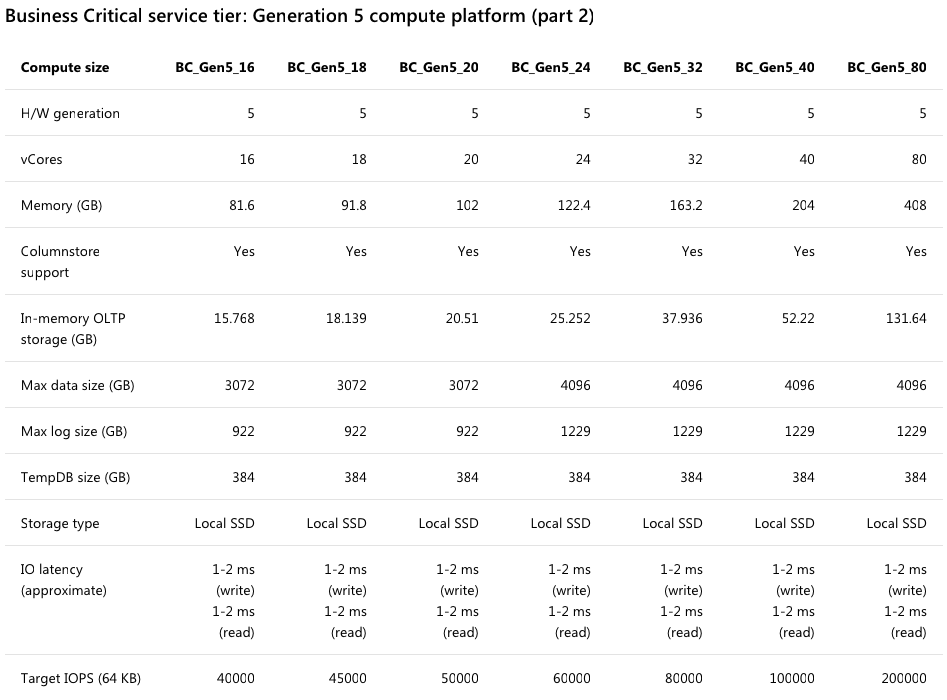
As you pay more for Business Critical Azure SQL DB servers, they’re supposed to get more storage throughput. The documentation on this is kinda hard to read, but boiling it down, for every core you add to a Gen5 server, you’re supposed to get 2,500 IOPs. That should scale linearly: insert speed should go up evenly with each added core.
The bottom line of this screenshot shows the IOPs going up linearly from 16 cores at 40,000, up to 200,000 IOPs for 80 cores:
But can an 80-core server
write any faster than a
16-core server? Well…no.
Sounds like a trick question, doesn’t it?
Let’s start with the Stack Overflow database, which has a 104GB Posts table – 18GB of which is off-row text data because Lord knows y’all like to write some long questions and answers. Then we’ll run this simple query to copy that Posts table to a new one:
|
1 2 3 |
SELECT * INTO dbo.Posts2 FROM dbo.Posts; |
The query will go parallel, using more cores for the reading & writing – so will more cores help? Plus, when you move from an 8-core Azure SQL DB to an 80-core one, you get more memory, and theoretically, more storage throughput.
Drum roll please:
- 8 cores, $1,991 per month: 64 minutes
- 16 cores, $3,555 per month: 32 minutes (and interestingly, it’s the same speed with zone redundancy enabled)
- 80 cores, $18,299 per month: 32 minutes
- Just for reference: 8-core AWS EC2 i3.2xl VM, $1,424 per month with SQL Server Standard Edition licensing: 2 minutes (and I don’t put that in to tout AWS, I just happen to have most of my lab VMs there, so it was a quick comparison)
You can spend five times more,
but you hit a wall at 16 cores.
So why don’t more cores equal dramatically more speed? Your first thought is probably, “Well, Brent, that query isn’t CPU-bottlenecked” – and you’re only partially right, but also pretty wrong. Here’s the Azure Portal showing performance metrics on the 8-core setup while the insert is running:
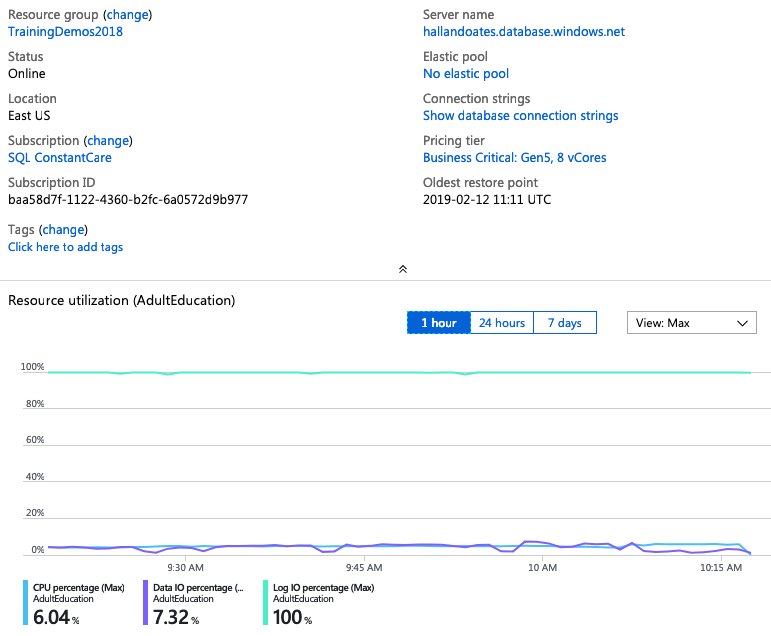
The very light-colored line banging up against the top at 100% is the transaction log IO percentage. Our workload is simply limited by how much Azure is willing to write to disk at any one time. The CPU percentage is 6%, and the read IO is 7%. Even with only 8 cores, we’re paying for CPUs that are sitting around bored.
Upgrade the server from 8 cores to 16 cores, and the load speeds double – which is great! Now, what’s our bottleneck – here are the load metrics on the 16-core box:
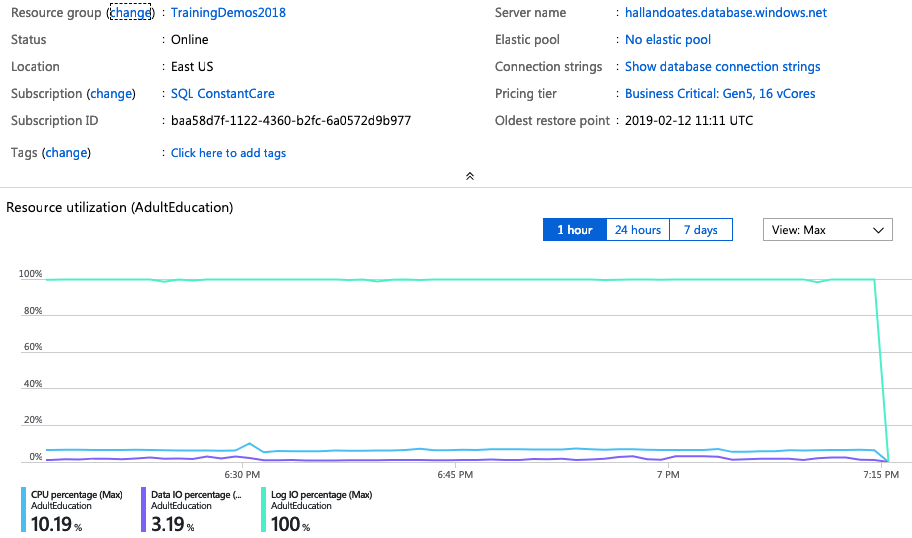
We’re still transaction-log-file-bottlenecked at 100%, and the only way to get more transaction log throughput is to buy more cores. So throw 80 cores at it, and:
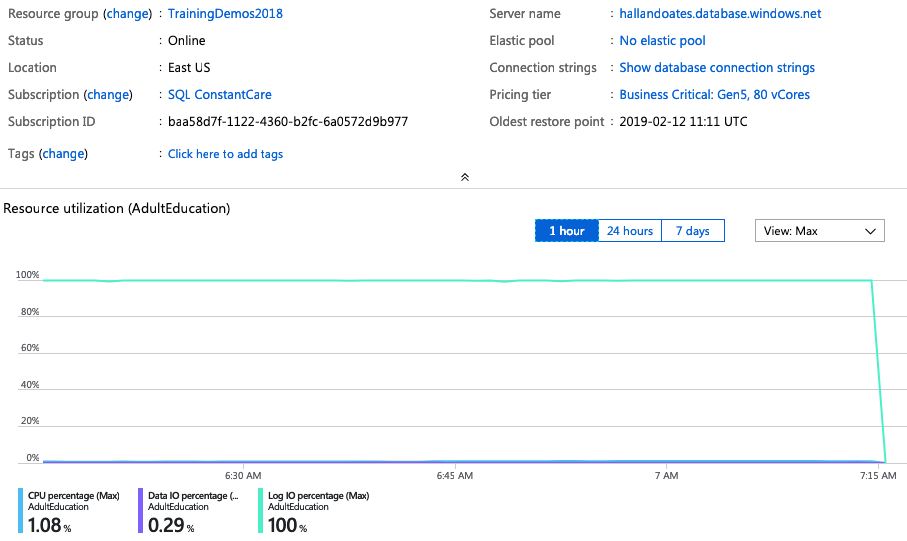
The only thing happening here is that the CPU load is going down, but storage throughput isn’t getting faster. Our workload completes in the same 32 minutes.
This also leads to some interesting MAXDOP behavior. On all of the servers, restricting the query to MAXDOP 1, 2, 4, or any other number didn’t seem to affect the query’s runtime at all. The storage limit is the storage limit, full stop.
The takeaway: bottlenecked on transaction log IO?
Right now, over 16 cores is a waste of money.
Just because sys.dm_db_resource_stats shows that you’re hitting a resource limit, and the documentation says that the limit will go up linearly as you add more cores, don’t trust that it will. You’re going to have to experiment with your workload and different Azure SQL DB sizes in order to find the sweet spot for how much you pay for how fast your query will go. Trust, but verify.
You might be spending more money, but hitting the same limits a 16-core server is hitting!
The old-school DBAs out there will say, “Yes, but if the transaction log file is your limit, you shouldn’t add more CPUs – you should be adding storage.” That’s the problem: in Azure SQL DB, you simply can’t. The documentation says you can by adding more CPUs, but as of this writing, it just isn’t true. I don’t have any inside information here, but there seems to be a problem with Azure SQL DB’s storage scalability. Either there’s a bug in the storage limits that were set, or the documentation isn’t right, because the throughput isn’t simply rising once you get to 16 cores.
Update 2019/02/26 – clarified that we’re talking about the transaction log file, not the error log file, per the discussion on Reddit.

82 Comments. Leave new
Saying something on the product page, which basically isn’t true, isn’t the definition of a scam?
Is this information mentioned in some way in contracts?
Those are both tough questions. This isn’t the first time that a product doesn’t quite live up to the brochure. The nice part about the cloud is that once these things are pointed out, then the providers can work to raise their game. It’s up to you as a customer to test that you’re getting what you’re supposed to get, and then open support requests with the provider to get the problems fixed. (I didn’t go to that level during this post – there’s a limit to how far I’ll go to write a blog post, and I already had about eight hours of work in this, plus hundreds of dollars of costs.) I know people at Microsoft won’t like hearing this, but my job isn’t to volunteer time to fix the product. I only go so far as a journalist.
In terms of contracts, the Service Level Agreements for Azure SQL DB are not very ambitious – only guaranteeing 99.99% connectivity: https://azure.microsoft.com/en-us/support/legal/sla/sql-database/v1_1/ That doesn’t include the ability to access objects, run queries, or get any kind of performance.
Not trying to defend anyone in this “scam trial” 🙂 but looking at public doc below, i can read a “Target IOPS” column, not a “Target Write IOPS”. Maybe you can get those 200k IOPs if you benchmark reads instead?
Learner – I hear you, but I’m not going to spend even more of my money on Azure trying to come up with creative ways that the documentation is correct. If it’s limited to 200k *read* IOPs only, then that should be in the documentation. The documentation for Azure SQL DB doesn’t show a separate limitation on write IOPs.
You’ve left a few comments with great questions – it sounds like you’re exactly the kind of person who should be running experiments like this and blogging about them! Come on in, join the pool, the water’s fine.
It’s in my new year resolution list since quite some time 🙂 i just need to find a permanent fix for my schedule and will do!
I’d love to see a similar post for Hyperscale to see if it makes a difference.
Sure, here you go: https://www.brentozar.com/archive/2019/02/how-fast-can-a-5436-mo-azure-sql-db-hyperscale-load-data/
Thanks!
This actually was befuddling(HA, use that word today in a sentence, I dare you!) me last week. Working with a co-worker last week with doing an ETL to Azure SQL Database. We were running on a GEN 4 8-Vcore database. We bumped it to 16 VCores and saw the time taken to perform the operation reduced to half the time. So, we tried 32, and it didn’t improve at all. It actually, if memory serves me correctly, seemed a bit worse.
We then bumped to GEN 5 8 Vcores and it performed worse then the GEN 4 did. So we swapped it back.
quick question.
What happen if you try to run in parallel multiple queries doing the similar job (having different tables as data source ) .
Could be a limitation per query in order to do not block the entire VM with only query .
Best Regards
Virgil
Virgil – if that were the case, you wouldn’t see the entire database’s log limit at 100%.
This is the same thing I have noticed. The log IO is the bottleneck and adding vCores doesn’t necessarily resolve the issue and when you see the CPU usage so low and the Log IO still so high with added vCores, the cost is not justified.
I was curious so I broke out the numbers:
104 GB / 1920 seconds = about 58,161,000 bytes written per second. If most/all of those log writes were full 60kb log buffers (and assuming each log buffer write corresponds to one 60kb disk write), that 58 MB/sec is ~950 write IOs/sec. 1000 write IOPS is nowhere close to the docs. Even if they were written assuming workloads with a high read-to-write ratio (where the sum of read + write IOPS is the peak speed), the workload would have to be 39000 read IOPS to 1000 write IOPS to match the *lowest* tier of table above. A 39-to-1 ratio doesn’t seem very realistic.
These numbers are so far off, it’s hard to believe Microsoft actually did any real-world testing to reach the advertised speeds.
Aaron – that was my first guess too! Based on performance, I guessed that somebody accidentally used the same write throughput limits for 16 cores and higher – like they didn’t update a configuration table in a database somewhere, and it’s the same numbers regardless of how many cores you have over 16, and nobody ever tested it.
in this document is say that is about 5000 IOPS/core with a max 200K IOPS
https://docs.microsoft.com/en-us/azure/sql-database/sql-database-service-tiers-vcore
Virgil
The published IOPS limit is for data files. The key throughput measure with Azure for Log I/O is MB/s. In the Azure vCore model you get 3 MB/s Log I/O throughput per logical core. On Gen5_8 that is 8*3 or 24 MB/s, whereas on Gen4_8 that is 16*3 or 48 MB/s. Also, my recollection from working with the Microsoft team is that Gen5 has a hard limit at 48 MB/s, which would be why scaling loads above Gen5_16 doesn’t help.
If you load via BCP or via INSERT INTO (must use OPTION MAXDOP 1), you will barely touch the logs. SELECT INTO will crush the logs. We rewrote all of our monthly load jobs to use INSERT instead – we load into new tables with a clustered columnstore index in place and we never go about 20% log I/O throughput. SELECT INTO and then building the CCI runs 10-20% faster, but both operations run above 98% log I/O throughput the entire run time. We have 20 client databases on our elastic pool, when two of them were doing loads via SELECT INTO at the same time, our entire elastic pool was unusable.
I have spent the last 4 weeks with the Azure engineers doing massive performance testing on Gen4 and Gen5. If you are a reporting application and can live with slower load performance, the query performance above Gen5_16 is truly outstanding. If query concurrency and performance is your top need, you get what you pay for with the higher Gen5 tiers. If load performance is your top concern, you will want to stay on the Gen4 model as you get twice the log I/O throughput at the same pricing level. You just get a 1 TB limit – which was a showstopper for us.
Aaron, do you know how many DTUs it takes to hit the 48 MB/s log hard cap?
At some point the limit would be the speed of the storage your data lies on. How are they scaling the speed with CPU cores?
Well, that’s kinda the point – they should be scaling up storage. (That’s why I included the Amazon EC2 reference that runs in 2 minutes.)
When I was researching the best drive layouts for MI, I came across an interesting white paper that talks about storage throttling being based on the size of the file.
https://techcommunity.microsoft.com/t5/DataCAT/Storage-performance-best-practices-and-considerations-for-Azure/ba-p/305525
Dale – right, but that’s Managed Instances, not Azure SQL DB. It doesn’t appear to be related here, at least not based on my recent Azure SQL DB ingestion testing, in which max data size wasn’t relevant to ingestion throughput:
https://www.brentozar.com/archive/2019/02/how-fast-can-a-21468-mo-azure-sql-db-load-data/
And in Azure SQL DB, you can’t pre-define your database file sizes (only the max size.)
Now what would be cool is if you built a comparable VM in Azure and compared. Is it specific to Azure SQL DB? How about Managed Instances? Does RDS have similar limitations, I know that is silly, but it would be a little more thorough of a comparison. My gut says that it was true at one point in time and something was introduced that caused the issue.
James – sure, that’s a great idea for a blog post! You should totally go for that.
(See what I did there? Heh. Yeah, there are always so many ideas for posts – you should go for it! Start a blog, it’s incredible fun. I wouldn’t be the right guy to do it because I don’t do a lot of work with Azure VMs, thus the quick comparison with an AWS VM in the post.)
[…] by /u/Arkiteck [link] […]
It looks like the same service tier characteristics apply to both the vCore and MI model (Log throughput: 3 MB/s per vCore, Max 48 MB/s – equivalent to 16x vCores)
https://docs.microsoft.com/en-us/azure/sql-database/sql-database-managed-instance-resource-limits#service-tier-characteristics
Robert – that’s a documented limitation of Managed Instances, but not for Azure SQL DB. (They’re different products – I know it’s really confusing, hahaha.)
The SQL Server DB Engine is obviously the same behind both products, so if they max out the log throughput in the MI offering (even if you opt for >16 vCore instances), why would this be any different in the Single DB option? It’s also consistent with your findings and you’ll probably measure ~ 50MB/s disk throughput on the log disks if you decide to re-run these tests on both the 16 & 80 vCore instances (and ~25MB/s on the 8 vCore instance) 🙂
Robert – no, it’s not the same behind both products. You might be interested in this: https://www.brentozar.com/archive/2018/03/azure-sql-managed-instances-brain-dump-on-cpu-memory-ha-dr-and-backups/
OK, so if the [Microsoft SQL Server SQL Azure] DB engine is running on the MI instance, what is hosting the Single DB option? I most definitely don’t have your level of expertise in either SQL or Azure, I just can’t imagine that Microsoft would maintain different SQL DB engines for two such similar products, both based on the latest EE of SQL (https://docs.microsoft.com/en-us/azure/sql-database/sql-database-paas-vs-sql-server-iaas). So most probably the documented resource limit of the Log throughput has simply been omitted from the Single DB documentation, to encourage you to spend stupendous amounts of money on high-core instances 🙂
You’re overthinking this. The engine alone doesn’t dictate performance. Does the same SQLServr.exe perform the same on all hardware configs all over the world? Of course not.
This maybe a daft comment but would scaling out the number of data files in line with the cores work in this instance as it does with tempdb ? Then you may get better throughput with more parallel processing.
Elliot – you don’t control the number of data files in Azure SQL DB.
Very good find. Assuming it is an issue with artificial throttling, I would be curious to see if you hit the same limitations with hyperscale. That would be pretty awkward for Microsoft.
On-Prem 1
Cloud 0
Well, to be fair, the comparison 2-minute load I put in there is also the cloud (AWS EC2 VM), and frankly, that smokes most folks’ on-prem storage, hahaha.
If you are hitting the outstanding write I/O limit for the log it won’t matter how many cores you are using. Depending on the schema and workload it might be a good candidate to shard.
Richard – right, but read the whole post: Microsoft says the I/O limit goes up as you add cores, but it doesn’t. (That’s the entire premise of the post.)
And if we’re talking about 30 minutes to load 100GB of data, something you can do in 2 minutes with a regular server, I’d argue that isn’t a good sharding candidate. A USB thumb drive can perform faster than this. The architectural complexities and costs of sharding on USB thumb drives vastly outweigh the costs of just moving to something with faster storage.
A colleague of mind found this information about the log throttling on Managed Instance (MI). I’m thinking this is most likely the issue here as well. The log limit on MI Business Critical is described as “3 MB/s per vCore, MAX 48MB/s”. 48/3 = 16, so the wall is placed at 16 vCores. I believe they need to update their documentation on the linear relationship between IOPS and vCores as a result. This hard limit on the log is absurdly low.
https://docs.microsoft.com/en-us/azure/sql-database/sql-database-managed-instance-resource-limits#service-tier-characteristics
Pittsburgh DBA – yep, another reader mentioned that in the comments too. It’s entirely possible that it’s the same limit in Managed Instances, but if so, it isn’t documented – and yeah, I agree, that number is indeed absurdly low, lower-than-thumb-drive territory.
This makes you wonder what’s actually going on behind the scenes, how the *actual* back-end hardware that the databases are hosted on are configured, if that’s part of the problem.
As someone once said, “the cloud is just your information on other peoples’ computers” and you don’t have any say in how those computers are set up…
I’m not knocking the cloud, but it is something to be aware of. MS could flip a magic switch this weekend and all of a sudden the performance would start scaling like Brent expected. Or, Amazon could slow theirs down because giving the performance he saw is costing them more than they get paid from the customers using it…
104GB in 120 sec is ~866MB/sec… i assume that’s minimal logging in your lab environment, isn’t it?
Learner – it’s the magic of good ol’ flash storage. If you’ve got a laptop with PCIe NVMe storage, you can try the same experiment. Folks are often shocked at how fast modern laptops are versus cloud storage.
Yeah… but they have a major issue… they tend to break quite frequently, that’s probably why managed database services like Azure DB put in place synchronous replication mechanisms to prevent data loss. But you didn’t answer my question: was that SELECT INTO minimally logged? Because ~800MB/sec on log writes that cannot be parallelized seems quite a lot to me. And that would help understanding the problem here.
Learner – about the SSDs – that’s where RAID comes in.
About the minimally logged – why not give it a try yourself to find out? That’s why I use all open source stuff like the Stack Overflow database and I give you the exact commands I use right there in the post. You can try different variations on the experiment and see how it changes.
RAID won’t help when you’ll lose an entire node 🙂 and won’t even help in getting faster for a single threaded app.
I did try, to be honest, and even on a fast IO subsystem it’s hard to cross the 500MB/sec threshold, that’s why i was asking.
Assuming that there isn’t such a thing like minimal logging in a HADR environment, and between sync replication and continuous backup and moving backup files off node, i’m sure there’s a lot of machinery going on for preventing data loss so i think that comparisons with a lonely single instance is just not fair.
Don’t get me wrong, i fully agree that all this should be made explicit in documentation, but most comments here seems not considering these differences.
Learner – you’re assuming that all servers have synchronous HA protection, when in fact, a lot of systems that need to do high volume writes simply don’t. It’s fairly unusual to see synchronous mirrors for data warehouses, for example.
Comment system doesn’t let me to reply to the other thread anymore, so i’ll do here 🙂
Your comment on DW scenarios is spot on, but for Azure DB that HA behavior it’s actually documented (https://docs.microsoft.com/en-us/azure/sql-database/sql-database-high-availability#premium-and-business-critical-service-tier-availability). Maybe, to fix the scenario you’re referring to, one approach could be to provide a way to “pause” the HA mechanism during high volume writes and enable minimal logging. That would be a great improvement 🙂
Learner – yep, but my bigger concern is the one I wrote the post about: IO not scaling the way the documentation says it will. Thanks though for the great discussion!
[…] you are using Azure SQL Databases, you should definitely read this post by Brent Ozar: There’s a bottleneck in Azure SQL DB storage throughput. The bottom line: the transaction log throughput currently appears to bottleneck at 16 […]
[…] There’s a bottleneck in Azure SQL DB storage throughput. […]
I think it’s a documented limitation of Azure SQL Database too! https://docs.microsoft.com/en-us/azure/sql-database/sql-database-resource-limits-database-server
“Transaction log generation rates currently scale linearly up to a point that is hardware dependent, with the maximum log rate allowed being 48 MB/s with the vCore purchasing model.”
Also, in the documentation you cite, https://docs.microsoft.com/en-us/azure/sql-database/sql-database-vcore-resource-limits-single-databases
You can see the log IO rate and IOPS. So, the IOPS might scale linearly, but raw throughput in MB is clearly rate limited for all instance sizes to a max of 48 MB/s.
Heh – it’s documented NOW. Microsoft contacted me after this post went live and said yep, it was an undocumented cap on log write throughput. You can see the change history for that documentation page here:
https://github.com/MicrosoftDocs/azure-docs/commits/cd21290c452164042602f122eb354cf47b67c333/articles/sql-database/sql-database-resource-limits-database-server.md
I guess a better question would be, if you want to do huge data loads in Azure SQL, is it possible to just manually turn off all the logging for a specific data load/ETL job, so you don’t hit that bottleneck? Worst case, something goes wrong, you just have to start the nightly load over again.
This is new
https://blogs.msdn.microsoft.com/sqlserverstorageengine/2019/03/11/identify-log-write-limits-on-azure-sql-managed-instance-using-qpi-library/
What parameters are there in the DDL to create the database PRIMARY files and the LOG files? Does the Growth Rate and the Initial Size have any parameters. I recall there being some comments in cyberspace that the server sometimes gets caught up not actually writing log entries into the LDF, but rather gets caught allocating more pages for the log in the file. I seem to recall that there are metrics in design the Log which take into consideration the maximum size it will ever be, thereby preventing any GROWTH cycle requirements. I am not sure if any of that analysis applies in SQL Azure Database.
Robert – sure, if you can figure out how to set that in Azure SQL Database, let me know.
Also, I seem to recall that the transaction log has a specific algorithm used to write the log entries, somewhat controlled by a database setting called RECOVERY model. I presume SELECT INTO is minimally logged, so maybe that RECOVERY makes no whit of difference. Brent?
FYI – we’ve also added a new section here to talk about log governance: https://docs.microsoft.com/en-us/azure/sql-database/sql-database-resource-limits-database-server#transaction-log-rate-governance
Devin – thanks! Hmm, it seems to have an error in it though – it says there’s a maximum 48 MB/s log rate, but that’s not what this document says:
https://docs.microsoft.com/en-us/azure/sql-database/sql-database-vcore-resource-limits-single-databases
The latter shows 96 MB/s log rates for Business Critical. I created this Github issue to track the disagreement: https://github.com/MicrosoftDocs/azure-docs/issues/29675
[…] Good thing: Issue can be solved since we were hitting the transaction log rate limit… This was also documented by Brent Ozar -> (https://www.brentozar.com/archive/2019/02/theres-a-bottleneck-in-azure-sql-db-storage-throughput/). […]
I wonder if MSFT has somewhat similar limits in Azure Data Warehouse. Hopefully not, since no AG underneath and no continuous log backup running. I have to do more research how ADW logging works.
I don’t know when the documentation was updated, but the max log rate in MBps is now documented: https://docs.microsoft.com/en-us/azure/azure-sql/database/resource-limits-vcore-single-databases. It is actually 96 MBps (for Gen5) and 64 MBps (for Gen4). So the 48 MBps achieved with that example is half of what’s expected, but that might have changed in the last year.
Just to make sure that I understand your point regarding the AWS custom installation, you are saying that installing SQL on a 2 core VM got the same performance?
Dan – almost, but reread that section again. The AWS VM was 8 cores, and it didn’t get the same performance. It smoked Azure.
It did but… were you using instance storage of that i3.2xlarge or it had EBS storage attached?
If that was an instance storage then of course it smoked Azure PaaS offering as it was local NVMe drive. But this is ephemeral storage.
In such case you should compare to Azure’s Standard_L8as_v3 VM, it also has 8 vCPU and 1.92TB of local NVMe with documented perf of 2Gbps throughput and 400k IOPS.
If that was just an i3.2xlarge with instance storage it’s like comparing apples to oranges.
Kamil – we’re already comparing PaaS vs IaaS. If you’d like to compare against a different IaaS, you’re welcome to do that. (If you’re suggesting Azure SQL DB lets you choose an L8as_v3 VM, then I think you’re misled.)
You’re right, Azure SQL doesn’t let me choose VMs with NVMe.
But I think the same goes for the Amazon RDS and it doesn’t let me choose i3.2xl instance, right?
That’s why I initially asked whether during your tests you used instance storage on this i3.2xl or EBS storage.
I just think saying AWS VM smoked Azure is a little bit inaccurate without wider context. As this perf comparison is indeed interesting but it really just compares too different things.
Kamil – reread the title of the post. This post isn’t about comparing different providers. This post is about the bottleneck in Azure SQL DB storage throughput. I only mentioned the AWS VM throughput so readers could have a comparison in numbers.
If it helps you digest the post, feel free to print it out, mark out that one sentence of the post in a black marker, and then read it at your leisure.
Sure, I understand what the post is about and understand that perf of AWS VM was just for a reference what might be achieved with similar size VM.
I was referring just to your answer to Dan, as I think someone without experience might think AWS SQL is several times faster than Azure SQL on the same size VM 😉
But, maybe it’s just me who get your answer wrong 🙂 Anyway, thanks for interesting article and discussion.
The comment about tempdb in https://docs.microsoft.com/en-us/azure/azure-sql/database/resource-limits-vcore-single-databases seems a useful work around for some processes. Also, clustered columnstores log 30% or so of row stores from trials I conducted.
Which comment? I don’t see any on that page.
Brent, This is great article and finding. Now, look forward to seeing your update after the SQL Server’s new announcement below. [Link removed]
Joshua – sure, go check out the numbers and see if they beat a USB3 thumb drive yet. I’ll wait.
Killing Cloud Adoption
One IOPS at a time
You are a A Saucerful of Secrets.
This post is still valid on December 2022: I’ve seen it with my eyes today on our environment.
Fun fact: yesterday came out Business Critical Azure SQL DB servers 128-cores…. this article might apply also to that?
Brent – first awesome blog and fascinating articles so thank you for that. Now my question if you can help. I am trying to find a relatively simple way to determine write throughput IOPS for a azure sql db. a.) is this possible?, b.) how can i perform this relatively easily? c.) finally, if you are not sure, can you or anyone please point me in the correct direction to determine these? I’m blown away that it is not so easy to find as for most DBs and ingestion of data this is critical to data load times.
You’re welcome, glad you enjoy ’em.
What specifically do you need write IOPs for?
Hello Brent
Great article. In our case, the problem is that scaling from 32vCores to 80vCores actually has a negative impact on performance. Any ideas ?
Sure, plenty of ’em! Click Consulting at the top of the site and I’d be glad to help.
Hello Brent could you help me?, we have elastic pool on hyperscale, scaled to Max vcores 12 ok? and on each db we select 10 vcores Max. All ok, bur when we select cpu_limit on sys.resource_stats some db’s have 10 vcores and some 8 vcores,
Could you help me ? any idea?
Thanks.
Gustavo
Hi! For personal help on production systems, feel free to click Consulting at the top of the page. Thanks!
[…] are inherent. As the Brent Ozar test showed, beyond a point “storage is the limit”?brentozar.com, so simply adding CPU or memory yields no further speedup. Cloud platforms have documented service […]