Why Is This Query Sometimes Fast and Sometimes Slow?
You swear you didn’t change anything, but all of a sudden the SQL Server is going doggone slow. What happened?
Parameter sniffing might be the problem, and to explain it, let’s see how it works. I’m going to use the StackOverflow database – particularly, the Users table that I demo in How to Think Like the Engine. I’m going to add an index on the Reputation field:
Transact-SQL
|
1 |
CREATE INDEX IX_Reputation ON dbo.Users(Reputation); |
That index is ONLY on the Reputation field – so it can be used for this below query, but it’s not a fully covering index:
Transact-SQL
|
1 |
SELECT * FROM dbo.Users WHERE Reputation = 2; |
That query finds all of the data for users whose Reputation score = 2. There’s not a lot of folks in the Stack database that match – the default Reputation score is 1, and people either stay there, or they start working their way up the charts.
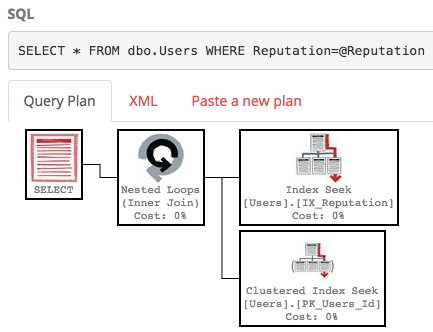
Here’s what the query plan looks like:

SQL Server does an index seek on our IX_Reputation index to find the 5,305 rows that match, then does a key lookup to get the SELECT * part (because the index doesn’t cover all those fields.) Look at the execution plan, hover your mouse over the index seek, and you’ll see that SQL Server expected 5,305 rows – and 5,305 actually came back. Awesome.
Now let’s try that query looking for Reputation = 1:

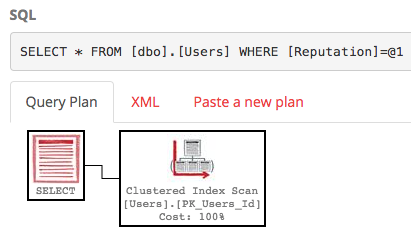
Note that even though SQL Server auto-parameterized the query (that’s the @1 part at the top), SQL Server chose a different execution plan. This time, the actual plan shows that SQL Server expected 3mm rows to come back – so here, it makes more sense to do a clustered index scan rather than first make a list of the users that match, then do 3mm key lookups to get the SELECT * part. SQL Server is using our index’s statistics to guess how many rows will come back. (You can learn more about that in our statistics course.)
The same query can produce 2 different plans with 2 different parameters.
(More complex queries can even produce more different plans than that.)
Let’s put it in a stored procedure and see what happens.
This stored procedure is pretty simple:
Transact-SQL
|
1 2 3 4 5 |
CREATE PROCEDURE dbo.UsersByReputation @Reputation int AS SELECT * FROM dbo.Users WHERE Reputation=@Reputation; GO |
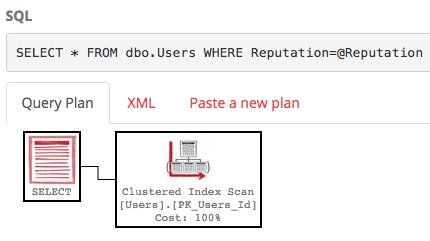
Run it with @Reputation = 1, and you get the clustered index scan:

Then run it with @Reputation = 2, and you get…wait a minute…

You get the execution plan from the first pass. That’s because SQL Server caches stored procedure execution plans – it builds a plan for the first set of parameters that happen to get passed in when the plan needs to be built, then caches that same plan to reuse over and over. The plan will stay in cache until you reboot Windows, restart the SQL Server service, rebuild indexes, update statistics, run DBCC SHOW_STATISTICS, etc.
Here, that’s not such a big deal. I know, you see clustered index scan, and you think performance is bad – but it’s not really that big of a deal:
- @Reputation = 1 with index scan – does about 80k logical reads, takes about 30 seconds (but mostly because SSMS has to render 3mm rows)
- @Reputation = 2 with index scan – does about 80k logical reads, takes about a second (because there’s only 5305 rows)
If you look at the actual plan for @Reputation 2 here, and hover your mouse over the Clustered Index Scan operator, you’ll notice that SQL Server doesn’t just save the plan – it also saves the estimates. We’re expecting 3.3mm rows to come back here – even though only 5,305 do. Who cares, though? Overestimating is awesome, right?
But then something goes wrong.
Somebody:
- Restarts Windows
- Restarts the SQL Server service
- Frees the procedure cache
- Puts the server under memory pressure (thereby pushing this plan out of cache)
- Doesn’t run the query for a while
- Rebuilds indexes on the Users table
- Updates statistics on the Users table
And somehow the execution sequence is reversed. First, we run it for @Reputation = 2:

We get an execution plan beautifully designed for tiny amounts of data. Hover your mouse over the index seek, and you’ll see that SQL Server accurately expects that only 5,305 rows will be returned. With the index seek, we only do 16,268 logical reads – even less than before! Great! Now that plan is in the cache.
You can hear the train coming. Let’s run it for @Reputation = 1:

SQL Server uses the cached execution plan, but it’s ugly, which means:
- We do an index seek, plus 3.3mm key lookups
- We do a staggering 10,046,742 logical reads (up from 80k) due to those repeated key lookups
- We only estimate 5,305 rows will come back, which means if we had added joins or sorts in this query, they would have spilled to disk
- We can’t see the terrible awfulness in the plan cache, which only shows estimates, not actuals
This is parameter sniffing.
 SQL Server builds one execution plan, and caches it as long as possible, reusing it for executions no matter what parameters you pass in.
The next steps on your learning journey:
- My Fundamentals of Parameter Sniffing class – 1-day class with hands-on labs where you not only learn what causes parameter sniffing, but have to build your own queries that will cause parameter sniffing to really prove that you’re nailing it.
- How to Start Troubleshooting Parameter Sniffing – how to grab the bad plan and get around the emergency.
- Slow in the Application, Fast in SSMS? Erland Sommarskog’s epic article covering much more details.
- Recompile Hints and Plan Caching – if you choose to use hints the wrong way, they have a drawback.
- Stabilizing Execution Plans with Guides – the combination of a plan guide and the NORECOMPUTE hint can help.
- Mastering Parameter Sniffing class – when you’ve conquered the fundamentals, my 3-day hands-on class will teach you how to build a database that’s less susceptible to parameter sniffing, understand why SQL Server 2017 and 2019 work against you, and react faster and more confidently when it strikes.
Related

Hi! I’m Brent Ozar.
I make Microsoft SQL Server go faster. I love teaching, travel, cars, and laughing. I’m based out of Las Vegas. He/him. I teach SQL Server training classes, or if you haven’t got time for the pain, I’m available for consulting too.
Get Free SQL Stuff
"*" indicates required fields

11 Comments. Leave new
“The same query can produce 2 different plans with 2 different parameters.”
I think you mean parameter values.
Parameters… The case in which one of either is supplied…
As always a great article explaining why a query plan can be good or bad depending on the parameter values passed to the SQL Server Query Optimizer and what is stored in the Plan Cache.
But how do you fix a query that isn’t your own? And ever worse: How do you repair program code that creates statements based on the objects in the application form, based on the 4GL used for programming the application?
Most of the time when I passed on information regarding (external) code I would get a pat on the back and a “Sorry, but we can’t fix that, because we would have to redesign our whole application and that is going to take 2 years to rewrite” Another favourite is “But Microsoft recommends to use table variables.” and a hint to an old SQL Server 2000 article.
My all time favourite however is program code migrated from using an Oracle RDMBS using the old recommendation that in order to update a child in a tree (well root) hierarchy, you have to lock the parent object to ensure integrity (SELECT WITH LOCK HINT on parent table, until UPDATE/INSERT has been completed on child table). Try and explain to the vendor that there are in fact new ways of achieving integrity without locking the parent tables. (BTW, didn’t work)
It’s pretty frustrating as to the point of just giving up and letting vendors do want they want. This normally means letting them create indexes and workarounds until the database just chokes to death and the vendor then requests more hardware, because “your hardware is nor performing well.”
However, I am always willing to give each vendor a first summary of performance issues regarding their database, using the tools provided by Brent Ozar’s team and others, before I leave them to it.
In a perfect world you would be able to modify everything. In an even more perfect world, SQL Server would realize the database design is bad or the queries vary and would optimize accordingly. (Multiple Query Plans anybody?)
Thanks Brent,
Good article. However, did I miss how you avoid this in the future? Some rule of thumb or something?
Or do I need to read your follow on articles?
Thanks,
Jack
Jack – the post finishes up with a set of links “The next steps on your learning journey:” – those are the next places for you to read as you learn. Enjoy!
You could see it as a database design issue – but that may not be helpful. There’s nothing precisely wrong with the data, although – as Brent says – in this case Reputation starts at 1 and either counts up or doesn’t, so “where Reputation = 2” is rather an odd condition to use. But in a completely different database scenario, queries equivalent to “Reputation = 1” and “Reputation = 2” could both be reasonable to use. Or… there may be a community of smart people who use Stack Overflow once and don’t come back, but would be good citizens to have in the community. So you want to reach out to them especially, and invite them back.
So… you could write one version of the query with different syntax from the other, so that the server doesn’t recognize that they only differ by parameterization. Ugly, though.
Thanks for this article. I have sort of the opposite problem of what is described here. When I run my query with “where client = ‘Customer1’ ” it comes back in seconds. When I run the query with “where client = ‘Customer2’ ” it takes like an hour! I put it in a stored proc and ran it immediately with Customer1 and it came back in seconds (as expected). Then I ran the stored proc again with Customer2 (which took forever originally) and it came back in seconds! So, clearly the execution plan used with Customer1 is the one I want the server to use when searching on Customer2. I’m not sure how to go about fixing this though.
Sounds like it’s time to check out my Fundamentals of Query Tuning class! You’re just in time: this is Fundamentals Week, and you can buy a ticket here. https://training.brentozar.com/p/fundamentals-week
I wish I had the time to take your class right now. I’m bookmarking your page so I can hopefully enroll in the future. Thanks!
Don’t have the time to actually learn what you’re doing, got it. 😉
OK – that’s a low blow! 🙂