
Screenshot Interview Question: “What would you do if you saw this?”
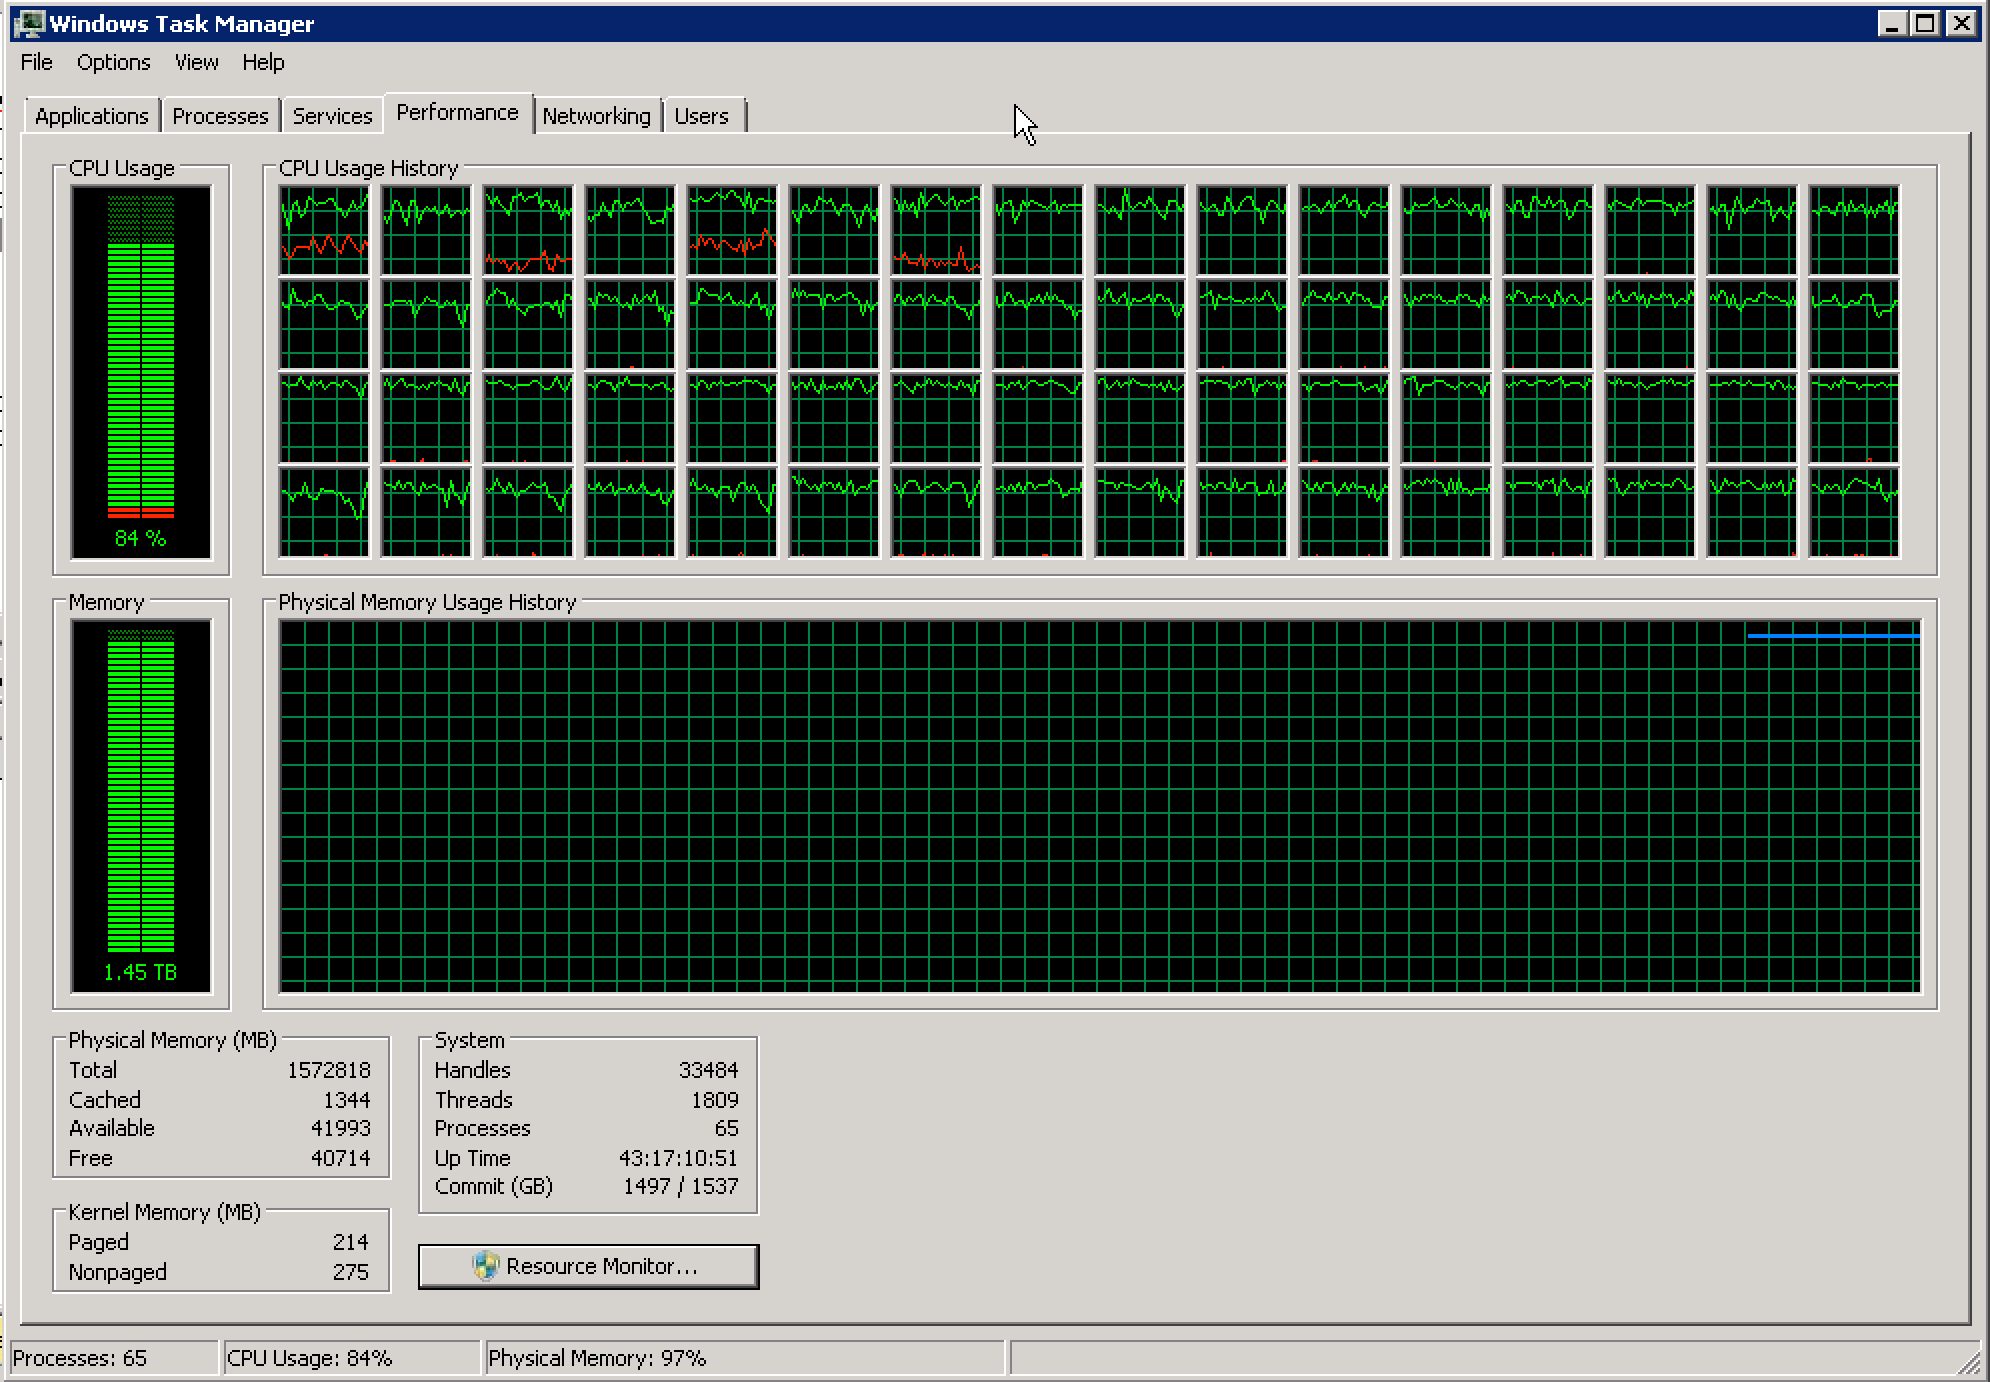
In this week’s episode of our screenshot interview series, you’re applying for a database professional position who will be on call. You’re not necessarily the DBA, but you’re a member of the team on rotation. While you’re on call, you get an email from the help desk asking if there’s a problem on the production data warehouse server, and they attach this screenshot:
- What do you tell the help desk?
- What actions do you take next?
You can leave your answers in the comments, and I’ll circle back in a few days to talk about my thoughts.
Update 2016/07/10 – Great answers, everybody! So many good answers this week. I shouldn’t have been surprised – you folks are exactly the kinds of people who do this for a living, and you’re used to getting woken up on call, I bet.
For the first question, what I tell the help desk, I’d reply with an email that:
- Ask what drove the call (were they just responding to an automated alert, or had end users called in reporting speed problems?)
- Ask how long it’s looked like this (was it only a 60-second spike, or a 60-minute spike)
- Ask if they have a baseline of what’s normal for this server at this day/time (maybe it’s normally 80%, so we’re only looking at an incrementally higher load)
- Ask if there were any change control activities scheduled for this box or related boxes tonight (like maybe the data warehouse team is reloading 5 years worth of history)
- Ask if there are any other boxes that are experiencing issues (maybe the SSIS box has high CPU too, indicating that there might be a big load going on)
After all, they only emailed me, not call me. Might just be an FYI.
And what do I do? I’d go back to bed. I’m on call, not on email. If you need me, call me.

62 Comments. Leave new
I don’t think it’s that easy.
See, if I was on rotation, I should know a little of expected loads. You would never accept a system as critical as a DW under your responsibility, that you know nothing about.
Therefore, should I assume this is an unusual load?
From what is given I know only 2 things. It’s a DW, and it’s banging on all cylinders. That’s pretty much what a DW is supposed to do, right? Running its tasks with all given hardware resources to get it done asap?
Let’s assume this is an unusual load. After all the helpdesk wouldn’t call me if it wasn’t unusual.
Let’s further assume I was dumb enough to accept the call rotation without knowing anything about the DW server in advance.
I’d still never touch the server. I’d rally up the forces. Call the usual 9to5 DBO/DBA, yes even on the weekends. And it would be my responsibility NOT to touch it, but to coordinate the troops.
We were hit by something similar to this a few years back, but on a Four Core Test DEV Server. HUGE difference between our scenario and a Production Server. Anyhow, here goes my ‘gut’ feeling. (and I have not read other peoples thoughts yet)
My first thought is Why on earth can help desk, or anyone, remote to an SQL Server. Especially a Production Server! “What do I tell the Help Desk”? : Get the heck Off of the Server! In future I think we would appreciate being informed of an ‘possible issue’ without others complicating things even further by remotely connecting to it. Note to self: Un-tick that check box to allow remote connection and talk to the SCCM boys to ensure they are not overriding these settings!
What do I do next?
1. Task Manager Lies. At the very least, it tells me nothing about what is causing the issue. Was this issue caused by SQL Server or, seeing that Help Desk can remote to the server, a process outside of the SQL Server. I need to find out the Cause of the high CPU.
SQL retains historical data about the CPU usage, so I can look at that in the first instance – and find out if it was / is SQL using the CPU or not.
If it is SQL Server utilizing the CPU, I’d make use of my Resource Monitoring Tools to inspect both Kernal and User Mode of the CPU. From memory Kernal Mode it’s something along the lines of ‘Privileged Time’ where >30% could indicate Antivirus and / or driver issues (cant remember if this includes HDD issues also). User Mode is ‘User Time’ showing if something is consuming SQL Server (as in an SQL action).
If it is not the SQL Server, Oh boy things can get interesting very fast. but this comment is becoming way too long.
Addendum:
‘Think Fast’?! How about, follow a pre-defined strategy / process in a calm, collected, methodological way. This method would allow you to quickly, easily and in an approved method identify appropriate actions to take on the SQL server, and to provide appropriate feedback.
I will ask how you manage to take a screenshot from my laptop 🙂
I would probably tell the help desk to first check the processes tab / resource monitor to see what processes are using the ram + cpu. Just because “something” is pegging cpu, doesn’t immediately mean SQL is doing it. It could be another process. Would also check the max memory settings in SQL to see what we have set. Again, it could be something else causing memory pressure.
i will use a light weight PSSDIAG. I will configure such that i capture CPU and memory counters as described in my blog:
https://sqlserver911.wordpress.com/2012/07/03/performance-problem-sql-server-slow-or-query-slow-pssdiag-is-there-for-the-rescue/
It depends! 🙂
Process of exclusion to rule out memory hungry applications and any outside SQL allocated resource CLR, then look to the currently running tasks within the sql instance/s and resources as DW server could have ETL loads or cleansing massive data loads maxing out either way that’s some box 😉
Well, the red lines are curious. 🙂
60 cores, 1800+ threads, and we’re seeing some red lines (kernel processes) w/ steady CPU between 20-50% on 4 cores. I can see a little red an another 12 cores or so, so I don’t think the curious kernel processes are locked to a set of CPUs via CPU affinity. It’s hard to tell from this what the issue actually is, but my gut is leaning towards an issue with storage that’s causing a handful of kernel processes to block on (or re-read/attempt to correct) bad sectors.
Better check the status of the SAN and see if there are degraded drives.
I really like Peter’s answer. I would however take that line of thought further before calling the 9-to-5 guys. First response back to the help desk should be a question to clarify what caused the ticket to get raised.
If it was internally generated by automated monitoring that knows for a fact that we’re way above our baselines, it’s probably a biggie. But the person who took the screen shot may very well be trying to find a link between the perf counters and the fact that one (important?) user running one report is shouting at her.
Nothing in the given scenario makes it clear that there is a problem, and the onus seems to be on me to prove that there isn’t one. Let’s start by checking what the patient is truly complaining about.
I agree … nothing points to an issue except that you got called which could be an erroneous call – not all calls are due to real issues. I’d also agree that knowing how your systems usually behave (performance baseline) would be an important part of being an on-call DBA. So in summary – not much paging compared to physical RAM, not a huge volume of processes/threads and CPU still has some head room, Kernel CPU usage is moderate on 4 cores primarily – I would say there are no indications of an issue based on this screenshot alone and if there are no client reported issues or synthetic user transaction simulation issues then it is likely there is no problem.
I would point out that the server has an uptime of 43 days 17 hours … and my suggestion would be to implement monthly windows OS patching (which includes a post-install reboot) to apply the latest windows updates.
I will try to look at what quries are running. Infinite loops may also hike cpu much.
if youve got infinite loops in your queries, then i think its fair to say you’re doing it very, very wrong.
Peter and J had already given the best answers…
Only with this screenshot… it can tell you everything and nothing.
Might be a normal DWH Workload… or a loop
I believe there’s only one question to be asked right away:
Have you tried turning it off and on again? 😉
1. Tell them there is no issue, alerting would notify if there was. (but still run diag scripts to verify)
2. Find out how they got server access and remove it!
I’d ask how you convinced management to spend that much on hardware
Hello.
This is IT department. Have you tried turning it off and on again?
Hello! IT! Have you tried turning it off and on again? 🙂
1. Check the Processes tab to see if it is in fact sqlserver spiking the CPU Usage.
2. As Peter said, speak to 9-5 guys to confirm if this is normal behavior.
There is still a good 40K MB free but the CPU usage should raise concern.
First things first. let’s compare it with baseline.
I’d be really concerned if that was close to or even aligned with the baseline performance
check global wait statistics (use the Randal script), SOS_SHEDULER_YIELD?, CXPACKET? THREADPOOL? etc.
check sys.configurations for global server settings like MAXDOP, cost threshold for parallelism, max workers, memory config etc.
check the system_health XE trace files and even run sp_server_diagnostics
use the Resource Monitor button to see what else is going on on this server, processes (AV? external processes? etc.)
This is a DWH so there is chance that there is massive parallelism going on 🙂 that’s why
Sp_blitzfirst has the same capability, but if this server is as busy as the screens hot indicates you might cause more issues than you resolve running things. Check your monitoring software (also a good question when interviewing IMHO)
Hi folks. Lots of interesting thoughts.
I don’t usually chime in as the interviewer this early, but I might politely follow up with – did you read the actual questions?
And if so, do you feel that you answered those questions?
to helpdesk: we are checking up on our monitoring data (we have a monitoring solution in place, right? :)) and see if there is an outstanding activity of concern on that server, comparing with the screenshot info too
what to do next: check up on the actual server per my above comments, plus checking up on our monitoring data, compare with baselines and historical data plus trends
1) How about “what’s the problem?”
2) Depends on answer to 1.
all troubleshooting effort indeed starts with the so called scoping phase, where we clarify what the actual problem is, what do you experience exactly, getting any errors/exceptions, if talking about performance problems or slowness, pls define that first in your own words, whether the problem is consistent or intermittent, if the latter what the frequency is etc….indeed we could ask the helpdesk all these, what made you create that particular screenshot in the first place it might be that the actual problem that the end-users experience is totally irrelevant to the screenshot sent to us and the entire troubleshooting effort is then misguided, so let’s clarify the exact problem first, the circumstances that triggered that screenshot and then discuss what we are seeing both in the screenshot and on the server itself
To the help desk: “Thank you for letting me know. I appreciate the screenshot! Can you please tell me what first alerted you to the issue?”
These questions will drive my next steps. I am deliberately keeping the questions pretty open ended at this point, because I want them to tell me what they were seeing without me prompting the answers. Specifically, to begin with, I want to know if this is something they noticed on their own, or if they received a phone call that there was trouble. If there was a phone call, I would like to talk to the original caller myself. I want to know if this is a new or recurring issue. I also want to know how long they have been struggling with it. Maybe it’s a new report that just went into production and is being used for the first time, driving the server to its knees. Perhaps this is “normal”. It could be a number of things, but this is where the diagnostic process begins for me. I want the most objective information I can get, then I can begin drilling down and seeing where the issue is.
To help desk: Thank you for letting us know. Did a customer alert you to this or the monitoring software?
Are any customers experiencing issues getting reports or data out of the DW?
Are you aware of any other applications that are running on this server that can be taking up processing time? ( We have notorious monitoring software that can eat CPU if set incorrectly. )
How long has the system been like this? Is it steady or up and down? How long?
What do I do?
I would check the Processes Tab to see if anything else is running and taking up CPU cycles.
I would also check to see what users are connected to the system.
I would then check the SQL server to see if any jobs are running or running away.
I would run SP_WHO2 to see if anyone is running a query against it that is taking up cycles.
I would also check for blocks / locks that might be backing things up.
That information should give me decent direction to move forward.
I forgot to mention I’d would talk to the help desk over the phone and not send emails back and forth. Much quicker resolution if I talk to someone.
I ask the help desk, why do you think there is a possible problem with the DW? What are you or the end users experiencing that leads you to believe there is an issue with the DW? If the end users have reported an issue to you, have you been able to duplicate the issue?
Personal question, what time of day is this screenshot taken from?
Also, the memory utilization does not concern me, but the CPU usage could.
1) Have help desk open and incident ticket and assign to appropriate team.
2) Determine business impact and evaluate necessary response to established SLA (who are we kidding…we don’t have an established SLA and no one ever talks to the business side).
3) Have operations open a bridge call and have ALL IT on call resources and managers join.
4) Managers huff and puff and ask if we need vendor\Microsoft on the line.
5) Eventually bad process dies or DBA kills blocking session.
6) Managers ask how we monitor for this and\or prevent in the future.
Good job.
They’ve asked me if there is a problem with the server.
In reply I may ask them :
– When was that screenshot taken?
– Has anyone reported any issues?
– Which Jobs are running on the server? (provided they have been given a script to grab this info I’d presume it is just part of the overnight load suite).
but in reality, if it is my job to investigate it as an on-call bloke, I would probably be kind …
1) What do you tell the help desk? – “it’s probably just the ETL processes but I’ll dial in and take a look”
2) What actions do you take next? – Dial in and take a look
If it is not a server I have experience of and I am unsure then I may quickly run it by someone who knows the server and typical loads.
At the end of the day, it is a production server and the business will be wanting the data and reports available for the next morning, so best to spend 20 minutes to check it out and get a good night’s sleep rather than just guessing and lying awake worrying about it for the rest of the night.
With only this screenshot attached, I would say that system (presuming SQL Server) is using CPUs the customer paid for.
After this inevitable thought, I would play with sp_Whoisactive to check running queries especially those who are using many CPU time
To help desk: This looks like it could be a problem, but I cannot evaluate with out some more information. If you were alerted to this issue by a breaking problem, please describe it for me and let me know the time and duration of the issue. you may need to call to guide them through getting that info. depends on how good your help desk is.
Next steps: Any process – even scheduled jobs – running on a customer facing server that would cause this type of utilization need attention. The first step would be to evaluate the seriousness of the impact and the source of the utilization. You probably do not want to wait for the help desk to get back to you. Run a smoke test and check yourself to see what is broken and what is working. You then have three options:
1. If the impact is blocking and there is an SLA that does not allow it, you need to find the most graceful fix. That might mean stopping an ETL job, it might mean ending someone’s session, it might mean killing the anti-virus program. In any case its probably going to be messy and you will have to follow up with the repercussions of your actions and why you took them.
2. If everything is working fine now and the process ended, you need to do some forensic work to find out what caused that utilization and what the business impact was by checking your monitoring solution and your logs.
3. If everything is working fine and the utilization is still high (go high five the team that made that happen!), do nothing on the server but confirm the source of the utilization.
In all three cases go through whatever business escalation process is appropriate for that severity and get this to the team that owns the problem. If this matches the baseline it is still an issue. If this is a result of a job or one off report, You’ll want to weigh the criticality of that report availability vs availability of everything else on that server. Maybe that report is the only thing that runs on the server. If you don’t know then you need to find out. (and then find out why you don’t know. Documentation?)
Umm… Why is a member of the helpdesk able to access anything Windows OS related the server (I’m SURE they’re totally qualified ) and how can that access be revoked? Sounds like it may be time to follow-up with their manager about the bounds of their job duties. If those numbers are dangerous and you can afford that beefy of a server, then purchase a good monitoring software. It should send email alerts to the helpdesk software/employees so they can page/call the on call person, or even setup email to text alerts to your cell.
I also wondered why the help desk had that level of access to SQL Server, but kept my mouth shut on that point when I should have mentioned it. Good call.
What do you tell the help desk?
Are you seeing any actual problems, or are you worried about the CPU/Memory utilization?
What actions do you take next?
If we’re seeing actual problems occurring, start investing the issue. If there was no real problem to begin with, go back to sleep.
What do you tell the help desk?
Thanks, how did you notice the problem? Did someone contact you?
This is to determine if there is a problem visible to the user that prompted them to investigate which might point to a root cause. If someone was impacted, I’d talk to them directly to see what they were doing.
What actions do you take next?
Depends on the time of day. I’ll assume it’s after working hours, or I’d ask someone.
I’d run sp_who2 to see if one query is simply being massively parallel or something else might be wrong. If it’s more than one query active with others backed up, I’d call the 9 to 5 DBA. If it’s one query, I’d check how long the query had been running and check back in an hour. After the hour, I’d see if it was associated to any jobs that were running and see where the connection was coming from. I don’t consider 100% CPU usage exceptional behavior for a medium sized DW doing nightly imports/processing, I consider that working as designed.
Ralph
I agree with Nick Molyneux. Brian Williamson explained better a good scenario. However, the customer is a worried human being from help desk that is watching an extraordinary event in the labor. It can be tackled with this approach:
1. Yes, indeed, it was a problem with respect to the Operating System server machine.
2. If the above values have unusual values, the next actions are:
2.1. Check the SQL Server process of the current instance(s).
2.2. If values from 2.1 have some higher values than to the baseline performance values:
2.2.1 Check the counters that indicate most common causes for processor pressure (e.g. Batch Requests/sec, SQL Compilations/sec, and SQL Recompilations/sec).
2.2.2. Check Memory counters (e.g. Pages/sec).
“Whatever be the result, Business side needs answers and continuity”.
Editorial comment:
Trying not to read everyone’s response before answering. Couldn’t help it though, saw a few that were good…
This might be a question that would be better served to showcase your soft skills rather than getting super specific, since we know next to nothing about what the supposed problem is.
The screen shot provided and the lack of details smell like possible red herring to me, and I’ve been tossed so many red herrings in my career that I’ve been trained to start barking and clapping like a Pavlovian seal when I get an email like this.
My job here is not to jump to conclusions, get more information so I don’t spend a lot of time answering a bunch of questions that weren’t asked. Possible education moment for the help desk person to understand why high CPU usage is not always a bad thing. Either way this one looks like a situation that requires communication skills as much as technical skills.
End Editorial comment.
Ok, we’ve got a screenshot showing the performance tab of the Task Manager. Looks like the CPUs have been chugging away at 80ish percent for as long as the little graphs shows. Also, I notice a squiggly red line on a few of the CPU graphs, I am not familiar with what that red line means. I’d like to run it through google to see if I can learn what that means.
Next thing I’d do is craft an email to the help desk stating that I’m currently not aware of any issues(assuming that is the case), but I am logging in to the server to have a look. Also, I have a few questions like: What specifically is going on? Is there a ticket? Clients complaining? Anything else you can tell me that might help troubleshooting?
Meanwhile, I would log onto the server to give it a quick once over while awaiting their response. I wouldn’t dig too deep unless something really jumped out at me. It would be a quick look in the task manager to see exactly which processes are using CPU, and I’d pop open the management studio to have a look at what jobs are running, and peek at the activity monitor to see what the current health of the SQL server looks like, waiting tasks, blocks etc. That way by the time I get to talk with help desk I would have had eyes on the server and would have either seen a very obvious problem, or maybe I still couldn’t see anything wrong and need more information from them. I’ve invested a few minutes of my time before talking with them and that shows I am engaged in the health of our systems and responsive to their concerns.
If I hadn’t heard back from the help desk by now, I would call the person directly. While talking to the person from help desk I would have to decide what research steps happen next if any, or if I just thank them for noticing the CPU and explain why that was OK at that time of day – like data loads, 3rd party backups running or whatever.
Answer to Helpdesk:
No, no problem. We only need a bigger machine.
Run this and send me a screenshot:
SELECT p.spid ‘Process’ ,
p.blocked ‘BlkBy’ ,
p.status ‘Status’ ,
p.waittime ‘WaitTime’ ,
p.cpu ‘CPU’ ,
p.lastwaittype ‘WaitType’ ,
p.hostname ‘Host’ ,
db.name ‘Database’ ,
p.loginame ‘User’ ,
p.program_name ‘Program’ ,
ca.sql ‘SQL’
FROM sys.sysprocesses p
JOIN sys.databases db ON p.dbid = db.database_id
CROSS APPLY ( SELECT text ‘sql’
FROM sys.fn_get_sql(p.sql_handle)
) ca
WHERE spid > 50
AND p.Status IN ( ‘running’, ‘runnable’, ‘suspended’ )
OR (spid IN (SELECT p.blocked FROM sys.sysprocesses p))
ORDER BY p.waittime desc
As an interview question is an interesting one, the screenshot raised several questions which wouldn’t be able to be raised ran my in many week work environments.
1. Screen shot from task manager…. What are they doing remote desktoped into the production server.
This leads me to point 2, would want to see the process tab of that screenshot, if help desk had remote desktop, who knows what else is running on there… (and if it was an interview you might have that available as a followup screenshot)
2. Assuming that the ‘data warehouse’ server is just database, (and not SSIS /other non database etl process) then the followup questions are what queries are running (sp_who is active), how long has it been like this (hopefully logged) is it normal, ie, could that end of financial year data Mart rebuild just have a few expensive parallel sort /aggregate queries running, and it will clear up on 2 hours?
(probable transition to query /index diagnosis as discussed in previous questions.)
3. What’s the impact? Sql server with that many cores can balance a few different queries.
4. Congratulations on having a warehouse that isn’t io bound, what’s the hardware?
1. I wouldn’t “tell” the help desk anything. I’d start asking the help desk lots of questions like: Why are you calling me. Not to be a smarta$$, but it’s important to know what caused the escalation. A customer call? A monitoring alert? boredom? Schadenfreude? Here’s another good question, has this issue occurred before? Do we have a SOP for it? How was it handled last time? etc.
2. Assuming that action was necessary, the first thing to do would be to triage. Hopefully there’s some sort of monitoring and alerting to review, maybe past tickets, fire up perfmon, start checking logs, running first responder scripts and the like…communication with the customer is first priority. (“Hi we’re looking at it…”)
Restart of Sql Server service would do the trick… Why to bother with different kind of inspections that will prolong agony of sql server, when it’s obviously some acute problem and it’s data warehouse database so there’s a less chance that something critical will be screwed? In 30 seconds everything will be fine.
Btw, I’m a programer 😛
J.V. – HAHAHA, nicely done.
I would tell help desk that I’ll look into the issue right away, I’d then get logged on asap and start my investigation.
1. What do you tell the help desk?
If you don’t have any Prolbems and just worry about the high utilization you don’t have to worry. This can be some planned taks.
2. What actions do you take next?
– Check the monitoring tool for a baseline of this server. Also check if this maybe is a weekly, monthly or yearly thing
– Log on to the server and check which serivces are consuming the ressources.
– If it is the SQL Server Service I write an e-mail to the dba to check max memory settings
Going off Jason B’s answer, and Brent’s “did you read the question?” comment, here is what I’ve come up with:
Here is what we know:
1. Someone at the help desk sent an email, asking if something was up with the DW.
2. They attached a screenshot of an unknown Windows machine running full-tilt boogie.
Here is what we don’t know:
1. What time was the email sent?
2. Why was the question asked via email and not by phone?
Questions I quickly ask myself based on the answers to the above:
1. What is the DW “normally” up to at this time of day/night? If I know enough to be in the rotation, I should know the answer to this.
2. Has there been any recent indication of any issues with the DW? If I’m in the rotation, I would be/should be notified of any real DB/DW issues long before the general help desk is.
Additional probing questions I would ask to get to the root of the purported issue as soon as possible:
1. Why is he specifically asking about the DW?
2. What server/machine was the screenshot taken on?
3. What is the role/s of that machine?
4. What is that machine “normally” up to at the time of the email being sent?
Next steps, based on answers to the above:
1. Determine if there are any reported issues with the DW, or are we dealing with someone who knows there is a thing called a DW, thinks it’s cool, and wants to know more about it? What started as an email from a curious help desk rep may lead to a discussion about a future junior BI dev position.
2. While the email specifically asks about the DW, we don’t know for sure that the screenshot came from the DW server. For all we know at this point, we could be looking at a big honkin’ VM host. Remote into the DW and have a quick look for yourself. If what you’re seeing on the DW aligns with the screenshot, use your knowledge of what the DW is usually up to at this time of day (or night) and relay the appropriate information. It may be nothing more than a case of a kick-ass IT budget and a DBA that knows how to use it.
Remain calm, and don’t assume the SHTF until you know it has.
1. First thing I’d ask the Help Desk people to check what process(es) are clobbering the CPUs like that, based on Task Manager. That would then lead into what to do for step 2.
2. Depending on the processes, if it’s one of the SQL processes (SSIS, etc), either (if I have the tools and knowledge) take a look at what’s running (maybe there’s an SSIS package running, or a run away query) I’d also check any running Agent jobs. If it’s not a SQL process and it’s not adversely affecting the performance of the system, I’d tell the Help Desk to keep an eye on things and get back in touch with me if performance starts to dip.
Wow, some of these replies seem straight out of the BOFH handbook (get orffff my server etc!).
In terms of the two questions:
1. Context surrounding the question is key. Who raised it? what were they doing? when was it first noticed etc. If necessary being put in contact with whoever logged it might be more appropriate. If it wasn’t a person but an alert then history surrounding when it happened, and has it happened before would be useful.
2. Providing I had access to the server a look through the event logs and SQL logs after checking the top process list. Activity monitor, blocked processes etc.
You would assume a production server would have key performance activity logged. If so it should be relatively simple to see when it started (if it’s not normal) and align this to any errors in the log files.
Depending on what the findings are would determine where to go from here…
One more comment from me, stop using Windows Task Manager for performance indicators. I get that maybe that is the only thing the helpless desk can use, but WE should not be using it to gauge performance on a server.
First, I would tell the helpdesk that the screenshot does not necessarily indicate a problem. If I had not had any alerts, I would let them know that too. Either way, I would tell them that we probably don’t have a problem and I’ll get back to them.
Next, I would check sp_whoisactive just to make sure there isn’t an immediate problem. I would also check signal waits since CPU usage is good, but signal waits are bad. I want memory usage to be high because I want as much of the database in memory as possible. I would look at disk reads and PLE to make sure we’re not going to disk too much.
This is because high network traffic generate interrupts for the CPU?
Hi Brent, big fan of yours.
What do you tell the help desk?
Looking….
What actions do you take next?
sp_whoisactive
check Solar Winds Ignite
compare performance to other corresponding date/times during other weeks.
check what jobs/etls are currently running, check history.
What would you do Brent?
What is using the CPU and memory? Use taskmgr. Is it even Sql server? Is this happening right now.
Start a data collector set if we don’t already have one so we can determine how often/when. Track cpu % ram usage disk reads per second and seconds per read and same for writes. Disk write and read queue length. Sql page life expectancy.
I would use Sp_whoisactive to see what SQL processes are running if we can or otherwise create a job to store it’s output if we can’t replicate the issue now
From there we proceed to working out why the offending process is causing these issues. Almost unlimited possibilities until we know what the process is doing.
Great answers, everybody. I’ve updated the blog post with my thoughts:
https://www.brentozar.com/archive/2016/07/screenshot-interview-question-saw/