
How to Use CrystalDiskMark 7 to Test Your SQL Server’s Storage
I bet you wanna know whether your storage is hot or not, and there’s no quicker, easier way to get a rough idea of your storage’s capabilities than to fire up CrystalDiskMark. This month, CrystalDiskMark released an all-new version 7, and it makes for even better testing.
Start by downloading it and installing it – sadly, there’s no zip file version anymore that you can stick on a network share and run remotely.
After it launches, click the Profile dropdown at the top:
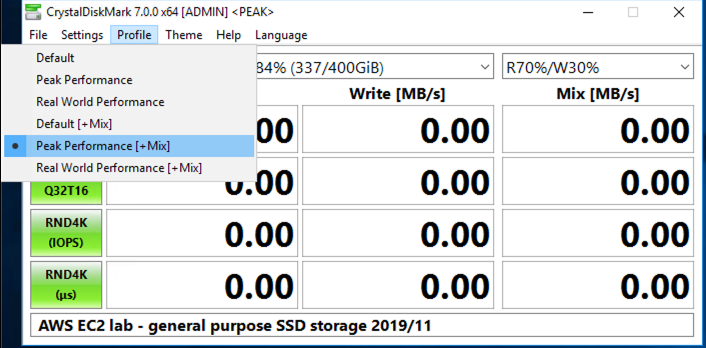
The Peak Performance + Mix setting runs a pretty cool mix of tests that will push your storage hard. Note that I don’t try to get CDM to replicate exactly how SQL Server does IO: I’m just trying to get a quick 5-minute idea of whether my storage is hot or not.
Then, across the top there will be 4 dropdowns:
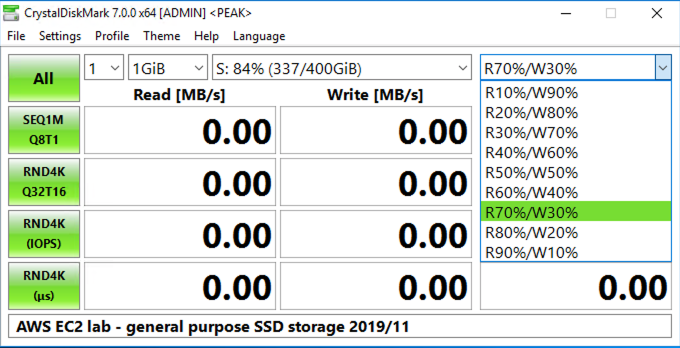
- 1 = the number of tests you want to run. If you only run one test, it’ll finish quickly, but it’ll be vulnerable to other activity running on the server at that moment. If you’re testing an already-in-production server, just do 1 test, but if you’re testing the bejeezus out of one before going live, use more tests.
- 1GiB = the test file size. A small 1GiB file will finish the test quickly, but if your storage has a caching component, you might get deceivingly fast results. I like using a 64GiB file if I’ve got the luxury of more time for testing, but it really will write out 64GiB of data, so make yourself some coffee.
- S: = the drive letter or folder you want to test. You wanna test where the data files, log files, and TempDB live in order to get a good idea of how everything performs.
- R70%/W30% = for the mixed test, the amount of reads vs writes happening simultaneously.
If you want to more closely replicate how your own server does IO, use the mix dropdown to pick a ratio of reads vs writes that mirrors your own server’s workload, and use the Queues and Threads window to pick the amount and sizes of IO. I cover those in my Mastering Server Tuning class, but if you haven’t been through that, you can just stick with the defaults for now.
Click the All button, and all of the tests will run.
When it finishes, click on the text entry box at the bottom of CrystalDiskMark, and you can type in some descriptive info about your storage, then hit enter. This is useful for when you take screenshots like these.
Here’s local ephemeral NVMe storage in an AWS instance:

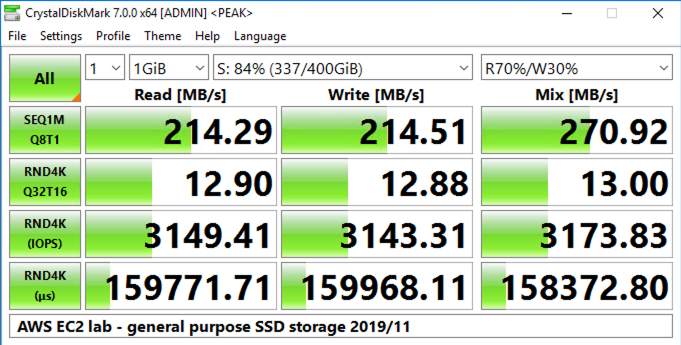
And here’s general purpose (GP2) SSD – note that throughput on this goes up as drive size goes up, and this drive is only 500GB, so it’s pretty cripplingly slow:
When you’re trying to figure out whether your SQL Server’s storage is any good, just compare it to your laptop:

This is especially important with cloud servers: so often, you can sink a ton of monthly fees into storage that performs far, far worse than a $50 USB3 thumb drive. (I’m certainly not saying you shouldn’t go to the cloud – I’m just saying you want to know the strengths and challenges of the infrastructure life dealt ya so you can understand why query tuning and index tuning pay off so well in the cloud.)

15 Comments. Leave new
Hey Brent
I share you like of the CrystalDiskMark/Info tools, but I want to point out that the .zip versions are still available – just downloaded them again from the site, just to make sure 🙂
PS
Thanks for a(nother) interesting post.
Hi Brent
I have just installed the tool but I do not see Mix(mb/s) column , I mean I cannot choose R70%W30%, any Idea?
Sorry , please ignore ,everything is ok.
Hi Brent! Why no mention of DiskSpd (former sqlio.exe)? – https://github.com/Microsoft/diskspd
Because diskspd is a pain in the ass to use compared to the above post.
Zip file available here: https://osdn.net/projects/crystaldiskmark/releases/71859
Great, thanks!
The link provided by Terry is for a specific version and will eventually become stale.
Visit https://crystalmark.info/en/download/ for an up-to-date list of downloads. This includes the zip file linked by Terry, the installer linked by Brent, the Microsoft Store link, and the source code. It also includes the Shizuku edition (Shizuku edition is just a skin).
Hi Brent, what is the most important indicator in CDM for testing SSD or NVMe disk performance for SQL server please? Is it RND 4K Q32T16 closest to random tiny operations – many done at a time?
Many thanks!
Paul – make sure to read the post carefully. The answer’s in there. Thanks!
If SQL uses 64k block size why are you not using 64k block size on all of the tests?
It uses different IO sizes depending on activities, like writing to the transaction log, doing updates, etc.
Thanks. I started doing a deep dive on that. That is quite the subject when you dive into it. Which brings up a different question. For an OLTP server with a massive number of databases (1200), tables with massive number of records (100M to 4B) and the overall data size on drive fairly large (15TB total). What cluster size would you recommend formatting the drives? Which of course I’m hoping it’s not a “it depends” answer 🙂 We started clustering them at 64k, I am starting to think that was a mistake and we are just slowing down our disk IO.
You’re fine with 64kb. To learn more about where it makes sense to make adjustments, check out my Mastering Server Tuning class.
Will do. Just ran a quick test with you settings and 4k, 8k and 64k disk cluster size all ended with around 125 MB\s read, 165 MB\s write and mix of 210 MB\s for RND4k Q32T16. So at least DiskMark thinks they are all about the same.