In the first post in my How to Think Like the Engine series, I started by doing a pretty simple query:

But I noted that if you were following along on your computer, you might see a different execution plan. If I tweak just one thing about my SQL Server, I see a different plan:

That’s the SAME query, hitting the SAME table with the SAME data, on the SAME server, with the exact same data – but suddenly now the query plan goes parallel (as indicated by the Parallelism icon), and I get a missing index request. What gives?
In this case, I changed Cost Threshold for Parallelism.
CTFP is a server-level setting that says, “If a query costs more than this, then consider parallelizing the query’s work across multiple cores.” Most SQL Server setup checklists will suggest that you raise it from the default of 5 up to something more like 40, 50, or 75. I explain the setting in more details over in my post, What is the CXPACKET Wait Type?
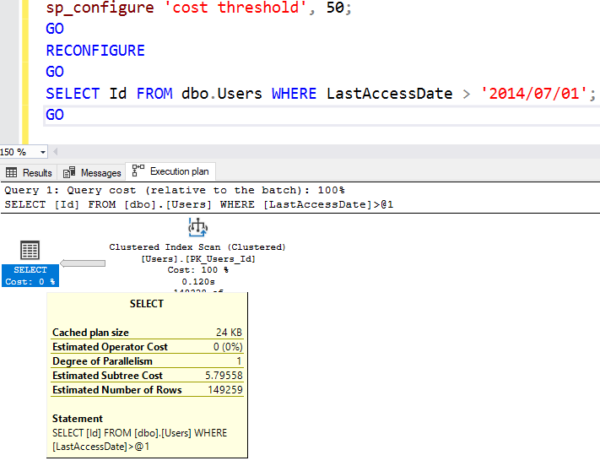
In the first screenshot – where the query goes single-threaded – I had my CTFP set at 50, which means that SQL Server wouldn’t consider parallelizing it if it had a lower cost. If I hover my mouse over the first query’s SELECT operator in the execution plan, I can see the Estimated Subtree Cost:

Estimated Subtree Cost is SQL Server’s guess of how much CPU and IO work will be required to execute the query. SQL Server doesn’t know how fast your CPUs are or how fast your storage is, and these numbers are hard-coded to kinda old hardware. We needed a way to communicate what these numbers mean, though, so Kendra Little came up with the term “Query Bucks.”
 This query costs $5.79 Query Bucks, which is less than our $50 Cost Threshold For Parallelism, and it was a pretty simple query to optimize, so SQL Server bailed out early on building a query plan. If you right-click on the SELECT operator and click Properties, you can see that in the Optimization Level property being TRIVIAL.
SQL Server is in a race against the clock: the faster it can ship your query results, the happier you’ll be. There was no sense putting more time into building this query plan since it was seen as trivially simple – any additional time spent compiling the plan would be just wasted.
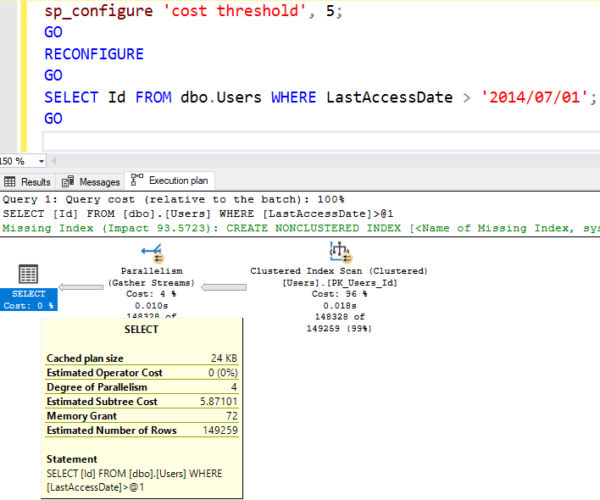
When I dropped Cost Threshold for Parallelism back down to the default of 5:
- The query cost of $5.79 was suddenly higher than CTFP ($5)
- SQL Server went deeper into query optimization (the Optimization Level switched to “FULL”)
- Parallelism was injected into the plan
- The missing index recommendation code kicked into action
And now, SQL Server decides to build a better query plan for my configuration settings – that part is really important to understand:

The cost is now HIGHER – $5.87 Query Bucks – but SQL Server believes it’ll complete more quickly by spreading the work across multiple threads. It might be wrong – but it would be wrong based on YOUR input, which is what drove the Cost Threshold for Parallelism setting. By itself, SQL Server just doesn’t know your workload well enough to decide which queries should go parallel and which ones should stay multi-threaded in order to balance load as efficiently as possible across multiple cores. It needs your tender loving hand on the CTFP dial.
Change anything about the server, and your plans can change.
Oh sure, there’s the obvious stuff:
- Server-level configuration settings (like sp_configure options)
- Hardware capacity (core count and memory availability change plans)
- SQL Server major version (2019, 2017, 2016)
- SQL Server patch level (yes, even Cumulative Updates change optimizer behavior)
- Data quantity – how many rows you have in tables
- Data distribution between different values
But that’s really only scratching the surface. SQL Server is incredibly complex, and has an amazing number of ways that you can influence query plan behavior without even meaning to. For more examples, check out 5 Ways to Change Execution Plans Without Tuning.
This has implications for how you do performance tuning.
Go easy on untested changes. Just because you believe that changing a setting is safe doesn’t mean it won’t have unexpected performance implications.
Try to keep production & development servers as identical as practically possible. The closer your servers match, the closer your query plans will match. If production is SQL Server 2017 with 48 cores and 2TB RAM, but development is SQL Server 2019 with 4 cores and 16GB RAM and a tiny subset of production data, you don’t stand a snowball’s chance in hell of getting execution plans that are even remotely similar. You’re going to have a much harder – not impossible, just harder – chance of getting identical query plans. But at the same time…
Most of the time, you don’t need exactly identical query plans. Generally, a crappy query is a crappy query regardless of the SQL Server version or settings. In this blog post series, for example, if you’re following along with my queries, you don’t need to get exactly the same query plan in order to get the point. Just focus on the basics: is the query getting better or worse?
I kinda feel like this is going into more technical detail than really necessary to introduce you to internals in the How to Think Like the Engine series, but I needed to get that out of the way for those of you who wanna follow along with the query plans on your own machines.


8 Comments. Leave new
I love this article. The two most common accidental lies I hear are “I have two identical databases on two identical servers and they…”. 😀
Jeff – HAHAHAHA, yes, exactly. “Are you sure they’re the same?” “Oh yes, absolutely identical.”
Little late to the party but thanks for this article Brent! I spend more time than I really want to trying to explain why the “same code” on two different servers produce wildly different results.
Chris – you’re welcome!
Hi Brent:
2 comments:
1) I tried doing the sp_configure for parallelism. Received the message that this might be an advanced option.
EXEC sp_configure ‘show advanced options’, 1 ;
GO
RECONFIGURE
go
Then I was able to set the cost threshold.
second, (and this was limited to my system – when I saw it I remembered why I set this). On my instance, max degree of parallelism is set to 1 (a certain Microsoft software which does lots of small rights suggests this). So, obviously setting the cost threshold will have no effect.
Adam – OK, what’s your question for me? It’s not clear what you’re asking.
I’m running a local instance of MS SQL Server. I have 1 Physical CPU and 16 Logical CPUs. My CFTP = 5 and MaxDOP = 8. I ran both queries (SELECT Id FROM dbo.Users and SELECT Id from dbo.Users WHERE LastAccessDate > ‘7/1/2014’). My execution plans look similar to the those in this post. The Estimated Subtree Cost of the Select in the first query (the one without the Where clause) has a value on 5.79558 and the Optimization Level is FULL. Since the CFTP is 5, shouldn’t it have gone parallel? What am I failing to understand? I feel like I can’t move on in the course until I understand this. Looking forward to the replies.
Maria – unfortunately, personalized server troubleshooting is beyond what I can do quickly for free in the blog posts.