
SQL Interview Question: “Tell me what you see in this screenshot.”
You’re a data professional working with (or at least applying to work with) a company using the StackOverflow database (I’m using the March 2016 version today). Your users are complaining that this stored procedure is slow:
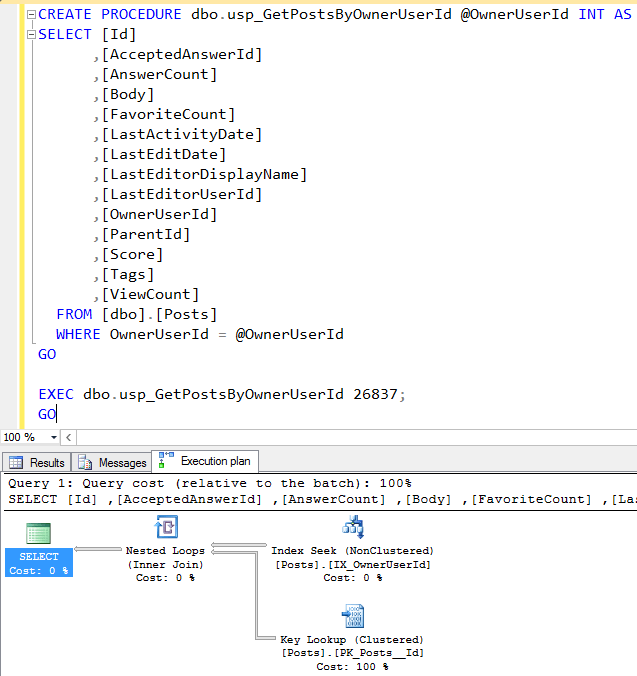
They didn’t give you parameter 26837 – I’m just giving you that so you can see an execution plan.
You don’t have to talk me through the query itself, or what you’d want to do to fix it. In fact, I want you to avoid that altogether.
Instead, tell me what things you need to know before you start tuning, and explain how you’re going to get them.
I’ll follow up in a few days with my thoughts.
Update 2016/05/28 – 71 comments, holy smokes! One thing is clear: you folks like interviewing for jobs. Because there were so many comments, here’s what I’ll do this week: I’m going to start by talking about what I had in mind when I wrote the interview question, without looking at your answers, then I’m going to read yours because I bet you had even better ideas than I did.
For me, the most important part is, “Can you follow directions?” It’s so tempting to jump in and start fixing the query, but I asked two very specific questions, and I was looking for the answers to those.
Before I start tuning this query, I want to know:
- What parameters make this query run slow?
- What does “slow” mean – in concrete time terms?
- Is it always slow for those same parameters, or does the time vary widely?
- How fast does it need to run when I’m done? Or, how long should I spend tuning it? (Typically, I ask the user to tell me if I should spend 15 minutes, 1 hour, or 1 day tuning the query.)
- How often does it run?
- Could we cache the data in the application layer?
To get these answers, I’m going to:
- Talk to the users for speed guidance
- Query the execution plan cache using sp_BlitzCache® to see if this query shows up in our top 10 most resource-intensive queries, and if so, does it have warnings for Frequent Executions, Parameter Sniffing, and/or Long-Running Queries
- Look at the execution plan to see what parameters it was compiled for
- Talk to the developers to see if caching in the app tier is an option
Now, let’s see what you submitted, and look for neat ideas.
- Mazhar wanted to know the table’s size – great idea! You’d want to tune indexes on a 1GB table differently than you’d tune a 1TB one.
- Raul @SQLDoubleG was one of the first to point out that this code and execution plan are a perfect example of a parameter sniffing problem, good job.
- Mike Taras asked who’s running this proc, users or apps? Good question – you might tune end-user facing code differently than service-based code. He also asked if we really need to return all of these fields.
- Russ suggested zooming out and checking the server’s health overall. A+! That’s the first step in my BE CREEPY tuning process, blitzing the box with sp_Blitz®.
- James Anderson turned it around on the users and said, how do you know this is the proc? Are you running traces to find out that it’s slow? I like James. I bet he has ways of making his users talk.
- Thomas Pullen asked if it was lunchtime yet. I’ll meet him at the pub for a pint and we can laugh about the slow queries in our shops.
- Mike F wondered what the users’ SET operations are, because that’s one of the things that can make troubleshooting parameter sniffing harder.
- Jason Strate emphasized getting real numbers because without that, it’s like “knocking on doors at random in Chicago hoping to find Brent’s swag penthouse.” For the record, I have a doorman, but you’re on the guest list, Jason.
- Stephen Falken wants to know what’s changed on that server recently, ask who has elevated permissions on the box, and what they changed.
- Chintak Chhapia asked how frequently data is added & updated to this table, and what columns are updated. Very good question because it determines your indexing strategy.
- And If_Luke_Skywalker_Was_A_Troll gets very high marks for asking excellent followup and challenge questions throughout, getting folks to think deeper through their suggested answers.

83 Comments. Leave new
No semi colon, GO might get embedded in the procedure and the Grant will become part of the procedure which could be fun!
a begin and end would help too , call me old fashioned
No brackets around the parameters, but this is the way I like to do it will still execute again I’m old fashioned.
I guess I am trying to say that in my opinion a bit of bad practice
Staying away from the tuning aspects as requested sir but id be looking for
What indexes are on the table, would an include index help etc.
David – let’s give that another shot. Reread the blog post. What question did I ask?
“GO might get embedded in the procedure”
Say what now?
I would need to know for sure the indexes on the table, it would possibly need to include fields in the key lookup, and maybe nested loop just clicking each and looking at the output list and predicates would help
but its probably predictable.
Well that’s where I would start anyway 🙂
So you wouldn’t care if the OwnerUserId is not INT?
I don’t think I said I didn’t care that in my post, but it would likely cause an scan right?
Actually I misunderstood, you would get a can not convert error ( assuming in the table they are none numeric values)
Try again, young padawan! 🙂
The plan is showing the key lookup is 100% of the query cost.
On larger tables, from my limited experience, such things can be a massive performance hit. Confirm table row size by “EXEC sp_Spaceused posts”
Hover over the Key Lookup to determine what columns are missing from the IX_OwnerUserId index which is being seeked against.
Alter the index to “cover” for the missing column(s)
This would certainly require an index since the procedure requires additional indexes as the existing index is not able to fulfill the requirement to retrieve the results. Key Lookup comes up in the picture when the existing indexes are not fulfilling the conditions to fetch the desired results. Hope it is correct 🙂
I would like to see the select statement for the Posts view and get it by right clicking at the view and choosing “Script View as –> ALTER To –> New Query Editor Window”
Are you sure, young padawan?
The query plan shows Index Seek + Key Lookup, so that tell us
– There is an non clustered index on [OwnerUserId] where to seek
– The index does not cover the query (hence the lookup)
– When this plan got the plan cache, the number of rows (in stats) for the value passed to the sp in @OwnerUserId was selective enough for the optimizer to believe that plan is best
– There are no warnings on the query plan, that’s good
This is a perfect candidate to suffer from parameter sniffing, I’d say.
They are going to be users with a few posts where some others will have thousands. So that plan would work great for not very active users, but others will suffer. (too many lookups), although we don’t know how may rows are returned by this particular user.
I’d look at estimated vs actual values to see how off they are and look at the query plan in XML to find what the compiled value for the parameter was and see if for that value the performance is better.
Also you can run the query using hard coded values to see if the query plan vary.
That’d how I’d start this task.
Very interesting, I have to agree. I hadn’t spotted the potential for parameter sniffing but now you point it out …
Not a comprehensive list by any means, but this would give me at least an idea of the purpose and usage before doing any actual query tuning.
Questions:
1) Who are the users/dependents of this proc? (other procs, applications, actual people?)
2) How is this proc being called? (via SSMS, .NET, remotely through a linked server or openquery from a non Microsoft product)
3) How often is this called from each of the sources? If from an application, is the connection persisted or is a connection opened and closed for each execution (Ex: a “slow” query that was filling a data table in .NET via a loop was opening and closing a connection thousands of times to fill one record for each execution since a prior DBA didn’t want another proc to be created)
4) What fields are actually being used by the callers? (That “Body” field could be huge and unnecessarily returned)
5) Are there any computed columns? If so, are they deterministic or can they otherwise be persisted?
6) What is the definition of “slow”…1/2 second, 10 seconds? Are there peak periods of “slowness” for only for a particular user or type of caller?
Information Gathering:
– usage information in a comment block or in a data dictionary (if available)
– sys.sql_dependencies or the GUI version from the Object | View Dependencies
– Profiler, extended events
– ask BA team (for existing implementation or upcoming, as developers may be writing something right now that will eventually be impacted); personally my favorite as may times you’ll get reasons for why something was done in a particular fashion
+1 for #6 (“HOW slow?”)
As for #4…come on man, you know full well that every user needs every column every time. Especially the off-row ones. And if you could chuck some string functions around the biggest one, that’d be great. Maybe put the resulting expression into a predicate. (Sorry, I’ve spent the last day looking through “long-running query” alerts).
Actually #5 I could be wrong but I think there’s always a Compute Scalar in execution plans with computed columns, whether persisted, indexed, both or neither. There’s a SO post that goes into detail on it somewhere, aptly enough 🙂
1) I would ask if this was ever fast. When was this procedure implemented? When did they start to notice the slowdown? Is the entire DB slow or just this procedure?
2) Look at the version of SQL – including Service Packs and CUs. Also look at what trace flags are enabled.
3) Anything in the event logs?
4) I would check the statistics on the tables – especially posts__id. After that I would look at the fragmentation on the indexes.
5) After all that, look at enabling extended events
Go easy on me – I’m a newbie!
5) After all that, look at enabling extended events
Russ, I like you already!
But let’s not use big words like “Index Fragmentation”
What would the Service Pack change then? Honestly, I will be pretty pissed off if someone enables 1211 randomly.
@ Luke – Thank you for the compliment – and allow me to explain the rest…
I looked at this as a server I’ve never seen before. Before I touch anything I have a script that I run that tells me SQL version, SP & CU, database file location, backup status, user accounts, SQL plans that run and a couple of other small things. I hate touching something and having it choke on me before I do anything. Yes, it’s happened to me.
Trace flags – there are a couple that I’d like to know about ASAP. One tells me that any changes to the query engine becomes effective immediately (-4199). There are a couple that affect statistics (-2389, -2390 and -2371).
Index fragmentation – Ok – my bad. I look at that to see what I’m up against.
My first question before doing anything else:
Is it fast when you run it in SSMS?
How do my users know it’s this SP?
Are my users calling this directly somehow? If so that sounds bad.
Are they running traces against production to discover this? Again sounds bad.
Are they seeing a timeout message that mentions this SP?
When did this start happening? Today, this week, always been slow?
Has something changed around the time it started? Code, indexes, storage, DB settings, etc. This one is broad but checking change requests and releases depoyed around the time it was reported can help.
How long is it taking when it’s running slow?
How long should it take to run? What’s acceptable and whats desired?
Are the average execution times recorded in any monitoring software?
Does it always run slow or is it only at certain times or when something else is running?
When is our maintenance window, batch imports, peak traffic times, etc. Are you running the SP during any of these times?
This is where I would probably start but each one could be drilled into further if it looked like the problem was coming from there.
To answer your question, specifically, I’d ask what columns are being used by the application from this query. I noticed that the stored procedure selects quite a few columns, and I want to know how many of those are needed.
When were the stats last updated on this non-clustered index (IX_OwnerUserID) as well? I imagine Posts is a huge table so the stats could grow out of date without a good maintenance plan.
– the users are complaining. Is their complaint valid & genuine? Has it been independently verified?
assume nothing.
– can the code and/or the indexing schema be changed, what can be done? no point investigating anything if nothing can be changed (e.g. vendor-supplied database, no changes permitted).
– is it time for lunch yet?
– am I being paid?
Yes, good point , I once found myself explaining why a query I had wrote was running slowly… on further investigation it might have something to do with the whopping great big transaction that the app had accidently left open due to some faulty error trapping blocking all in in its wake!
Two of the most important (and my favorite) questions –
– is it time for lunch yet?
– am I being paid?
What is the performance now? Is it acceptable? has it gotten worse over time?
Point being the first thing when being asked for general tuning is if it is the most valuable use of given time.
Missing certain SET options that are expected as part of the procedure declaration.
Due to this it is probably difficult to replicate the slowness inside SSMS unless the session SET options match.
Start by defining with the customer (end user, developer, etc) what slow means. Get an understanding of what the expected performance is and the frequency in which it hasn’t behaved as expected. What does the application stack look like (i.e is there a cache)? Since none of this was defined in the scenario, more information is needed about the actual problem.
From a technical perspective, start by looking at wait stats and query stats. Is there a resource bottleneck? If so, what is it? Is there high execution variablility in rows returned, elapsed time, etc.?
Also, the use case of the procedure in the app matters. Is this called each time one post is requested? Instead of getting a single post, get them all to “be safe”, and then going back with the same effort when the next post is needed. Are all the columns needed? Is this being used where it was intended or in some other app area (i.e too many columns returned)?
The thing to know before anything can really be done is what the actual problem is. Saying a procedure is slow out of context is like knocking on doors at random in Chicago hoping to find Brent’s swag penthouse. You might have fun, but it ain’t going to get you where you need to go.
What do you mean by slow? How long does it take to run? Is it consistently the same speed? In order to solve a problem, you need to understand what the problem is. It is slow can mean different things to different people, get a better definition of the issue
Just include all the cola in the index that way the key lookup will be removed. The index will satisfy the query. T
Patrick – very interesting. Anything you’d think about before making an index with all of the columns in the table in it?
Sometimes, having the primary key as the clustering key is non-optimal depending on how the table is generally queried. That pattern and frequency of queries would be part of what I’d want to obtaining before I’d start tuning. Getting a representative sample of the parameters used would also be helpful (including any outlier values that would return a large number or rows), along with a waits analysis of actual executions with that variety of parameters. A key lookup that shows as 100% of the plan cost may not be the main problem if the query always returns a small number of rows. Changing the clustering key on a large table can be time consuming and would probably need to be scheduled during a maintenance window, if it is advisable at all.
No. Basically the index is working but can be improved by including the other columns in the select statement. These values only get stored in the lower leaf level of the index. This will remove the RID lookups and everything should improve. P
Patrick – very interesting. So you just doubled the size of the table. Body is an NVARCHAR(MAX) fields.
Also, there were no RID lookups – those are on a heap. These are key lookups.
OK, I used the wrong terminology and was going by what I had read in Grant Fritchey’s book Dissecting SQL Server execution plans a few years ago. I have the book in front of me now and thats what he says user either a covered index or use the include statement.
I don’t have the column types so yeah bad choice I guess with the Nvarchar(max) field. Guess I don’t get the job. P
I’m really sorry Brent: I jumped in to fix the problem without reading your actual question. P
No problem! It’s all part of the learning experience.
>tell me what things you need to know before you start tuning, and explain how you’re going to get them.
Would need to know
– data types of columns
– Indexes on the table
– Any triggers (Insert, update and delete) ?
How would I get above things ?
– sp_help table_name.
I would ask:
– There is an index in the OwnerUserId column, it should be used but it is not, clustered index scan was performed. 🙁
– What is the estimated vs actual number of rows?
– What is the column type for OwnerUserId? Is it possible that there is an implicit conversion?
– How much time do I have to optimize it? 10 minutes? 1 hour? 1 day? 1 Week?
Along with all the other fine comments above, I’d want to know if we had baselines. If we have run this query with SET STATISTICS IO,TIME ON/OFF I would want an average of 3 runs with different parameters all placed into the stored proc in the comments section so I can see if anything changed significantly.
I would like to know what’s changed recently. I’d contact the Change Manager, or Service Desk, and ask if any changes had been actioned on that server recently, particularly those that either involved refreshing the StackOverflow database or restarting the SQL Server service for that instance. If the instance is on a VM, it would be a good idea to also check with the Infrastructure team to see whether there’s been any change to resources provisioned for the VM, or if the VM is sitting on a lower performing tier in the SAN (perhaps after a failover test).
I’d run a query to see who has elevated privileges (a member of db_ddladmin or db_owner for the database, or sysadmin for the instance), and just check with them if they’ve made any changes recently outside of those that have been approved for the database/instance.
After that, I’d restore the most recent backup of the database (if available) to a test server and see if there’s differences between the database and the backup (using something like RedGate SQL Compare). If there are differences, such as a more appropriate covering index that’s missing, I’d write up a change request to push it into test and production.
If none of those questions have yielded a believable answer, I’d scratch my head a little, and then start to think about putting in a change request to create a new covering index in test and production.
Why was my comment removed?
I said before, use the include statement in the index creation to satisfy the query. To get rid of the RID lookups.
Patrick – your comment wasn’t removed, it was just pending moderation because you hadn’t commented here before. That keeps the spam down. Thanks!
Questions upfront:
1. Is any banchmark numbers availabe to them for procedure’s executions? I they do not have any such information, I would like to get this from sys.dm_exec_procedure_stats. After then I would ask what is thier exceptation from tuning?
2. How frequently data is added to this table? How frequently data is updated? Which columns are updated?
3. Which edition of SQL Server they are using?
4. Does application code assumes sorted data based on second column in IX_OwnerUserID if there is any?
5. Procedure is retruning many columns? Are all these fields are used in application?
Further questions to ask or get this information by quersing DMVs/metadata view if they gives you access rights
1. How Freaquentely procedure is called? Can get a rough idead by looking at sys.dm_exec_procedure_stats
2. Table schema with
– existing indxes
– partitioning info if table is partitioned
– is table/indexes are compressed?
3. Number of rows in table
4. Statistics on OwnerUserID – to see if there can be some parameter sniffnig issue
Well
1) How large is the table –
2) is there partitions —
3) what indexes exist on table
4) Column data types
5) statistics that exist
6) memory of server, Min / Max memory setting in SQL
7) Memory per query setting
8) Free disk space (Under 10% could slow things down)
9) are there calculated columns
10)
Most of the information can be extracted from running a few queries, pull data from system tables.Disk space, you could run exteneded stored procedure.
Disk space – master..xp_fixeddrives will give you free space available
To start:
Identify workload /Table structure / Look at existing indexes on that table (sp_help)
right-click on key lookup operator in plan and get a list of columns that are generating the key lookup.
So, before you start troubleshooting, you would probably want to define ‘slow’- did this just start happening? Slow, like the app throws errors, or the thing completes, but just slower than usual? Or is this thing always slow? This would help me figure out how to prioritize the issue. I would go to the the guys that are reporting the issue to get this info. I might have a fancy monitoring tool that could show me this info as a metric vs. a users feelings (something like Idera or Ignite), but the user might be able to give me the heads up if prod is impaired more quickly…
Have there been any code changes? Or any other changes? If this thing used to run fine, then a code change could have changed the execution plan that the optimizer engine is giving me. I would check this with the dev team- I might be able to use our ticketing software to get this info myself, but I have found that it is usually easier to ask dev instead….
I would also want to know if it is specific to the userId they are running with. Does it run fine for other IDs? I would want to compare the execution plans if so.
Looking at the query plan, I would think that there may be an implicit conversion situation going on, but if this slowness just started happening, and the code hasn’t changed, and the data types match, then I might be looking at if we are getting a bad plan.
Stuff like that.
*sigh* I couldn’t hold myself back from commenting on this post. These posts are just to enticing not to comment.
Off the top of my head, here are the things that I would like to know about before I start tuning this stored procedure:
The version of SQL Server.
The table structure and database layout would be nice.
RAM and the Hard Drive space where the mdf and the ldf reside.
What do the maintenance plans look like and when do they run?
I like to dive into the plan cache to see what queries use this table and what uses the indexes on these tables.
Is there a test server?
Are there any missing indexes on this table, any unused indexes?
What are the baseline performance statistics for this query?
What values are being passed as parameters to this stored procedure?
How often is this stored procedure used?
Using sp_BlitzIndex and sp_blitz would give me a great deal of information that I would use to help tune this query. It would be useful to be able to use SSMS to help gather some information as I prefer to use the GUI over text. I would also use SSMS to view the maintenance jobs on the server if there were any. Using SET STATISTICS TIME and SET STATISTICS IO would help me to baseline the performance stats for this stored procedure. In a perfect scenario, I would be able to ask my contact at the company if there was a test server available. Though, I have been brought into a company before where that scenario wasn’t available. Hopefully there is a monitoring tool that could tell me how much RAM and hard drive space is left on the drives or maybe there is other documentation on the server that would tell me. I would query sys.dm_exec_query_stats, sys.dm_exec_text_query_plan, sys.dm_exec_sql_text, and sys.dm_exec_query_plan for the plan cache, part of my missing indexes research, to see how often this stored procedure runs, and to hopefully see what values are being passed to this stored procedure. I would also hope that the SQL Server didn’t just reboot or that I was on a version of SQL in where rebuilding indexes clears out the index usage stats. Oh, it would be nice to have access to SQL Sentry Plan Explorer to help validate testing too.
validate the select, does the value exist, check cpu (dmv,dbcc…)& hope its not a point of entry from app to db with one userid.
run DBCC SHOW_STATISTICS (‘dbo.posts’, ‘ownerUserId’)
This will show when statistics were last updated, what they were based on (teeny weenie sample or not).
It shows the split of values across the buckets and should help you understand why the query optimiser has chosen that particular plan.
Before modifying the procedure, I would explore the followings:
-actual number of rows vs. estimated number of rows in the execution plan objects (if there is a big difference between the two, then the table statistics should be updated)
-review index fragmentation (the usual dynamic management views)
-ensure server’s hardware is on “High Performance” setting not “Balanced” to save energy (go to control panel)
-ensure server’s disk is formatted with 64k allocation blocks (command prompt: fsutil fsinfo ntfsinfo d:)
-review server memory and ensure (if it can) it allocated about 75% of the memory or leave at least 2GB to the server’s operating system
-Review the capability level and ensure it is on the latest level
-Review the wait statistics using dynamic management views. If CXPACKET is high… then review what the current MAXDOP and Cost Threshold for Parallelism.
I would also check to see if there are multiple tempdb data files and each on its own drive.
Most of the stuff I thought about has been said (e.g. definition of slow, what columns are needed, size, key look up).
I’d normally start with running a profiler trace/extended events (probably in test, depending on the environment) and see what’s going on with reads etc.
Also take a look at the wait stats to get a feel for where the bottle neck(s) is.
Simples… it’s time to buy faster hardware!
I’d like to know
– how often does this stored procedure run? (if it runs 100 times per second then it’s higher priority to fix than one that runs once per week)
– did it suddenly get slower or has it been degrading for some time?
– does the table get a lot more reads than writes (because if it gets lots of writes then adding indexes may degrade those writes)
– what version/configuration of SQL server?
– is this procedure called directly by the application, and is it using all of the output fields?
I’d probably need to ask users and developers for the answers to some of those questions, though since I’d be reluctant to run a trace on the production server.
Furthermore, I would ask if the application needs all the rows that are being returned (and not, for example, discarding all except 20 of them).
This is just a hunch.
I haven’t read any of the other comments yet.
Performance tuning can start before some of the later items on this are known, as there are sometimes some quite low hanging fruit.
-1) check that there are no alarm bells going off, cause if infrastructure has an alert out, the response might just be “yeah, we’re having some san problems, infrastructure says it should be resolved by lunch time”
0) (was originally at 3) what are the current performance bottlenecks on the server;
– execute sp_whoIsActive to see if the server is, right now, overloaded for some reason, and what a point in time list of the locks are (if there’s 50 queries, all but one of them waiting on IO, or blocked by a different queries lock, thats a first pass good indicator of a possible performance issue)
— this is first because it might be time to raise some alarm bells of your own, because these guys might just be the first to notice a critical issue.
– bulk stats on the server; cpu, ram, db size, what parts of the database are on hdd vs sdd.
– what are the main wait types on the server (sys.dm_os_wait_stats)
– what are the largest queries on the server (could be a long running query holding a lock)
– does sql suggest any indexes for them.
– how many cpu’s are there, and what % of the time is there less than 1 free. (ie >75% load on a 4 cpu server)
– average/peak IO latency (high IO waits shows IO bottlenecks / other performance issues)
— depends on infrastructure arrangement and monitoring, worst case, windows performance monitor monitoring the box for a few high-load hours. – Mb/s read/write io latency, cpu%, network bandwidth
— you often don’t just get 1 simple query being slow, if for a forum db reading a single record from the posts table (with no joins) is currently unexpectedly slow , that could be a sign of a larger issue.
1) what exactly is being slow; a key lookup is typically reasonably fast, when a user says that something is slow, it could be that the app layer is saying that a significant % of cpu time is being spent in a single function call.
— a few emails / meetings with the relevant stakeholders should clarify this
1b) upon reflection, more info is needed here — has something changed (ie was it ok last wednesday and now its broken, or was it a long term problem highlighted by the especially busy period recently)
2) what performance level are they expecting. (cause that san + db+network latency may not get down to the 0.05ms they would like, or it could be that the 50ms response is slow and they just would like it to be under 5ms to handle the 200 calls/second happening)
— roll into above communication
3) what other queries use this table on a regular basis
— depends on available tools ;
— consulting query plan cache and execution count/cost is useful here, but easily misses things; if you’re on 2016, the query store; repeat point-in-time querying with something like sp_whoIsActive; app layer logging; and if you’re desperate, sql server profiling as a last resort cause it’s expensive and shouldn’t lightly be done on a prod server which is already noted to be slow in some way)
4) how much freedom do we have to change the database ; ie, alter clustered indexes, change db column structure, alter how the caller of the query uses the proc.
– consult senior dba/ team lead app dev / other project owner/stakeholder
5) what type of isolation levels are available for the server, and what is it currently running.
– server config (especially snapshot isolation)
When to switch from info gathering mode through to fix-it mode would depend on the answers at each point.
Depending on the outcomes there would be more steps needed, but those would be more change management, and not stuff needed to diagnose the cause.
Like some of the other comments. First, what is slow and what is the expectation and use case where this is executed. How many posts might there be? Get the max, average and minimum number of results. Run the proc with inputs from those categories and see if the performance is reasonable for the amount of data being returned and then go from there.
I would ask if all the fields are required.
Random thought. How about setting an impossible task (that looks possible)? The candidate who tries longest scores highest.
Richard – wouldn’t you rather have someone immediately recognize that it’s not actually possible? 😀
Sorry Brent I do not mean to be contrary all the time 🙂 … I would say my dba job, is to think-hard about the problems and future problems within my employers database’s. More often than not finding solutions (but not always).
This “thinking hard” is a bit-of-a problem for interviewers to measure. They would – I’m sure – like to know how hard I would think about their database problems? And for how long? And would I give up easily? (that’s the key statement).
But all they can test is – me – up for it – on the day of the interview – with stuff I know (or don’t).
Some smarty-pants would sus a wrecked fuzzbuzz test quickly I’m sure (for example). Others would dream-up many, many mitigation’s to explain there lack of success.
All smarty-pants answers / mitigation’s etc are accepted as “Correct”. However I would be sneakily measuring total time (for comparison). Because we all fail, and should be measured on our worst days.
“Because we all fail sometimes …” DBA’s that is, not Consultants obviously 😉
As capn jack said .. the problem is not the problem..
chiederei se la query è sempre stata lenta o solo in certi momenti, o se le performance sono degradate col tempo
È che l’unica domanda che merion chiede?
ahah sorry 🙁
ask if the query has always been slow or only at certain times, or if the performance is degraded over time
ps:
please delete my previous comment, wasn’t in english
Question the complainants for precise details. For example; was the slowness Intermittent or did it get progressively worse. What time did they first notice it. Other questions which would help set me down a rough set of troubleshooting paths. (Tell me where it hurts, how slow is slow, is it REALLY slow?)
Based on their answers, you could then start diving into the following (but not limited to) paths,
Long running backup jobs (sys.dm_exec_requests where percent_complete > 0) or Job Monitor
Check plan cache (sys.dm_exec_cached_plans)
Review indexes (sys.indexes) (Index fragmentation … sp_Blitz)
Check data growth events from the default trace (Are we just getting)
You definitive need more Information on the enviorement, on the Client, on the time when it is slow and a way to mesure what is slow. Also I would look at the data and test with many more runs than only one go at the id you have choosen. The Execution plan Looks very unbalanced. 0 % on the non Clustered Index and 100 % on the clustered Index. I would check the existing Indexes, maybe you can extend one with the columns you need. Also I would check the existing selects on the table. I don’t want to make it worse. I would use the proc bliz index and ask brent for shure. Maybe it is not the index or the table or the database, Maybe the mtbf for a ssd in the raid for the db files is to high and the whole Server is getting slow. Brent, please don’t ask me where I have read this. I can even run without reading a book how to walk. : ).
Ok, now it is try and error. I would stay with the Problem on the statistics and on the proc for the table. If auto create stats is set to off and auto update stats is set to off, the stats can be outdated and if the table structure gets modified the procedure plan can get outdated. So you have to recompile the proc and rebuild the statistics.
> Are all of the columns selected needed?
>> This is a developer/business question. If the proc is called from code, we can find out if all of the columns are necessary. I use a query I wrote to determine every place that the procedure shows up in T-SQL on the instance.
> What is the expected workload of the Posts table? (Is it read or write heavy?)
> What is the indexing situation on the Posts table?
> What is the datatype of OwnerUserId?
>> Can get this information from sp_BlitzIndex, mostly. The first question is partially a developer/business question but can be supplemented by sp_BlitzIndex read/write info. It depends on how often the index usage dmvs are cleared out.
> How often is this procedure used?
> Is there parameter sniffing going on?
>> Check the plan cache for usages and number of distinct plans.
> What is the expected/required speed of execution?
> How many resources (processors/RAM/disk space) can be dedicated to this query?
>> Business question. We basically need to find out what the expectation of a fix is.
How about changing the cluster index on owneruserid and non cluster index on post id instead?
The query is obviously pretty simple and the execution plan, while not perfect isn’t exactly giving me a headache. So I’d try and start off with some pretty basic questions before I start even thinking about tuning.
Questions I would find answers by asking questions:
What is there definition of slow?
Are these “users” that are complaining my developers or the end users of the application?
Is the data set being returned by this not filtered enough for the application? If you are pulling all data for a specific user it’s distinctly possible that that could be an incredibly large volume of data.
How is the application using this query and why does it need all data about all posts a given user?
Is this consistently slow or is there any sort of pattern? My assumption is that the performance of this could vary wildly by user depending on if that user is AaronBertrand or GenericUserWhoAsked1QuestionThenNeverUsedThisAccountAgain.
Questions I would find answers in SQL Server:
What’s the current structure of the table/clustered index? (Use SSMS to view the datatypes and structure) I happen to know some of these are fairly large data types and as a result probably aren’t great candidates for include.
What makes this query run so long? (See the data from Statistics IO or preferably Plan Explorer if available)
I could probably think of a few more but that’s what I’ve got off the top of my head.
“That that”… Nice Zane Way to proofread 🙂
What’s happening to cpu, memory and io while this runs ? Use Perfmon ?
How many reads does this make – set statistics io on
When is this slow? All the time ? When multiple users run it ? Ask users or do some tests
When it is slow – what other processes are running in sql ? Sp_whoisactive
What locking if any is present while it runs slowly? sp_lock
What else is the sql server used for ? Server guys etc
What version of sql is this ?
What’s the server os ?
What disk latencies does the San give me if I use a script to measure these over say half an hour when
Users report a performance issue. How does this compare with any figures the San admin can measure for me over the same time period
What’s the page life expectancy over this period. Measure in Perfmon or with dmv query
What indexes exist on this table already – script table in ssms
How many rows does that table have ? Select count query
I am guessing this table is inserted and updated heavily if it contains forum posts ? Ask app developers
When we’re the indexes already on the table last rebuilt? Index properties in SSMS
How old are the statistics on the columns and indexes ?
Do we have a test environment where I can add a new index and simulate loads of inserts and updates with and without a new index
Giving up now as I am tired of typing on my phone …
Great answers, everybody! The post has now been updated with my initial thoughts from when I wrote the question, plus some of my favorite answers out of your suggestions.
Questions I would ask:
When did you notice this was starting to be slow?
How did you determine that it is slow in comparison to what you’re used to?
Did something change recently that would cause this to slow down?
How important is this to address in relation to other work on the backlog? Meaning, is it worth putting other tasks or projects aside in order to speed.it up?
I would ask what parameter was passed in when they ran it. Try it in front of them and then try another one to see if it gives consistent results.
Start with these and go from here.
A lot of time can be wasted or making it worse if you change it and find out it’s really not the sp that’s slow.
Is this the SQL instance that’s running on my Call Of Duty server? That may be causing an issue or two.
I would change IX-OwneruserID to be the clustered index.
Most of the access to this table would probably be by userid. ( I am assuming this, but this could be verified by looking at index usage for this table )
Then you would get rid of all the key lookups.
Q: How did you come to be a SQL DBA and why are you still a SQL DBA?
Jon Skeet.
I would call Microsoft support and scold them!