
Free SQL Server Performance Monitor App by Erik Darling
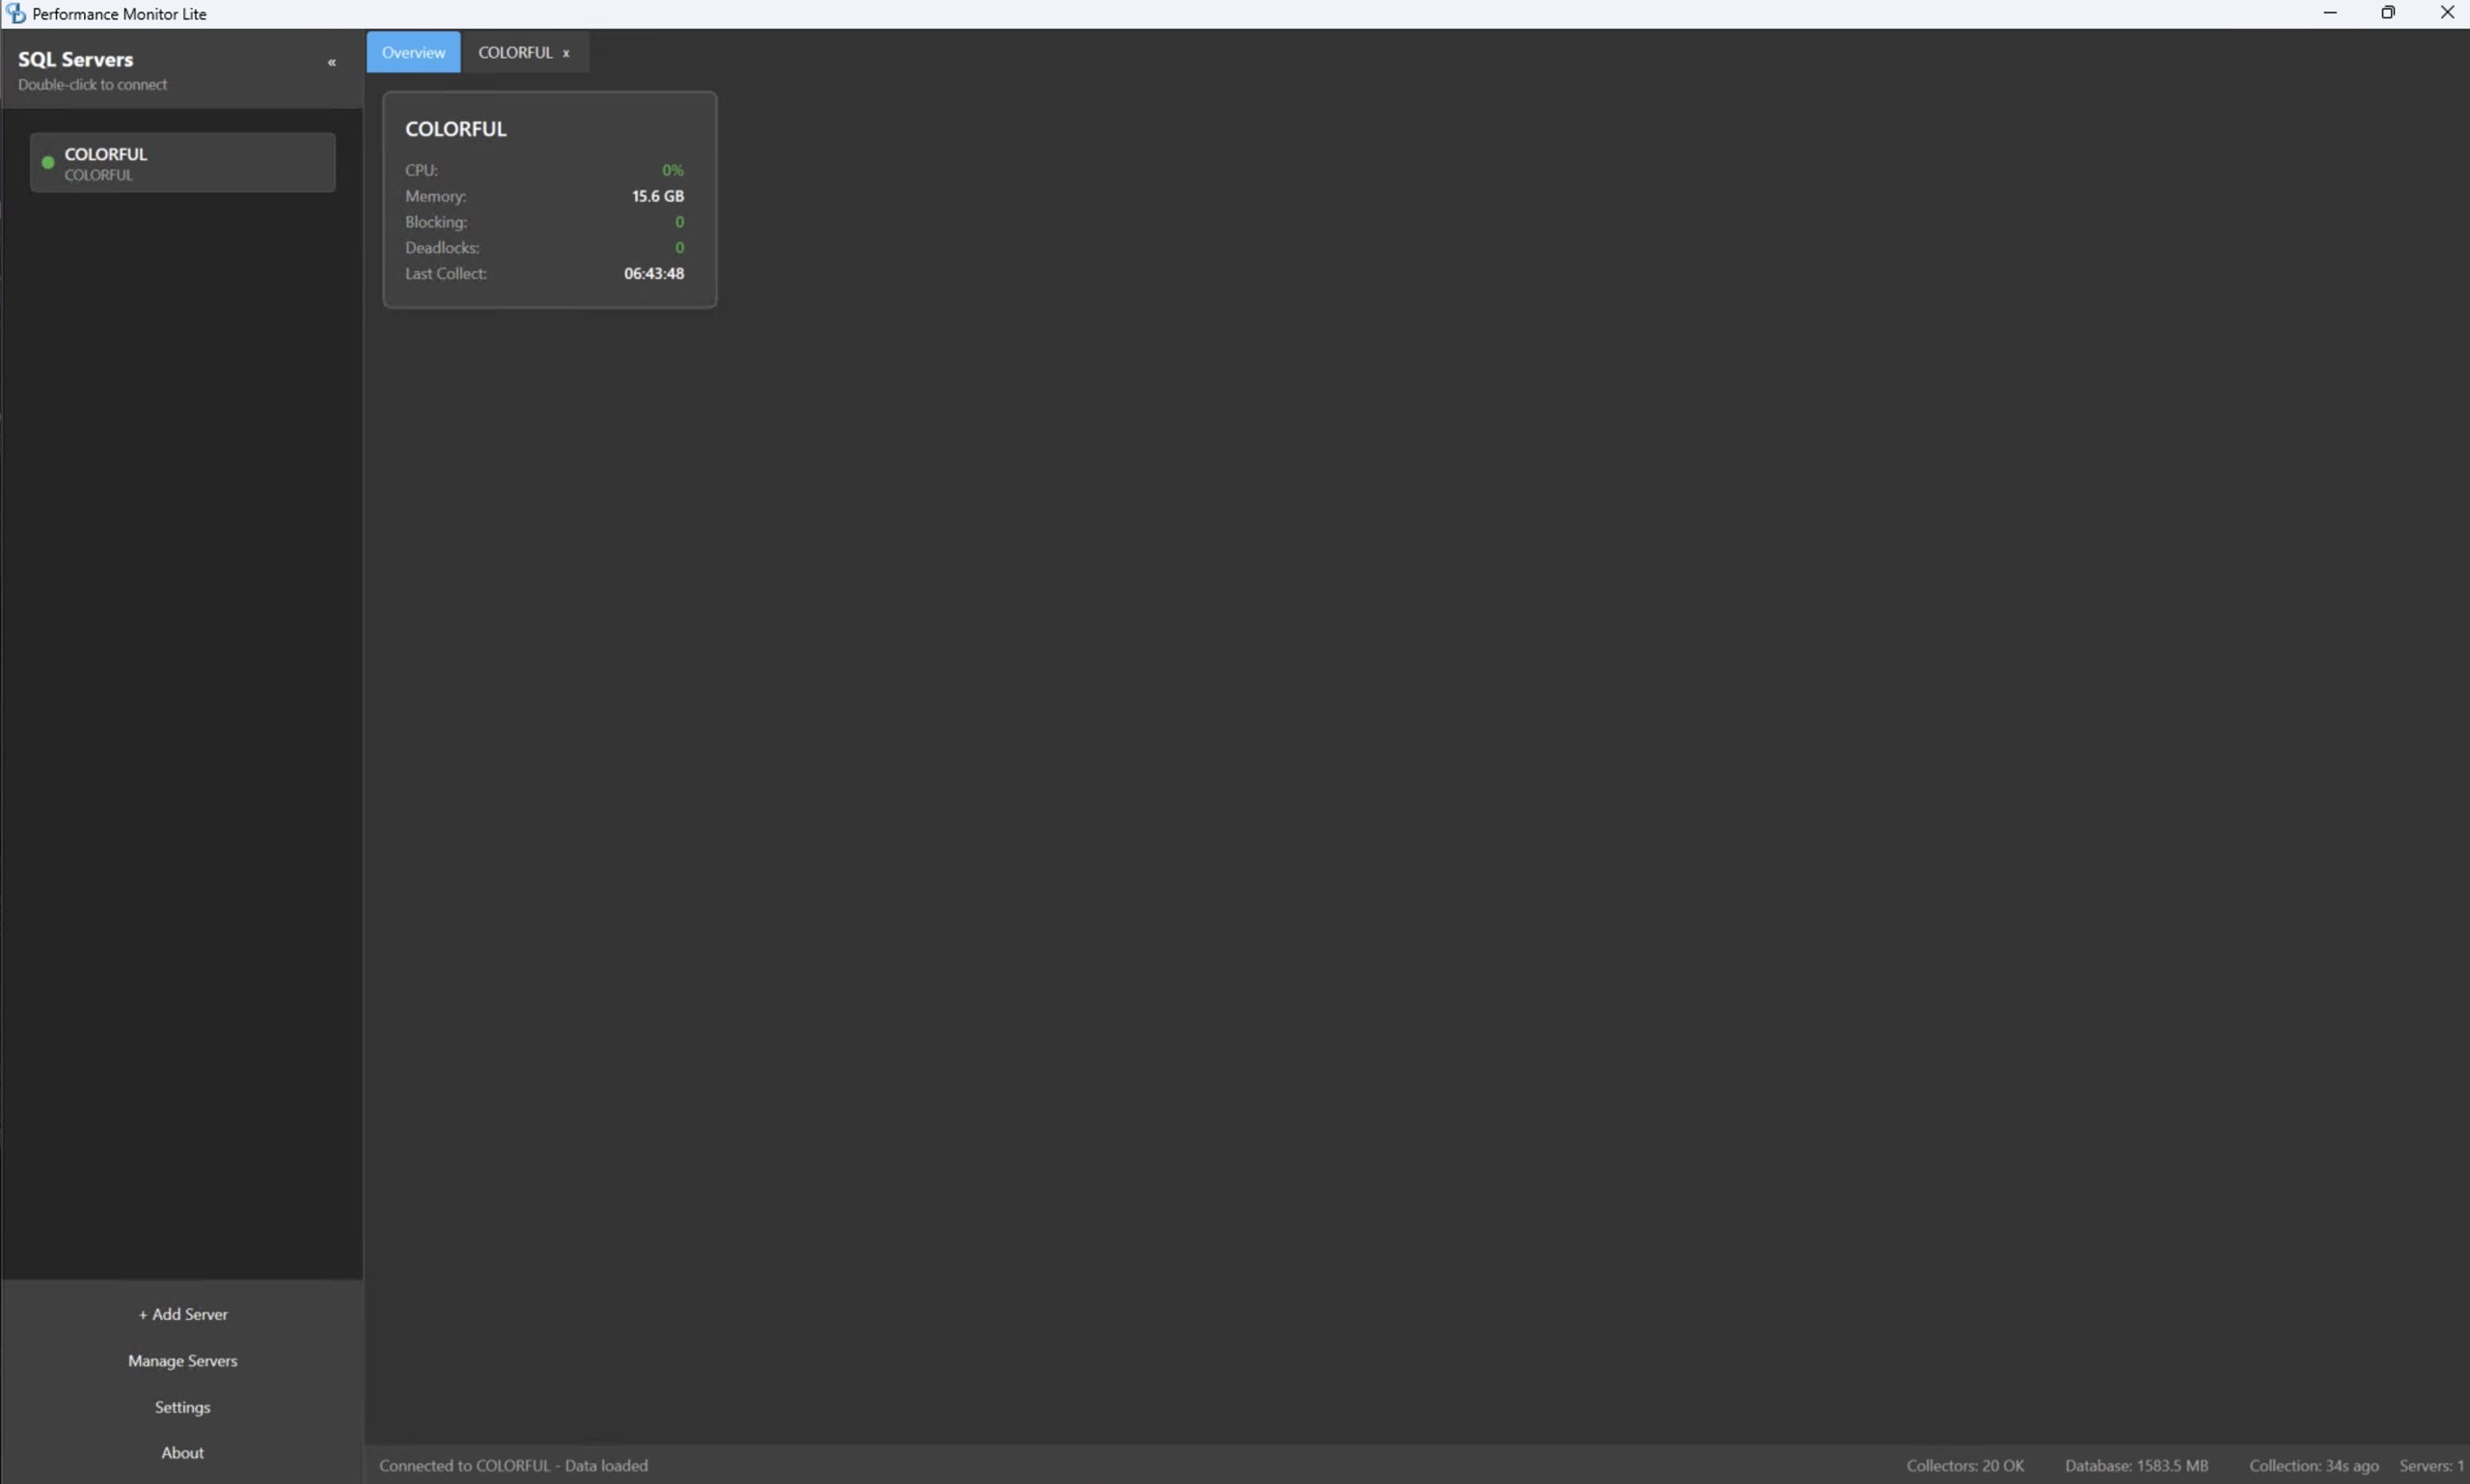
Let’s hop right into it. I’ve got one lab server (named Colorful), so when I open the app, my estate overview isn’t particularly interesting – yours will be:
Go into the server’s details, and you see the top wait types over time:

You can choose which wait types to display. By default, he just shows the top 20, plus poison wait types, to keep the graph clean and easy-to-understand. There’s a dropdown at the top right to choose your time span: last 1 hour, last 4 hours, 12 hours, 24 hours, 7 days, or custom.
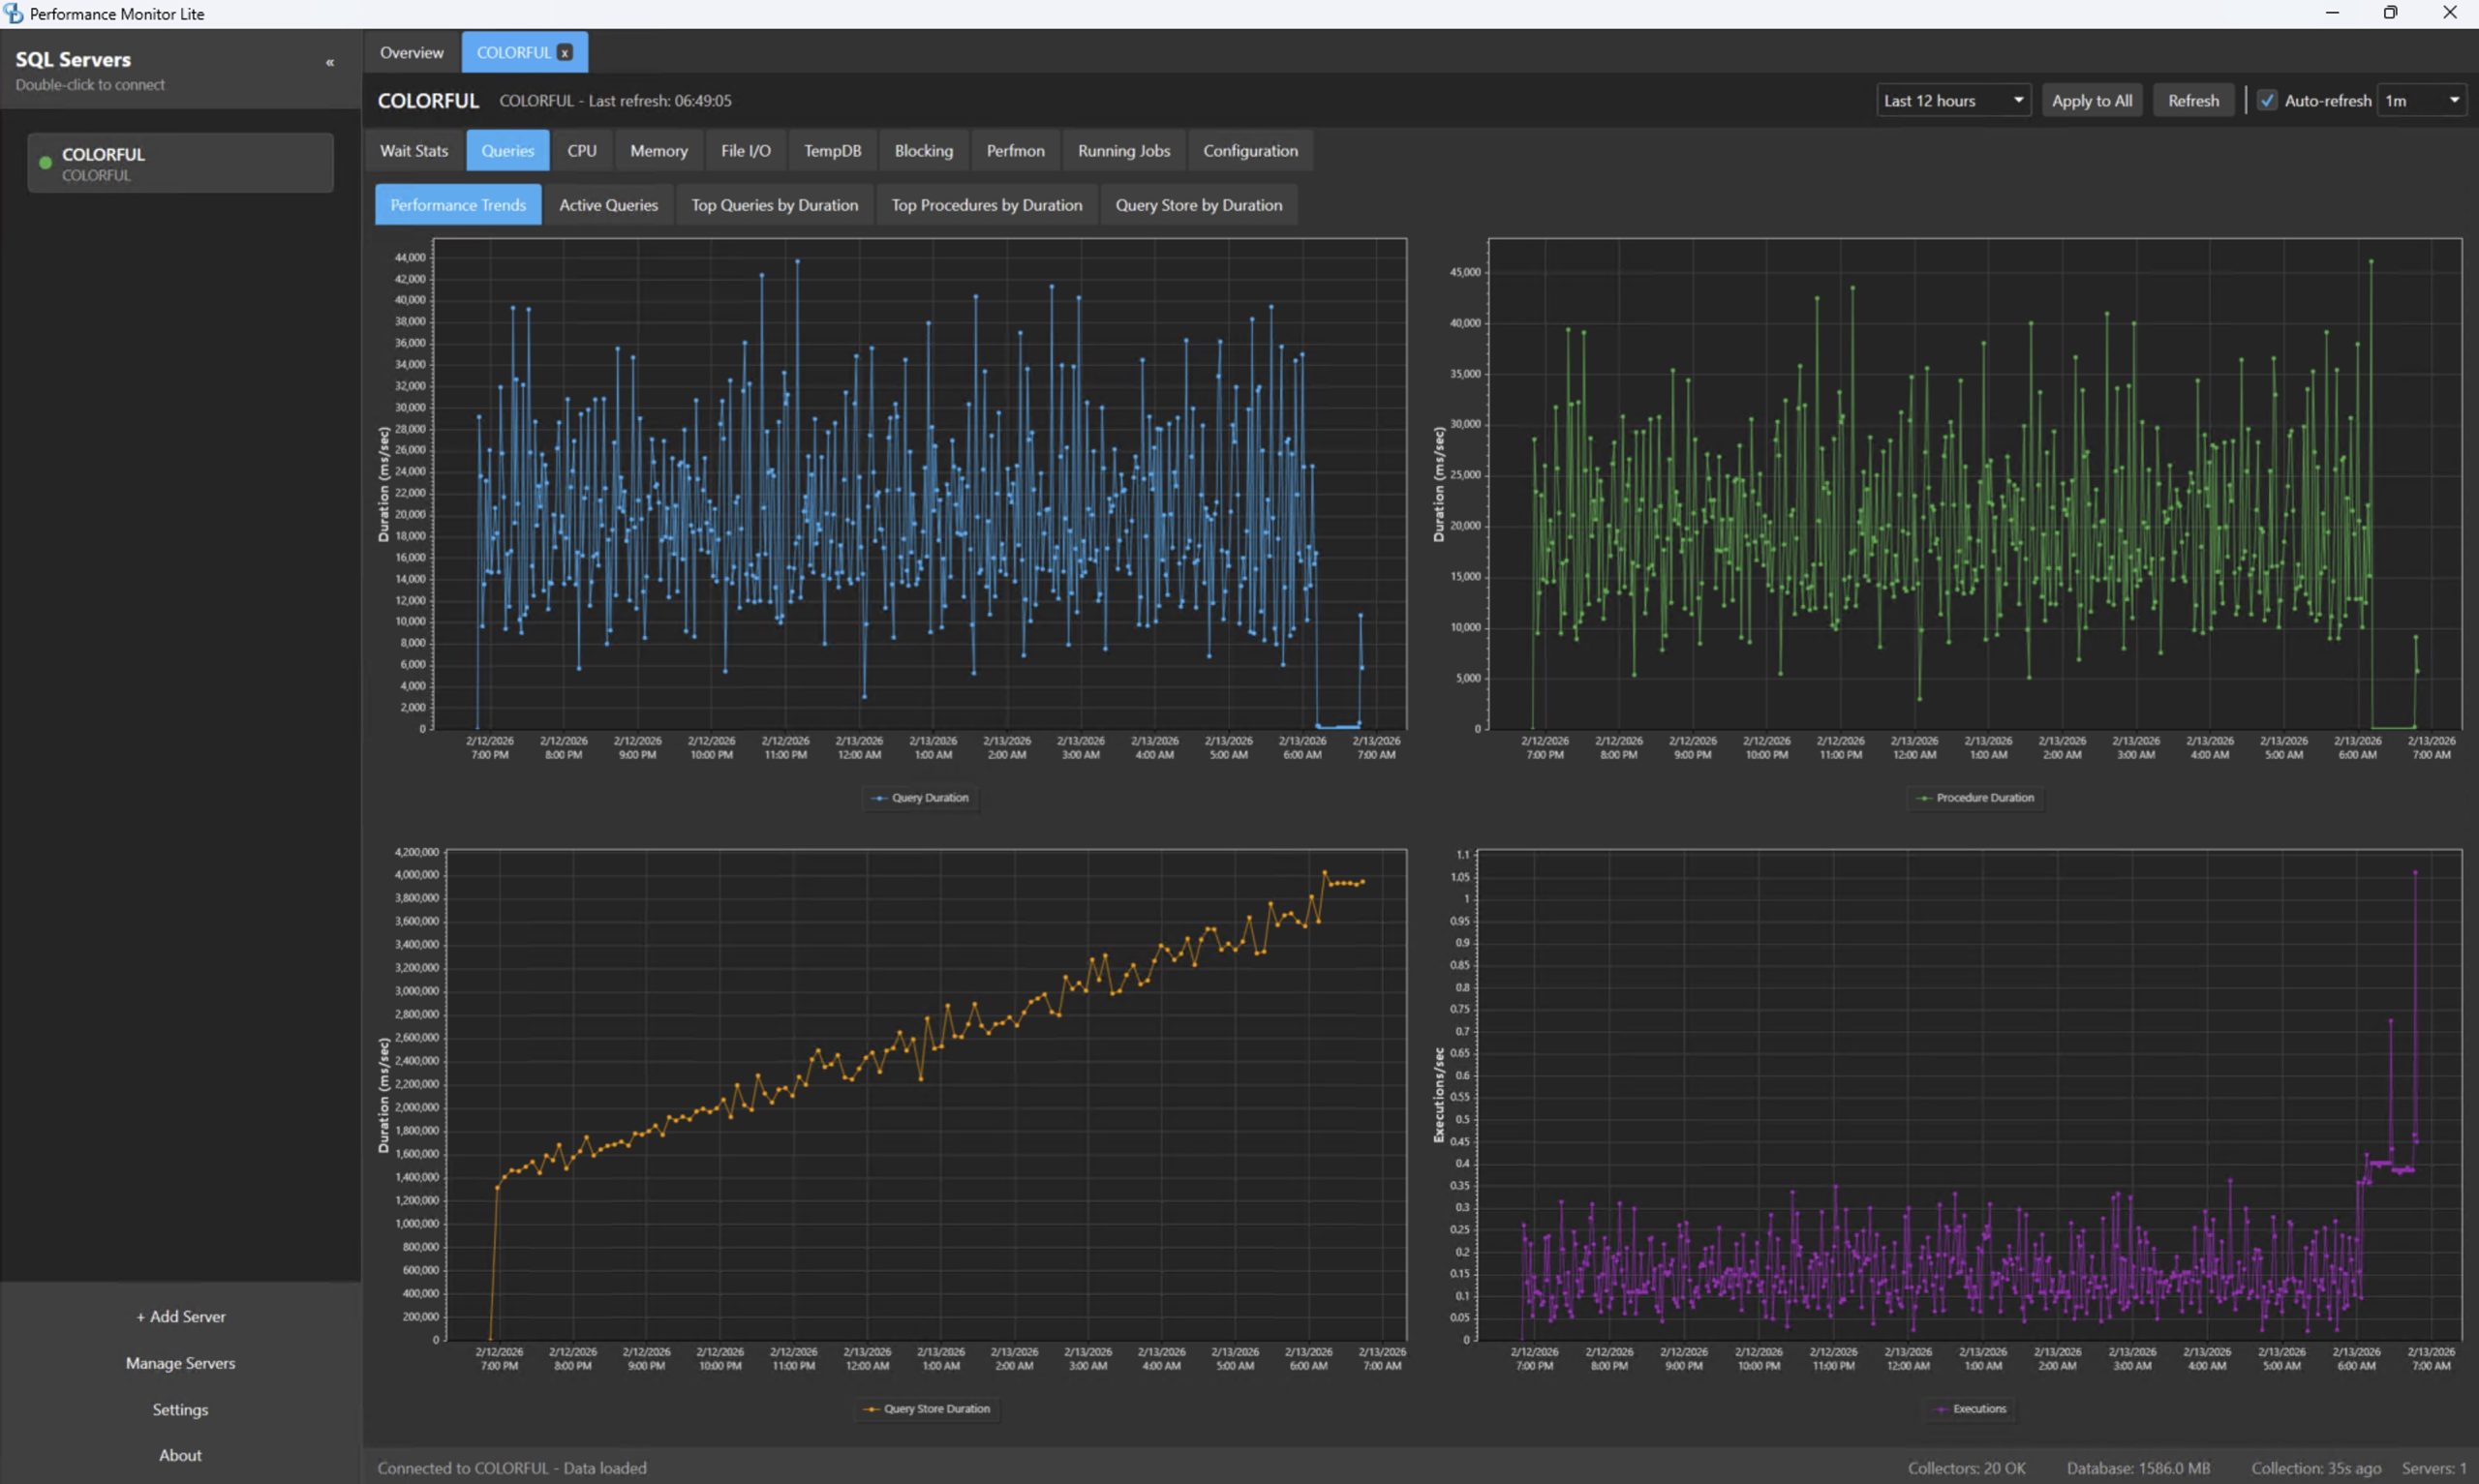
Go into the Queries tab, Performance Trends, and there’s graphs for how long query execution is taking, proc execution time, and number of queries executed – so you can see if your server is busier than usual:
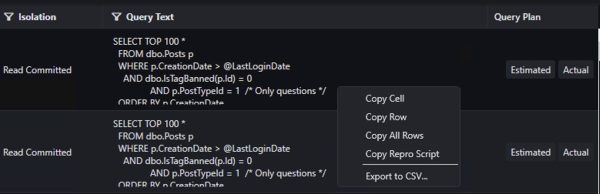
Which queries have been running and taking the most time? I’m glad you asked, because you can click on tabs for Top Queries by Duration, Top Procedures By Duration, and Query Store by Duration to see grid results:

Scroll across to the right to see the query, download its estimated or actual (runtime) query plan, and right-click on the row to see more cool options:
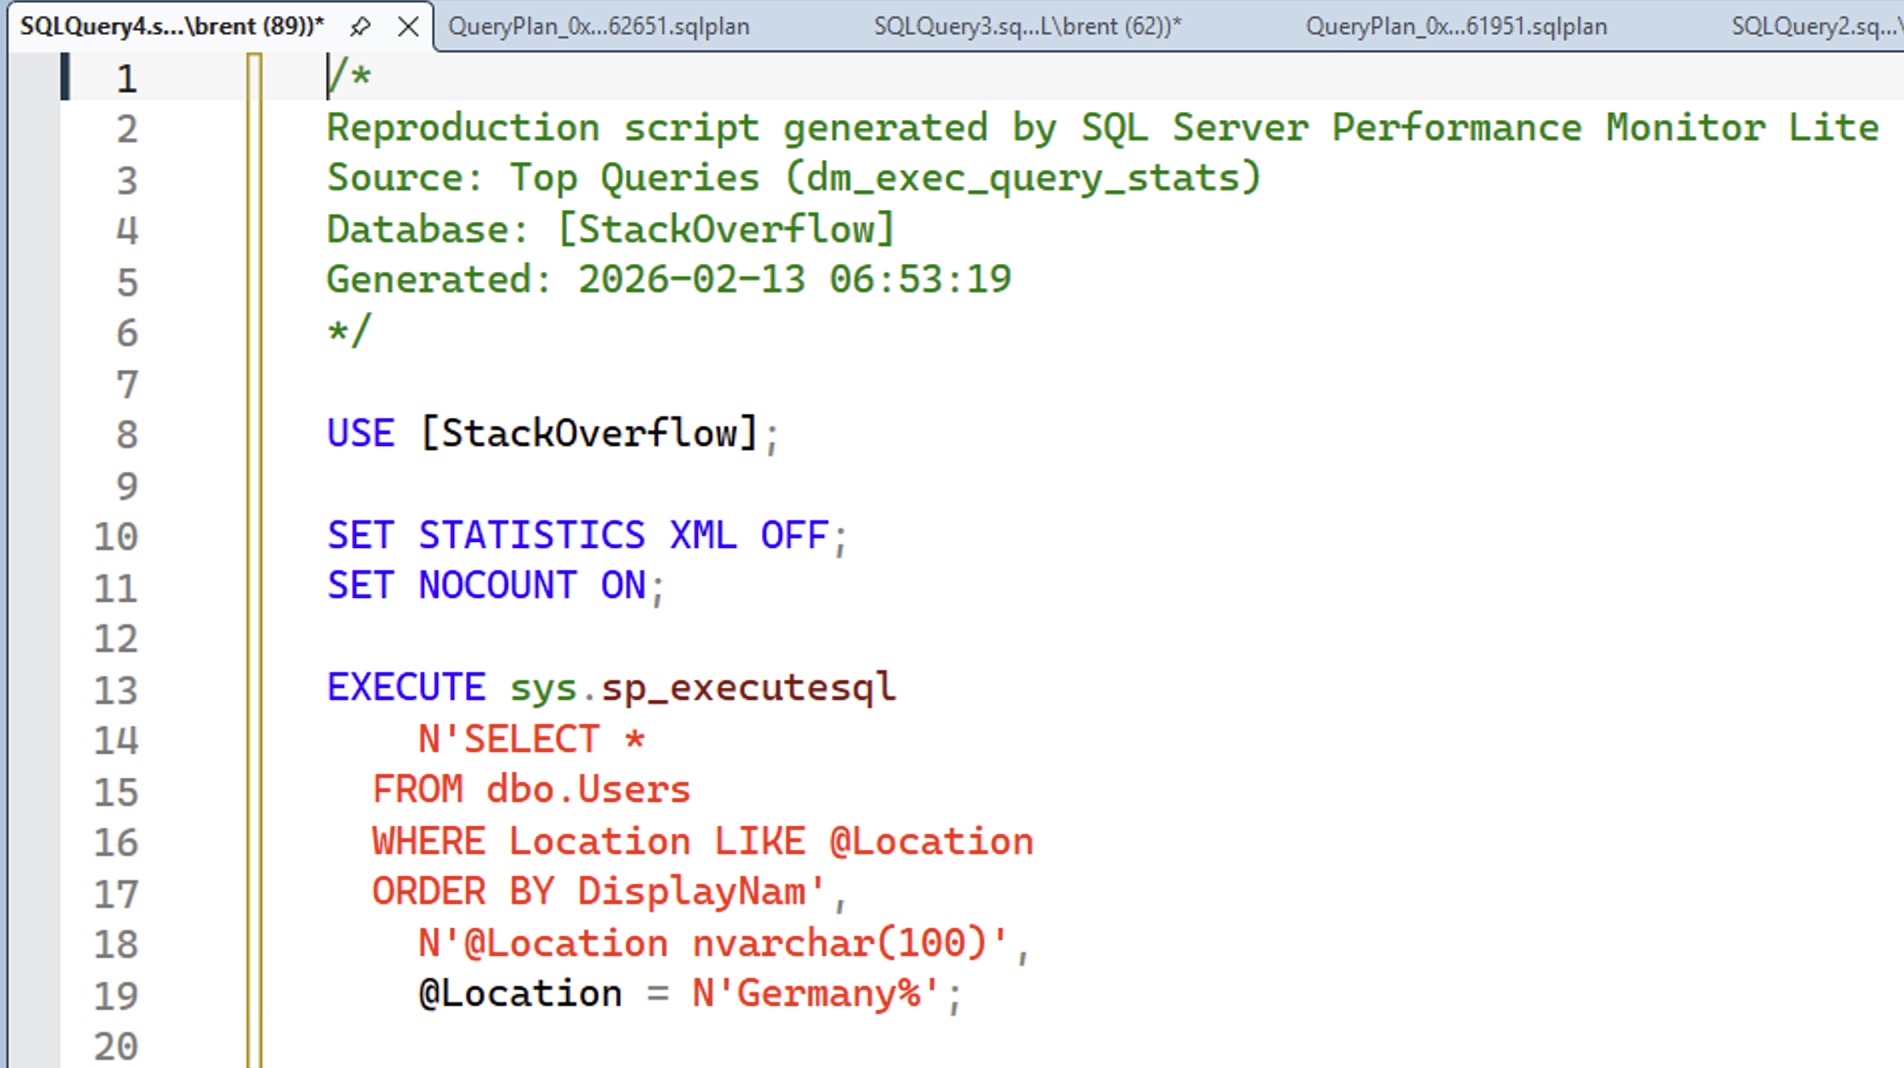
Click “Copy Repro Script”, then switch over to SSMS, and you get a call stack for the query, including the parameters that it was compiled with:
So right there, in a matter of seconds, you can get started running the query, seeing its actual execution plan, and doing your performance tuning work.
Now, it’s not a superhero, because if there are no parameters in the plan cache (or Query Store or whatever you’re looking at in that moment), then it’s not going to be able to come up with the parameters to test with. Eagle-eyed viewers will also catch that the query in the screen shot isn’t quite right – the last character in each query was getting trimmed off – but Erik’s already fixed that. I’m just too lazy to redo the screenshot.
Let’s pause the screenshot tour to talk big picture.
The above workflow – the ability to get query plans and repro scripts quickly – is indicative of the fact that Erik’s going to use this in his day job as a performance tuning consultant. Open source tooling works best when the authors actually use their work on a daily basis, testing it out and proving its worth in making their jobs faster. The fact that Erik is gonna use this to make money is a good sign that the project is going to be useful to folks like you and me.
See, Erik can’t afford to waste his time building features for marketing fluff or buzzword scores – this is a tool he actually has to use. He’s not selling it, and he doesn’t have unlimited free time, so he’s gotta build features that matter.
As a result, right out of the gate, you get genuinely helpful features like that “Copy Repro Script”, something that every monitoring tool should have always had since the dawn of time.
SQL Server Performance Monitor has lots more features.
Rather than showing you screenshots of all of them, I’ll list the ones I think are going to resonate with you most:
- Email alerts
- Popup alerts in your tray for stuff like live blocking emergencies and lots of recent deadlocks
- Currently running queries – you should never be using Activity Monitor again
- Currently running Agent jobs, and how long they take on average & P95
- Graphs for trending CPU, memory, file I/O read & write latencies, TempDB space used & latency, blocking, and more
- Perfmon graphing for the most real-world useful numbers
- A built-in MCP server so you can get AI-powered analysis
I’ve been using the Lite version for the last couple of days in my lab, and I gotta say, I’m struggling to come up with reasons why you would pay for SQL Server performance monitoring software. This app does everything that performance tuners need on a daily basis. I emphasize performance tuners here though, not DBAs, because it doesn’t focus on uptime requirements like troubleshooting backups, outages, Availability Groups, replication, etc.
It doesn’t require much of anything.
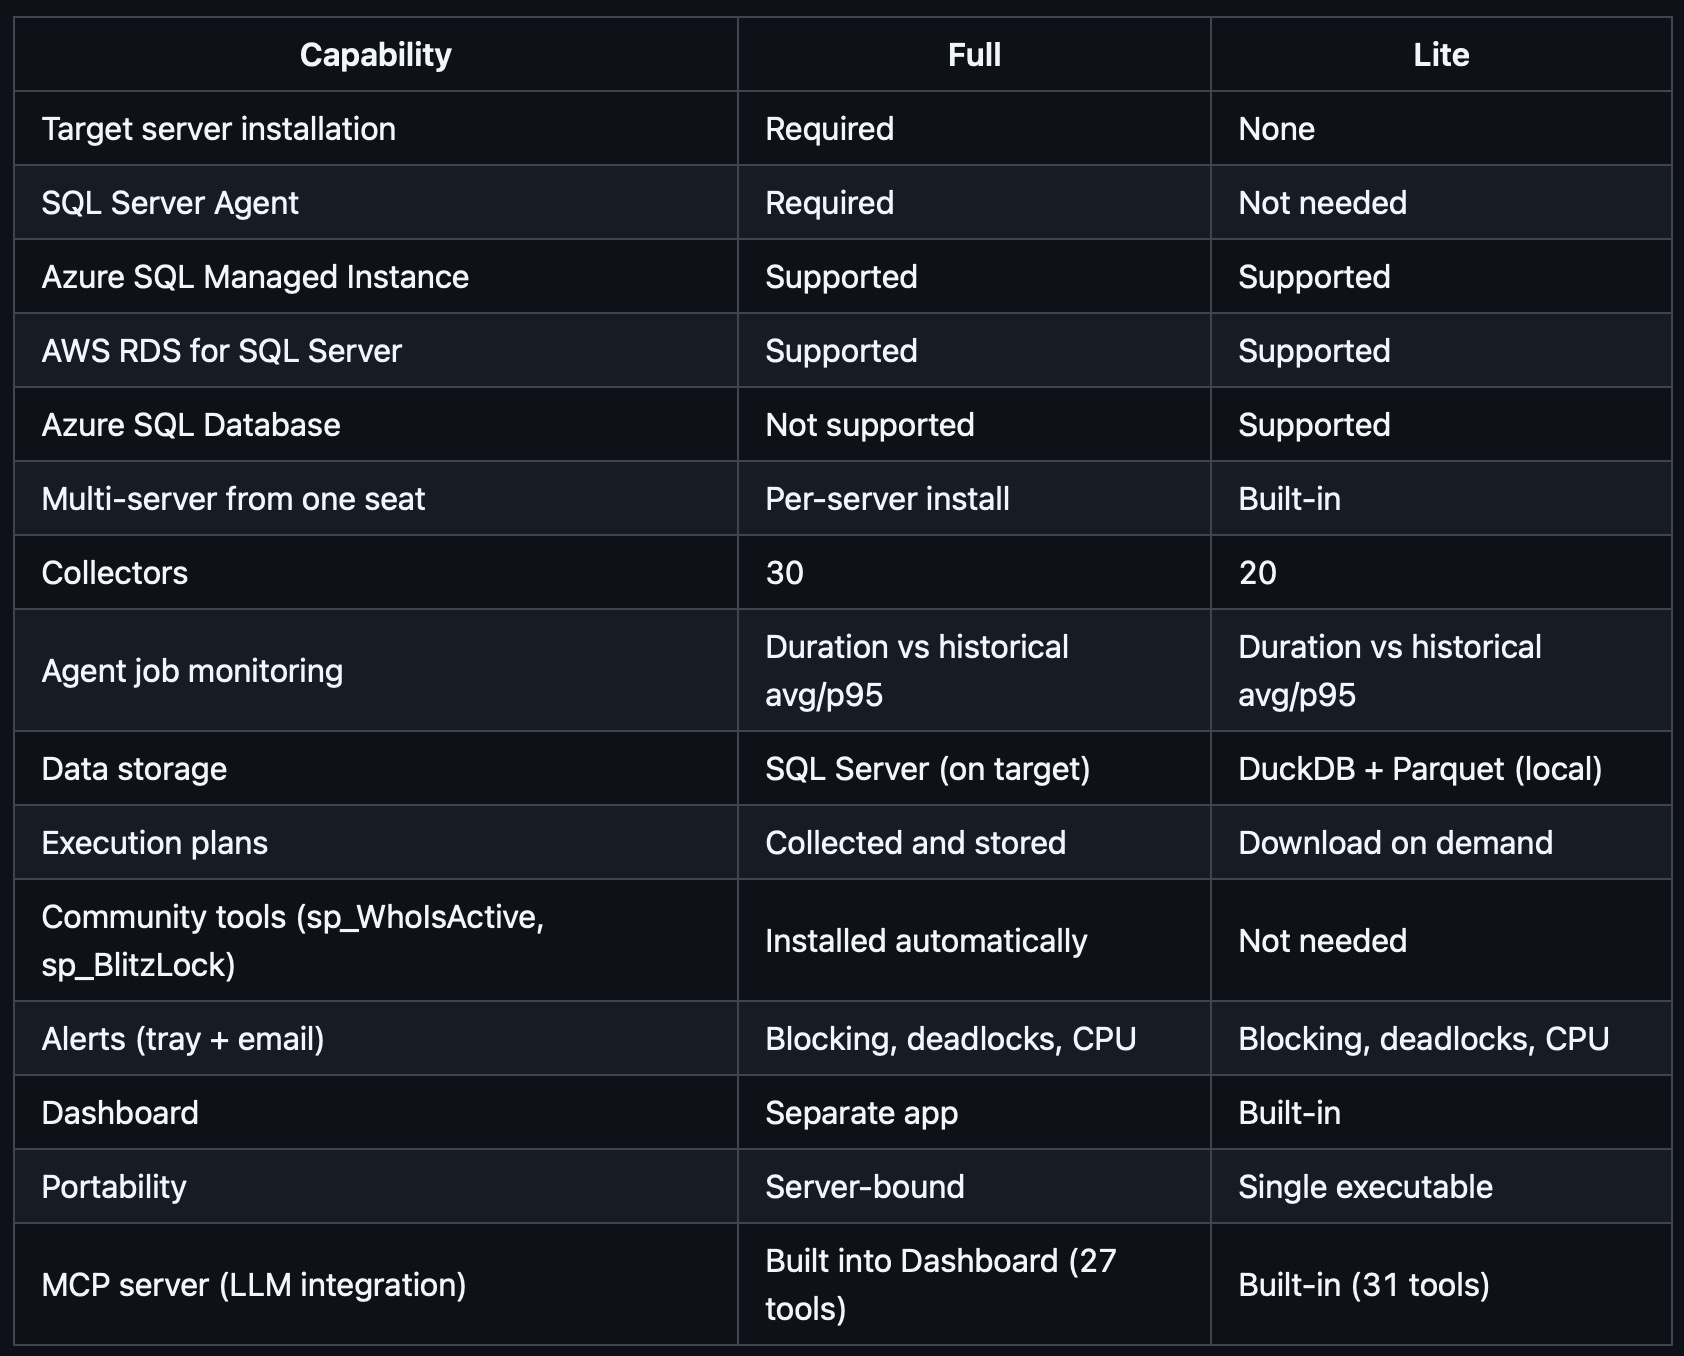
There are two versions: Lite and Full, both free. Lite is a standalone app that runs locally on your desktop/laptop, and doesn’t install anything on the monitored servers whatsoever. It’s a no-brainer. The Full version does require an installation on the monitored SQL Servers, and requires SQL Server Agent. Here’s a grid from the documentation comparing the two versions:
If your full time job focuses on performance tuning SQL Server and Azure SQL DB, and your boss won’t pay for commercial monitoring software, go read the documentation and give it a shot. It’s free and easy.
If you do have commercial performance monitoring software, you shouldn’t abandon it right away, but you should check with your boss to see when the renewal date is coming up. About a month before that point, put a reminder in your calendar to go install SQL Server Performance Monitor to see the current status of the project. Then, use it as a negotiation tactic with your sales reps to say, “We’re thinking about switching to this free tool – why shouldn’t we?” and see if you get a discount. And if not, hey – maybe SQL Server Performance Monitor will be enough for you!
If you’re a consultant who does performance tuning, this tool is a no-brainer because it helps you add value for your clients. You can install it, use it, and teach them how to use it when you’re not around. Unlike a lot of commercial performance monitoring products, it doesn’t try to give BS advice that harms your tuning efforts. (I’ll never forget the monitoring tool that had a big red button saying “free the plan cache” as if that was going to solve a problem.)

4 Comments. Leave new
You’re a “Great Tool, Erik” away from a Great Post, Brent ?
“Erik Darling, the author of sp_Hallengren”
I’ve been testing it out and am impressed! Thank you.
It’s old school C# and WPF too, not a mishmash of node, electron, typescript or other junk
Wish I was still using SQL Server, I’d give this a real hammering