Production DBA
[Video] How Can I Measure If My Database Does More Reads Than Writes?
When someone asks you, “Is this database read-intensive or write-intensive?” you probably look at sys.dm_io_virtual_file_stats to measure the file activity – but that isn’t really correct. After all, your users run a lot of queries all day that are simply satisfied from the buffer pool. SQL Server caches your data so it doesn’t have to hit the disks, but … those are reads, right? (Write? Get it?)
There’s a better way.
SQL Server is constantly tracking how many reads & writes each index gets. You can query sys.dm_db_index_usage_stats and sys.dm_db_index_operational_stats – in this blog post, I’m going to choose the former because it’s a little easier to write about. For the differences between those two and which one you should use when, hit this module of Mastering Index Tuning.
Here are the contents of sys.dm_db_index_usage_stats on my lab server:
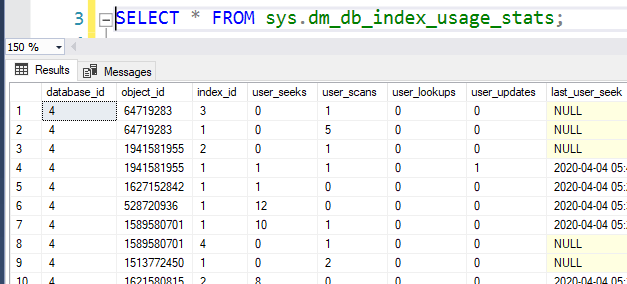
That’s a good start because it shows seeks, scans, lookups, and updates – but we’re only seeing database, object, and index IDs. You, dear reader, probably want a little more data about which databases & tables we’re looking at, so here you go:
|
1 2 3 4 5 6 7 |
SELECT db.name, o.name AS table_name, ix.name AS index_name, (user_seeks + user_scans + user_lookups) AS reads, user_updates AS writes FROM sys.dm_db_index_usage_stats us INNER JOIN sys.databases db ON us.database_id = db.database_id INNER JOIN sys.objects o ON us.object_id = o.object_id INNER JOIN sys.indexes ix ON us.object_id = ix.object_id AND us.index_id = ix.index_id; |
Here are my results:

Oops: we have our first problem. As I was writing this post, I booted up my lab VM for the first time today – it’s a bright eyed 6:14AM Pacific as I write this, being watched by countless strangers. Because my database only has activity in a couple of tables, these numbers only reflect a couple of tables. However, in terms of measuring reads vs writes, I only really wanna know about tables that have had recent activity, so these numbers will work just fine for me.
Next, I probably want to group this data together by database, so here’s a query for that:
|
1 2 3 4 5 6 7 8 9 10 11 12 13 14 |
WITH reads_and_writes AS ( SELECT db.name AS database_name, SUM(user_seeks + user_scans + user_lookups) AS reads, SUM(user_updates) AS writes, SUM(user_seeks + user_scans + user_lookups + user_updates) AS all_activity FROM sys.dm_db_index_usage_stats us INNER JOIN sys.databases db ON us.database_id = db.database_id GROUP BY db.name) SELECT database_name, reads, ((reads * 1.0) / all_activity) * 100 AS reads_percent, writes, ((writes * 1.0) / all_activity) * 100 AS writes_percent FROM reads_and_writes rw ORDER BY database_name; |
Voila:

Some of you are doubtlessly going to say, “Hey Bert, I need this rounded to two decimal places and totaled across the entire server. Please do my job for me.” To which I will reply, “I am busy making coffee, please do the needful.” Instead, I’m going to give you a video of me writing this very blog post:

Related links to keep the training going:
- Which Database is Causing the Problem? – in which I use a few different DMVs to track which database is doing the most work
- sp_BlitzIndex Index Hoarding Warning – if you want to cut the number of writes you’re doing, try dropping unused indexes with sp_BlitzIndex
I’m not going to schedule these ad-hoc live streams ahead of time – it’s just whenever they fit into my schedule – but if you want to be alerted when I start broadcasting, here’s how – I live stream simultaneously in all of these places:
Free, 3× a week
Get my new posts by email
Three posts a week, plus a Monday roundup of the best database news from around the web.
Slightly off topic, but is there a way to use sp_BlitzCache to find which queries are using an Index?
Slightly, huh? 😉 This isn’t really a good place for tech support for unrelated questions. Hit the readme file for where to get support. Thanks for understanding!
haha, I have alot of dead databases, getting divide by zero error. Running the query in the cte, I see zero activity. This is a third party application. There are some databases used only to point to their new schema that they implemented in a rewrite to .NET
Hi Brent,
I am a big fan you. I love watching your blogs everyday!!!
There is a glitch in the second query if you run the this query against a database which is not your targeted database .
This query woks perfectly fine if an object_ID is unique across the database instance ( Which is not true ). For example if we have a same object_ID in more than one database and want to check Reads/writes on any database ( other than Querying database ) by using a where clause (db.name= mydatabase ), it end up showing unintended results. Result shows targeted database name but Reads/Writes for the database against which we ran the query. Below is the result for just one specific object and it is showing same object_ID for 3 databases.
name table_name index_name reads writes object_id
tempdb paarInvcHdr PK__paarInvcHdr__1920BF5C 44 2108 373576369
MyDatabase paarInvcHdr PK__paarInvcHdr__1920BF5C 160 0 373576369
msdb paarInvcHdr PK__paarInvcHdr__1920BF5C 36648 10 373576369
we end up getting Index names from targeted database (filtered database ) and Reads/Writes from the databases against which we are running the query.
Targeted database as well as Querying database must be name same in order to get the correct result. We cannot get the result for all databases by running this query in any particular database.
My table messed up here after posting!!!
Your site is very cool, i have bookmarked it.
Great catch Yogish, I am just happy having a general idea of all databases read and writes on an SQL instance for the moment. I just rounded the results to get two decimal places, like some people asked during the recording of the video and also added a little check to avoid divide by zero when there were no reads for a database, this is not rare but can happen, it happened to me.
WITH reads_and_writes AS (
SELECT db.name AS database_name,
SUM(user_seeks + user_scans + user_lookups) AS reads,
SUM(user_updates) AS writes,
SUM(user_seeks + user_scans + user_lookups + user_updates) AS all_activity
FROM sys.dm_db_index_usage_stats us
INNER JOIN sys.databases db ON us.database_id = db.database_id
GROUP BY db.name)
SELECT database_name, reads,
ROUND(((reads * 1.0) / all_activity) * 100,2) AS reads_percent,
writes,
ROUND(((writes * 1.0) / all_activity) * 100,2) AS writes_percent
FROM reads_and_writes rw
WHERE reads > 0 — To avoid divide by Zero
ORDER BY database_name;
Hi Brent,
Not sure how accurate this query is for a couple reasons:
1) [user_updates] represents number of operations, not number of rows affected. So a statement that updates a million rows shows up as 1 operation.
2) [user_scans] can be scanning a massive table. According to the query, a seek/scan/lookup all have the same weight – although in terms of data scanned, can be very different.
So in terms of actual data read/written – this wouldn’t be accurate. Perhaps total logical reads / writes of all plans in the database might be a better fit?
Andrew – errr, I don’t think that’d be too accurate either, since plans disappear from memory, get recompiled, and you can have cross-database joins.
My opinion is that sometimes you do not need exact information about these type things. Sometimes you only want to see trends and behaviors to have a better idea where things are either for monitoring purposes, policy guidance, or just simple curiosity, like we all know “It depends”. To me ,database administration is not an exact science but a beautiful art.
Hello Brent,
How can I know my Load is IO bound or CPU bound. through query
Hi Jitesh. I teach that in my Fundamentals of Server Tuning class. Here’s the relevant module: https://www.brentozar.com/training/diagnosing-slow-sql-servers-wait-stats/1-measure-change-sql-server-3-metrics-gather-23-minutes/
so for storage testing with Microsoft Disk Spd tool on each logical drives can we use these Read and write percentages ratio specially when upgrade a SQL Server to new Server . Please advice
Ishtiaq – this post isn’t really about that. Your best bet for advice on DiskSpd would be to hit a Q&A site like https://dba.stackexchange.com or https://sqlservercentral.com.
How to change the read/write ratio of sysbench oltp_read_write script?
I have no idea.
Does not get result for tempdb.