
#TSQL2sday: How Much Plan Cache History Do You Have?
For this month’s T-SQL Tuesday, Bert Wagner asked, “What code have you written that you would hate to live without?”
 I bet you think I’m going to say sp_Blitz, and I would indeed hate to live without that, but you already know about that one, dear reader. Lemme show you something else cool.
Before I run sp_BlitzCache to analyze which queries have been the most resource-intensive, I wanna know, “How much query plan history does SQL Server have available?” Looking at the top 10 plans in the cache doesn’t do me much good if:
- Someone restarted the server recently
- Someone ran DBCC FREEPROCCACHE
- Somebody’s addicted to rebuilding indexes and updating stats (which invalidates plans for all affected objects)
- The server’s under extreme memory pressure
- The developers aren’t parameterizing their queries
- The app has an old version of NHibernate with the parameterization bug
- The .NET app calls .Parameters.Add without setting the parameter size
I could go on and on – there are so many things that give SQL Server amnesia. So here’s how I check:
|
1 2 3 4 5 6 7 8 9 10 11 12 13 14 |
SELECT TOP 50 creation_date = CAST(creation_time AS date), creation_hour = CASE WHEN CAST(creation_time AS date) <> CAST(GETDATE() AS date) THEN 0 ELSE DATEPART(hh, creation_time) END, SUM(1) AS plans FROM sys.dm_exec_query_stats GROUP BY CAST(creation_time AS date), CASE WHEN CAST(creation_time AS date) <> CAST(GETDATE() AS date) THEN 0 ELSE DATEPART(hh, creation_time) END ORDER BY 1 DESC, 2 DESC |
Here are the results on a server that just restarted:

That means:
- We have 53 cached plans that were created in the 6AM hour today
- We have 412 that were created in the 5AM hour
In that environment, sp_BlitzCache is gonna be much less useful. However, let’s look at data from June 27th for a stable server that’s been up for a long time – shown in Excel because we have a tool that automatically grabs query data for us and puts it in spreadsheets:
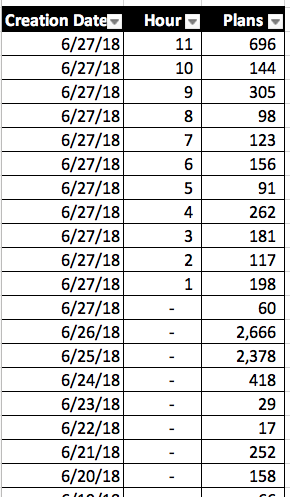
The query breaks up results into hours for today, but then older than today, it just groups stuff into whole days. (After all, I don’t care what hour a query was compiled on two days ago.) On that server, I can be pretty confident when I query the plan cache – I’ve got a lot of history. There are still new queries coming in, and I may be facing some non-parameterized one-off issues, but it’s not that bad.
This one is a little more curious – it was collected on June 25th:
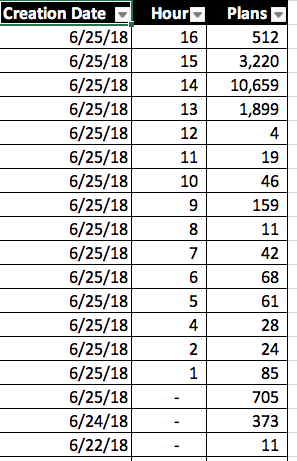
We do have valid query plans going all the way back to June 22 – meaning, no one has run FREEPROCCACHE – but there are only about 1,000 plans from prior to the current date (June 25.) The vast majority of cached plans are from today, and furthermore, there were over ten thousand new plans generated in the 14:00 hour!
This might indicate that:
- Someone rebuilt a ton of indexes around noon-13:00
- We have an application that isn’t parameterizing its queries, and is sending in a flood of single-use strings, and SQL Server is flushing them out of memory (and no, Optimize for Ad Hoc doesn’t fix that)
This query doesn’t give me the answers, mind you – it just helps me ask better questions, faster. Hope it helps you too! You’re free to use that for any purpose – here’s a Github Gist with the code & license.

22 Comments. Leave new
Brent, PlanCache is all very fine, but what about QueryStore? It holds even most (all?) flushed plans, and I’ve been surprised or horrified or impressed or something by how many versions of every darned statement, it seems to hold.
Yeah, you probably have ALL turned on: https://www.brentozar.com/archive/2018/12/query-store-and-cruel-defaults/
Azure SQL. Not my choice, afaik.
Gotcha. For that, head on over to the fine folks at https://Microsoft.com. 😉
Wow! Discovered that every query in our software has this issue “The .NET app calls .Parameters.Add without setting the parameter size”. Just instructed the developers to change the way they add Parameters ton queries but it’s gonna take a long time before it goes in production.. Hopefully my plan cache is gonna get better one day 😉
Hi Brent,
in my scenario, over 50% of the plans were created in the last 2hrs…
Work in progress on these two points:
– The developers aren’t parameterizing their queries
– The .NET app calls .Parameters.Add without setting the parameter size
I also noticed many statistics updated several times a day (50+times). It’s -update stats because no index rebuild nor update stats are scheduled during the day.
So.. what’s happening is
1- update statistics runs and updates stats
2- some plans flushed out
3- new plans created
4- GOTO 1
Would you suggest any action to mitigate this situation?
Alberto – for personalized help with production servers, click Consulting at the top of the screen, or check out my Mastering Server Tuning training class.
Thanks Brent 🙂
I’m running the query to see how many plans are created per hour/day. When I ran it at 7am, it showed over 40K for the date of 10/14, but when I run it again, the number has decreased, and every time I run the number for 10/14 gets smaller. I’m confused why the number for a previous day would continue to change?
Because you have a limited amount of memory, and SQL Server is aging out the older plans to make room for the newer ones.
Brent, does the dm_exec_query_stats return one row per query statement? Does that mean when we see the same query multiple times in the results that we need to also compare the plan_handle to see whether the plan was reused or a new plan was compiled for this query?
Lyuben – click the links in the first half of the post to learn what you need to do. Cheers!
Brent, thank you for your answer. My question was regarding the query you run to see the plan cache history. Does a row in dm_exec_query_stats means that a new query plan was generated for that statement? If two queries have the same plan_handle does it mean the query was recompiled and we got the same plan or that the previously generated plan got reused?
Lyuben, I am taking time out of my day to write the blog post and answer your questions. Now, I need you to be equally invested and actually LISTEN to what I’m saying.
Please click on the links through the post and they will literally tell you what each part of the query is doing and what it means.
Further comments here without reading those links will not be productive. Thank you for understanding.
Figured it out. Thanks for your great posts and cources!
My pleasure! Glad it helped.
Hello Brent, I’ve had problems with query plans changing in our data warehouse and the new plans are nearly always abysmal. I used the execution plan XML to find which statistics it was using to develop the plan and refreshed those stats. Afterwards it would generally revert back to the previous plan that ran well or gen up a better one. Every day I chased several misbehaving load jobs and ran stats. I got sick of chasing my tail so I built a job that examined when stats were last refreshed, and how many records were modified since that refresh. Then if it breached thresholds ie. More than 5 days since last refresh, > 10 million records modified, or > 1% modified I would have it refresh stats using different samplings depending on record counts. Though I’ve spent some time refining my thresholds they are probably still too liberal. Unfortunately, the changes I made were in response to problems which went away after the change so I’m sure many fell into the net that didn’t need to be done. Believe me I really am going somewhere with this… Today I ran sp_BlitzCache and it said: “You have 4142 total plans in your cache, with 100.00% plans created in the past 24 hours, 13.00% created in the past 4 hours, and 10.00% created in the past 1 hour. When these percentages are high, it may be a sign of memory pressure or plan cache instability.” The server is currently running better than it ever has – should I try and do something about my plan cache or is this just another idiosyncrasy of data warehousing?
Mike – for personalized help on a specific server’s production issues, click Consulting at the top of the site. Hope that’s fair!
First Responder Kit
sp_blitzcache priority 1… i went to the link …it does not explain how to get rid of that
nadav – the problem is that you have to actually *read the post*, which also includes the links that I put in there.
For The, .NET app calls .Parameters.Add without setting the parameter size, I assume this is also for SELECT queries and not just UPDATE and INSERT.
It’s quite fun running this across several days, and seeing how the plans age out of the cache. Had I just run it on one day – I’d have been convinced that there’d been a sudden leap in plan creation activity over the previous two days, whereas, with data from 22nd, 24th & 27th Oct, seeing that plans are also ageing out is much easier.