
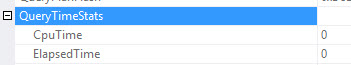
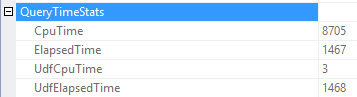
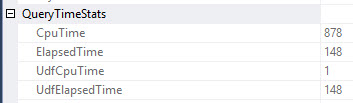
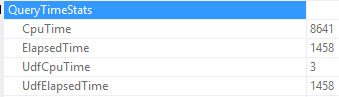
If a query uses one or more user-defined scalar functions (such as T-SQL functions or CLR functions), a significant portion of query execution time may be spent inside those functions, depending on the function definition. This may be not immediately obvious by looking at the query execution plan. This update adds two new attributes to QueryTimeStats: UdfCpuTime and UdfElapsedTime. These provide the total CPU and elapsed time that is spent inside all scalar user-defined functions (in milliseconds) during the execution of a query.
This sounds cool, right? It doesn’t help you if you’re not on SQL Server 2017 and looking at:
- Estimated plans
- Live query plans
- Cached plans
- Query Store plans
Why this is good for you: There will be no bugs for this feature in sp_BlitzCache or sp_BlitzQueryStore!
Why this is bad for you: You have to run the query and collect the actual plan.
If the UDF is buried in a query that’s buried in a nested view that’s buried in stored procedure that’s called by another stored procedure, this could still be time consuming to track down. You can either ctrl+f through the XML, or look at the properties of every select operator. Fun, right?
Note: This is not automated, nor corrected automatically. Yet. God save the DBA.
Where can you see it?
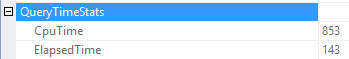
It’s in the plan XML, and in at least v17.4 of SSMS. If you hit f4 and highlight the select operator in your plan, you can drill down to the QueryTimeStats node.


4 Comments. Leave new
Oops, Microsoft did it again. Thanks Erik!
As a guy who has shipped broken features, I’m not terribly upset. I just didn’t want anyone to start using it and think their functions were functioning.
Hey Erik, thanks for finding the bug. Sorry about this.
Can you please send me a repro? (which DB was this in?)
We’ll get this sorted ASAP.
And again, appreciate if you ping me on these things. Reason I found it is I was told to look here. 🙂