Monte Carlo Or Bust
In Part 3, I showed you how two queries with TOP clauses can produce wildly different plans.
To figure some stuff out about why the plans changed, let’s focus on the Nested Loops Join plan.
Why? Because when I force the Hash Join plan, the results are no different. I get the same plan and costing, and close enough row estimates.
I think it’s actually the better plan, and don’t see a need to poke holes in it by disabling parallelism, or the use of a Bitmap Filter in the plan.
There’s a good write up on Bitmap Filters by Paul White here (make sure to read the links at the end of the article, too), and another by Joe Obbish here, geared towards CoLuM nStOrE (I have no idea how to capitalize or space this term anymore).
Fruit Loops
Here’s the plan for our TOP 2 query.
Now, here’s the plan for our TOP 3 query with a Loop Join forced.

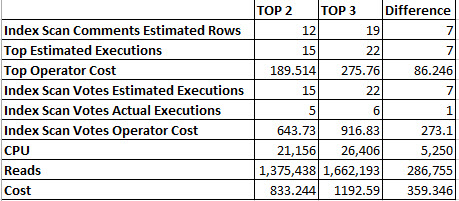
Side by side, or head to head, the plans look nearly identical, but where they differ is interesting!
A seven row difference in estimated rows carries across the plan. The optimizer takes those 7 additional rows and costs operators with multiple executions to match.

The TOP operator is costed at around 12.5 Query Bucks per execution, and the Index Scan is costed at around 42 Query Bucks per execution.
Even though they each only end up executing one additional time (5 vs. 6), the additional estimated executions are enough to push the TOP 3 query towards the Hash Match plan.
That plan had a cost of 869 Query Bucks, which makes the decision a no brainer — a difference of 323 Query Bucks! In this case, the optimizer is (I believe, anyway) correct in choosing the Hash Match plan. The cost of one more execution of the TOP operator is apparent in CPU and Reads.
The TOP 3 plan uses about 5 additional second of CPU time, and does nearly 290k more reads. Both of these plans have the additional misfortune of running serially, compared to the Hash Match plan.
If we force both queries to run in parallel, it’s easy, and unfortunate, to see why. The optimizer chose a Backwards Scan of the index on Comments, and the additional operator (Distribute Streams) necessary to parallelize the query downstream pushed the parallel plan cost just slightly higher than the serial plan cost.
While this adds to CPU use and Reads, it reduces elapsed times by about 8 seconds. Which is… I mean, that’s what you want a parallel query to do.
Rightly Wrongly
The sticky part to me here is that this kind of issue is difficult to track down, even with the new Row Goal information added to query plans.
In situations where this goes wrong, it can go spectacularly wrong. This isn’t a new subject. It’s been talked about for ages.
But strangely, fixing it hasn’t been automated.
Thanks for reading!
Brent says: Building a query plan is hard, I get it, and I’m really looking forward to seeing how Microsoft experiments in areas like this. In the cloud, where Azure SQL DB can be tweaked and tuned constantly, it makes sense to build a next generation version of the optimizer that revisits plans over the past, when your server is idle, and tries running different experiments. But seeing stuff like this here – I’m just not jealous of the folks who have to build engines to make these kinds of guesses before the query is run. This stuff gets so complex fast.

