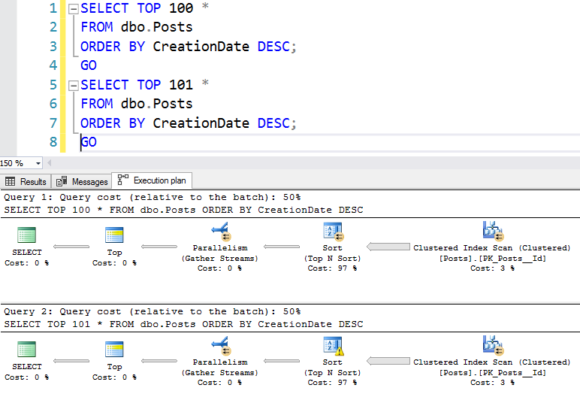
Earlier this week, I showed you two nearly identical queries and their estimated plans:

They look pretty darned identical – so how much worse can one query be? Here’s how much worse:
- Top 100: 51.0 seconds duration, 141.6 seconds CPU time
- Top 101: 160.0 seconds duration, 244.0 seconds CPU time
That’s right: adding just one row made the query take over three times longer. Let’s investigate the actual plans:

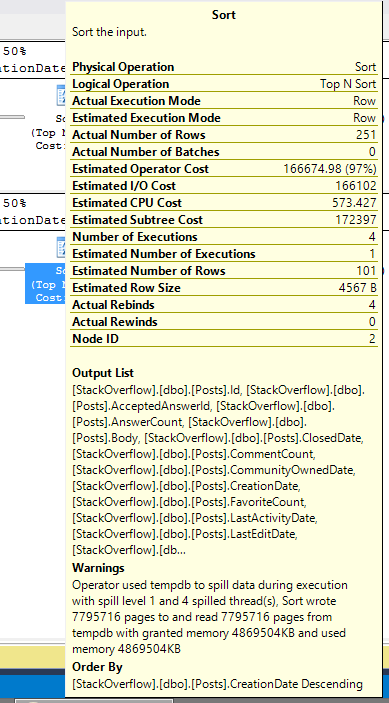
The TOP 101’s sort spills to disk – and it’s tempting to call that the root cause, because we all know spilling to disk is going to be slower. Hover your mouse over the sort, and you can see the spill details:

But just one row couldn’t cause a spill to disk by itself, would it? Surely SQL Server estimated enough memory in order to handle just one extra row coming back.
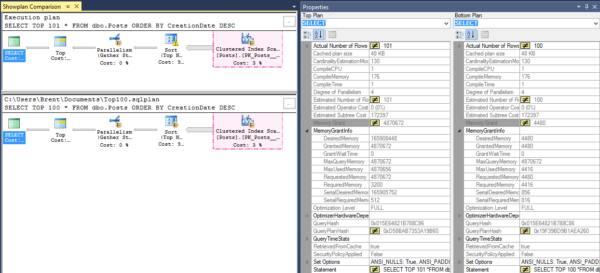
Dig a little deeper, and look at the amount of memory desired for each query. You can see this (in both the estimated and actual plans by right-clicking on the SELECT operator in the plan, click Properties, and head over to the right side properties window under Memory Grant Info. Here’s a summary:

Gulp. I’m running a SQL Server VM with max server memory at 26,000, and this one TOP 101 query all by itself grabs 5GB of my memory – and holds it for the entire 2-minute duration of the query!
But why are the memory grants so different?
As Geoff Patterson pointed out in Part 1’s comments, SQL Server uses one sorting method for TOP 1-100 rows, and a different one for 101+ rows! Back in 2010, Paul White blogged about this TOP 100/101 problem and how even different data types can influence the memory grants.
Query authors rarely know this magic tipping point, so I see folks writing SELECT TOP 200 or SELECT TOP 1000 without understanding the additional cost. (And it’s not that TOP 100 is faster 100% of the time, either – read Paul’s post for an example where it’s actually slower.)
Query tuners rarely know it either, and they can’t spot it just by glancing at the execution plan. There’s nothing in the plan that clues you in to a different sort method – you just get a plain ol’ sort operator, and that’s it.
Thanks to the SQL Server team’s efforts lately, this kind of problem is much easier to spot.
How to Spot The Problem Faster in 2012+
First, get on a current patch level for 2012/2014/2016. Microsoft added memory grant details in the 2012 SP3 DMVs.
Then, get on SSMS 2017, too. If you’re lucky enough to have the actual plans for each query, you can also see this with the compare-showplan feature:

If you’re not that lucky – and I rarely am – then you probably have to troubleshoot it live as it’s happening, but without running the queries. In this case, check out sp_BlitzFirst @ExpertMode = 1, and/or sp_BlitzWho – both of which show you running queries, what memory grants they’ve picked up, and which queries are still waiting for memory grants:

Wanna learn more of this stuff?
Erik and I will be covering these DMVs and the ways we use ’em in our Summit 2017 pre-con, Expert Performance Tuning for SQL Server 2016 & 2017. There’s over 200 seats sold, but there’s still seats available – get yours before they sell out.

