
sp_BlitzFirst @SinceStartup = 1 Shows You Wait Stats Since, Uh, Startup
It’s this easy to get a cumulative recap of wait stats, file stats, and Perfmon counters:
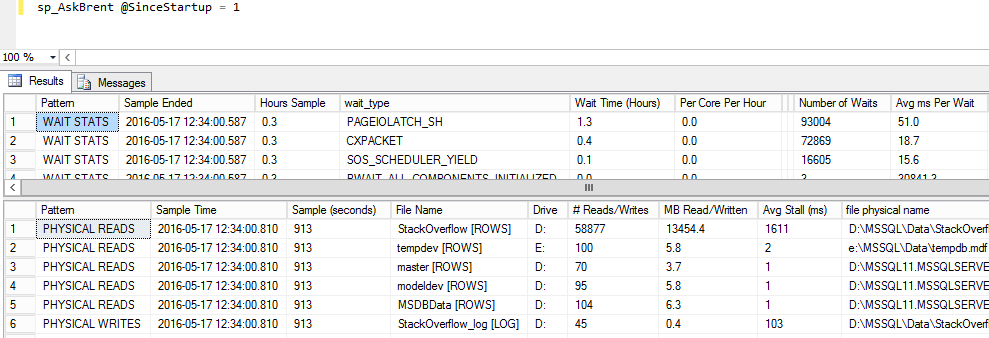
In the above example, here’s what the wait stats columns mean:
- Sample Ended – when it ran
- Hours Sample – the number of hours your SQL Server instance has been up
- wait_type – the name of the wait stat
- Wait Time (Hours) – in descending order, with the biggest waits first
- Per Core Per Hour – this is SQL Server’s tachometer
- Number of Waits and Avg ms Per Wait – sometimes waits strike all the time in small increments, but sometimes (like locking) they show up in small quantities, but very long times
If you want to see wait stats right now, just use it without any parameters:

First, you get the top result set – a snapshot of what queries are running right now. Then sp_BlitzFirst takes a 5-second sample of your current waits, and returns a headline news set of what performance issues you’re facing right now.
Go grab the latest release of our First Responder Kit and start troubleshooting performance the easy way.
