Or perhaps another way to phrase that is, Microsoft is up to something with parallelism. I don’t know how long it’s been this way – could even be since the launch of Azure SQL DB Serverless – but I just now noticed it while helping a client with a slow query.
When you view an actual execution plan for a parallel query in SQL Server 2022 & prior, and in regular Azure SQL DB, you can right-click on an operator to see how the work is broken up across threads:
This is useful when you’re troubleshooting problems with unbalanced parallelism. In Azure SQL DB Serverless, though, query plans no longer break up work by thread:
We just get one number for “All threads”. (Disregard the different number of reads & rows between screenshots – I’m working with different databases across the different versions.)
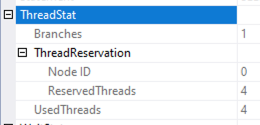
Similarly, in the boxed product, as the cool kids say, there’s a thread stats section for the plan overall:
It’s useful for seeing how many cores got involved, and how many branches of the query were able to execute simultaneously. Azure SQL DB Serverless? Not so much:
That’s it – I didn’t cut the screenshot off, that’s just where that window ends. (Same thing in the XML of the plan – there’s no additional details on parallelism.)
In a magical ideal world, I’d hope this lack of details is an indication that Microsoft is working on parallelism performance improvements. Perhaps, like our inability to set Cost Threshold for Parallelism in Azure SQL DB, it’s a sign that soon, things will Just Work™ without us having to configure anything or monitor anything. I would even love to see the number of cores change dynamically during query runtime, based on how much data was moving through the plan.
Back here in this world, the world where I somehow managed to fall into my pool, I don’t think we’re anywhere near that promised land. After all, I’m writing this post because a client was hitting parallelism performance issues in Azure SQL DB. In this client’s case, I used the same fixes I discuss in this Mastering Query Tuning module. We couldn’t use Azure’s execution plans to verify that work was better balanced across threads, but the dramatically reduced runtimes were more than enough proof.


3 Comments. Leave new
In a magical world Microsoft would figure out that parallelism is hurting clients most of the time – mostly in OLTP applications with small query results. I worked for a company that told their clients for our app set MAXDOP to 1 on the database/server level because it is beter for performance. (The application base code was ancient as well :D)
Oh well, we’ll one day dogs will fly…
The default Cost Threshold for Parallelism = 5 is just such an incredibly bad idea today.
Completely true, in that magical world Microsoft would set the default Cost Threshold for Parallelism at 50 (some guy *wink* *wink* recommended that as a way beter default) so you don’t get parallel plans all the time for small queries. And then tune it based on the load and requirements.