Is Cost Threshold for Parallelism Measured in Seconds?
SQL Server automatically chooses when to divide your query’s work across multiple CPU cores. It makes that decision based on your query’s cost.
To see it, let’s throw 1,000,000 tiny rows in a table:
Transact-SQL
|
1 2 3 4 5 6 |
CREATE TABLE dbo.Timeless(ID INT IDENTITY(1,1) PRIMARY KEY CLUSTERED, Stuffing VARCHAR(20)); INSERT INTO dbo.Timeless (Stuffing) SELECT TOP 1000000 'Stuff' FROM sys.all_columns ac1 CROSS JOIN sys.all_columns ac2; GO |
And with my server set at SQL Server’s default settings (Cost Threshold of 5, MAXDOP of 0), count how many rows the table has:
Transact-SQL
|
1 2 |
SET STATISTICS IO, TIME ON; SELECT COUNT(*) FROM dbo.Timeless; |
Statistics IO & time show that the query is blazingly fast, able to scan 4,545 8KB pages in about 108 milliseconds of CPU time:
Transact-SQL
|
1 2 3 4 5 6 7 8 |
Table 'Timeless'. Scan count 5, logical reads 4545, physical reads 0, read-ahead reads 0, lob logical reads 0, lob physical reads 0, lob read-ahead reads 0. (1 row affected) SQL Server Execution Times: CPU time = 108 ms, elapsed time = 46 ms. |
Note that CPU time is higher than clock time – that means the work was parallelized across multiple cores. You can see it in the actual query plan, which includes a parallelism operator, plus the clustered index scan and stream aggregate have those cool parallelism racing stripes, as Erik likes to say.
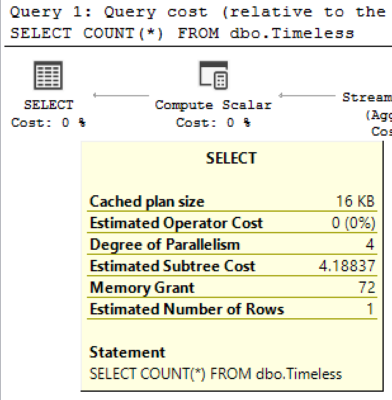
If you hover over the select in the plan, you’ll see that the query plan’s cost is only 4.18:

That might seem confusing – after all, SQL Server’s default Cost Threshold for Parallelism is 5, and that’s higher than 4. Why did this query go parallel? To understand, let’s run the query throttled down to just one core:
Transact-SQL
|
1 |
SELECT COUNT(*) FROM dbo.Timeless OPTION (MAXDOP 1); |
It’s still blazing fast:
Transact-SQL
|
1 2 3 4 5 6 7 8 |
Table 'Timeless'. Scan count 1, logical reads 4483, physical reads 0, read-ahead reads 0, lob logical reads 0, lob physical reads 0, lob read-ahead reads 0. (1 row affected) SQL Server Execution Times: CPU time = 78 ms, elapsed time = 77 ms. |
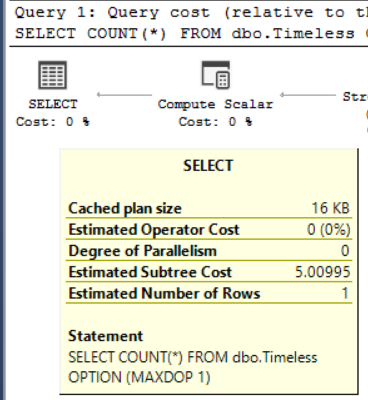
It uses even less CPU time – because there is an overhead to running queries with parallelism – but it did end up using a little more clock time overall. So what’s the query cost from the actual query plan?

The serial plan’s cost was juuuust over 5, so when building the plan, SQL Server decided to put a little more time in and build a query plan that would cost less query bucks – by leveraging The Magic of Parallelism™.
Cost Threshold for Parallelism
uses the same measurement units as
Estimated Subtree Cost.
When you see a query with Estimated Subtree Cost of 5.00995, that doesn’t mean SQL Server thinks the query is going to take 5 seconds. After all, our queries here are finishing in less than 100 MILLISECONDS.
A long, long time ago, one Microsoft developer tied query costs to his computer. Those days are long gone. We’re still using the same measurements for what a query costs, but just as time has moved on, so have computer capabilities. A query that took 5 seconds in 1998 simply doesn’t twenty years later, and Microsoft hasn’t been adjusting costs to match today’s hardware capabilities.
Estimated Subtree Cost is just an abstract measurement of CPU and IO work involved in building a query. To drive home that it’s completely and utterly unrelated to time, Kendra Little coined (see what I did there) the term Query Bucks. When we designed the paper version, we enshrined her as the face of the fiver, SQL Server’s default cost to make a query go parallel:

You can print your own query bucks out too. Enjoy!
Related

Hi! I’m Brent Ozar.
I make Microsoft SQL Server go faster. I love teaching, travel, cars, and laughing. I’m based out of Las Vegas. He/him. I teach SQL Server training classes, or if you haven’t got time for the pain, I’m available for consulting too.
Get Free SQL Stuff
"*" indicates required fields

2 Comments. Leave new
What a great post, thanks for sharing it! 😀
I’ll never look at a $5 bill the same Kendra. :^)
thanks