So You Wanna Debug SQL Server Part 2
Birth Control
Debugging, and, heck, even learning about debugging, is a time-consuming and often unhelpful process when it comes to tracking down issues in SQL Server. It is arduous and tedious, and yields little chance of making you any friends. So why write about it?
Mostly because no one else is willing to — at least not in the context of SQL Server. And, let’s face it, “vibrant social life” has been used to describe me exactly zero times Kelvin.
In Part One, I talked about the basics of getting WinDbg set up, and attaching it to your local (please for the love of all that’s from Islay don’t attach it to a production server) instance. The next logical thing to do is get interacting with SQL Server.
Point Break
It’s customary to yell I AM AN FBI AGENT whenever you set a break point in WinDbg. This guarantees you success, long life, and ten cent wings wherever you dine. The break point commands we care about right now are:
- bp: set a break point
- bu: set a break point on a pattern
- bl: list break points
- bc: clear break points
After you follow instructions below to set a break point, you should use these to examine and undo it. Heck, even set your own.
But where do you set a break point, and what happens when you hit one?
To answer those questions, we need to go back to the x command — x means we want to examine available symbols.
I say it really doesn’t matter where I put my finger
When I first open up WinDbg, I like to get symbols for a few different code paths
- sqlmin
- sqllang
- sqldk
- sqlos
- sqlservr
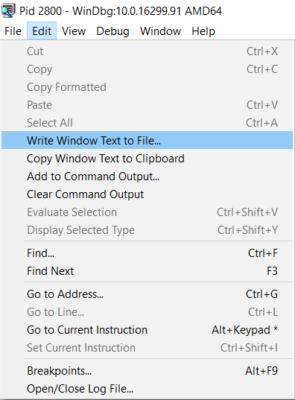
Under sqlmin is where most of the query related stuff lives. To make your life a little easier, you can output window contents to a text file!

That lets you come back to the output and search through it a little easier. So if you choose a log file, and then run x /n sqlmin!, you should end up with a text file of all the public break points sorted by name. Fair warning: this can be slow. There are a lot of them.
I’m gonna save you a little bit of time, though. A lot of the interesting stuff that happens when a query runs is under sqlmin!CQScan, so if you run x /n sqlmin!CQScan*, you’ll get just that subset of break points.
Why do we care about this? Because when setting your first breakpoints, it helps to set one that you can trigger early on in a query to get used to what it looks like.
Almost nothing occurs sooner in the break point path than a TOP expression. Knowing that, we can narrow things down even further, to x sqlmin!CQScanTop*, or even x sqlmin!CQScanTopNew*.
Setting an early break point based on TOP would look something like this: bp sqlmin!CQScanTopNew::Open, and we can trigger that with an easy query.
Transact-SQL
|
1 2 |
SELECT TOP 1 * FROM sys.databases AS d; |
Which, if you’ve done most things right, will get you some output that looks something like this!

Here’s where you’re gonna start to hate the debugger.
Tedium ad nausea
Once you hit that break point, your query is just gonna sit there. You now have the ability to step through every public instruction that the query calls while it runs. This is, not surprisingly, a lot of instructions.
You can hit F5 to end debugging and pass control back to the program, or hit F10 to start stepping through instructions.
This should give you enough to play with until next time, when I’ll talk about tracing calls, and how to find SQL Server exposing dirty little secrets.
Thanks for reading!
Related

Hi! I’m Brent Ozar.
I make Microsoft SQL Server go faster. I love teaching, travel, cars, and laughing. I’m based out of Las Vegas. He/him. I teach SQL Server training classes, or if you haven’t got time for the pain, I’m available for consulting too.
Get Free SQL Stuff
"*" indicates required fields

2 Comments. Leave new
Thanks you!
Looking forward to what other goodies you expose in this series. Thanks!