
How many CPUs is my parallel query using in SQL Server?
Parallelism can be confusing. A single query can have multiple operators that run at the same time. Each of these operators may decide to use multiple threads.
You set SQL Server’s “max degree of parallelism” to control the number of processors that can be used, but it’s not immediately obvious what this means. Does this setting limit the total number of CPU cores the entire query statement can use? Or does it limit the total number of CPU cores that a single parallel operator within the query can use?
Good news: we can see how it works by running a simple test query and looking at some SQL Server DMVs.
My parallelism test setup
This test is run against a virtualized SQL Server with 4 virtual CPUs. SQL Server’s “max degree of parallelism” setting is at 2. My test instance is on SQL Server 2014.
My simple parallel query
All of my observations are taken while running the following test query against a restored copy of the StackOverflow database. I have ‘actual execution’ plans turned on so that when I query sys.dm_exec_query_profiles, I get some interesting details back.
|
1 2 3 4 |
SELECT p.Id, a.Id FROM dbo.Posts as p JOIN dbo.Posts as a on p.AcceptedAnswerId=a.Id; GO |
Here’s what the execution plan looks like:
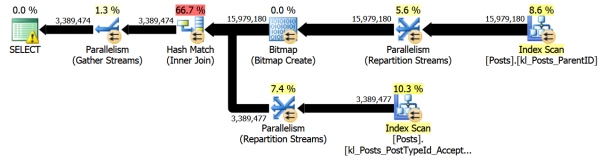
The plan has seven operators with parallel indicators. Two of those operators are scanning nonclustered indexes on the Posts table.
The question we’re exploring here is whether the scans of those nonclustered indexes will use multiple threads that share the same two CPU cores, or whether they will each get two different CPU cores (and use all four).
Starting simple: tasks and workers
While my parallel ‘Posts’ query is executing on session 53, I can spy on it by querying SQL Server’s DMVs from another session:
|
1 2 3 4 5 6 7 8 9 10 11 |
select ost.session_id, ost.scheduler_id, w.worker_address, ost.task_state, wt.wait_type, wt.wait_duration_ms from sys.dm_os_tasks ost left join sys.dm_os_workers w on ost.worker_address=w.worker_address left join sys.dm_os_waiting_tasks wt on w.task_address=wt.waiting_task_address where ost.session_id=53 order by scheduler_id; |
Here are a sample of the results:

The scheduler_id column is key. Each scheduler is mapped to one of my virtual CPU cores. My query is using 2 virtual CPU cores. At this moment I have two tasks on scheduler_id 0, and three tasks on scheduler_id 2.
But why leave it at that, when we can overcomplicate things? Let’s poke around a little more.
dm_exec_query_profiles and query plan nodes
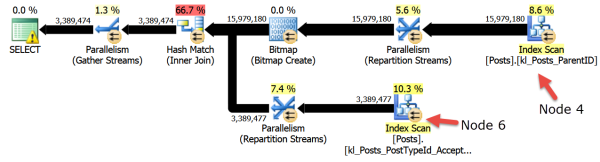
There’s one more thing you need to know about our query plan. Each node in the plan has a number. The index scans are node 4 and node 6:
If I run my query with ‘actual execution plans’ enabled, I can spy on my query using the sys.dm_exec_query_profiles DMV like this:
|
1 2 3 4 5 6 7 8 9 10 11 12 13 14 15 16 |
select ost.session_id, ost.scheduler_id, w.worker_address, qp.node_id, qp.physical_operator_name, ost.task_state, wt.wait_type, wt.wait_duration_ms, qp.cpu_time_ms from sys.dm_os_tasks ost left join sys.dm_os_workers w on ost.worker_address=w.worker_address left join sys.dm_os_waiting_tasks wt on w.task_address=wt.waiting_task_address and wt.session_id=ost.session_id left join sys.dm_exec_query_profiles qp on w.task_address=qp.task_address where ost.session_id=53 order by scheduler_id, worker_address, node_id; |
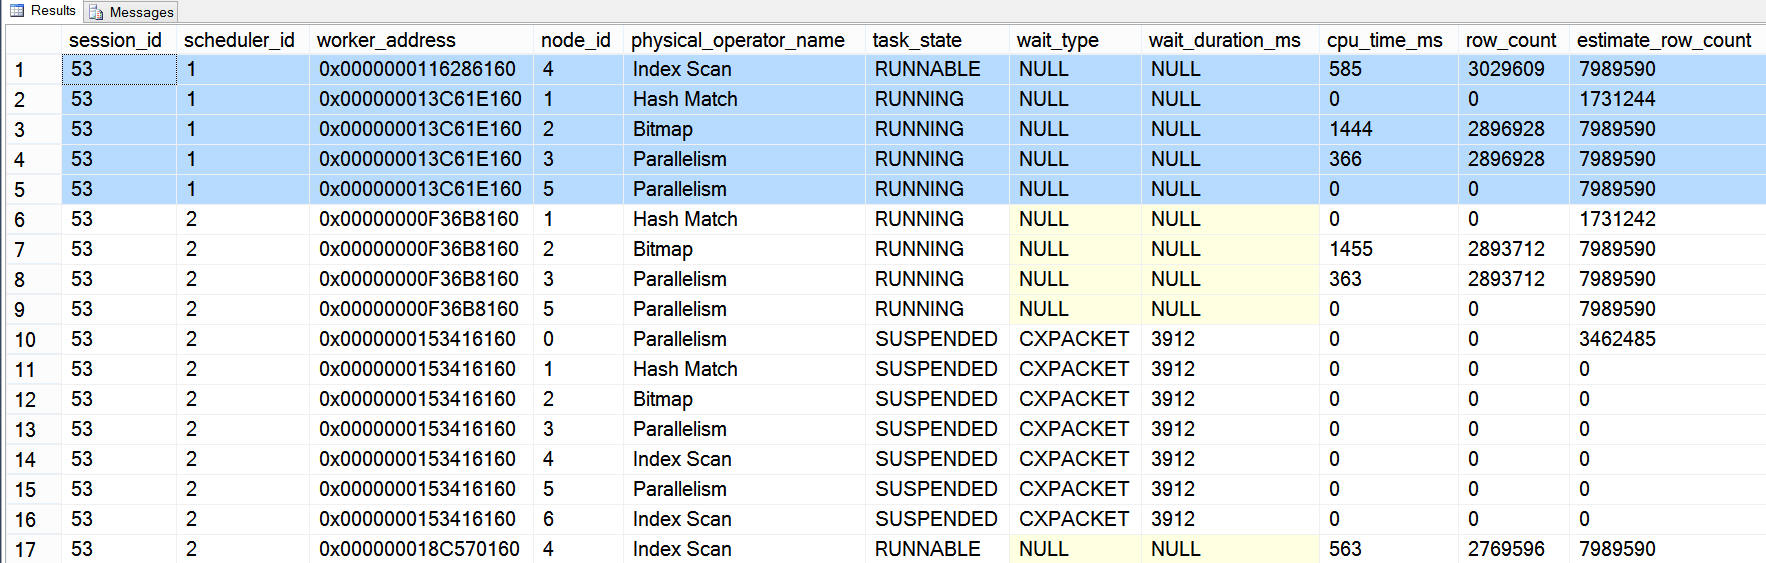
Here’s a sample of the output:
I’ve only got two schedulers being used again – this time it happened to be scheduler_id 1 and scheduler_id 2. Looking at the node_id column, I can see that the index scan on query plan node 4 is using both scheduler_id 1 and scheduler_id 2: the very top line and the bottom line of the output show the current row_count for the runnable tasks. The scan on query plan node 6 isn’t really doing work right at the instance this snapshot was taken.
Recap: Maxdop limits the cpu count for the query
Even if your query has multiple parallel operators, the operators will share the CPUs assigned to the query, which you can limit by the ‘max degree of parallelism’ setting.
Credits: thanks to Paul White confirming that I had the basics of this concept right. If you liked this post, you’d love his great post, Parallelism Execution Plans Suck.

4 Comments. Leave new
“A single query can have multiple operators that run at the same time. Each of these operators may decide to use multiple threads.”
I don’t think this is an ideal way to describe how parallelism works. The key is not operators, but rather parallel zones — each of which might contain one or more operators (logically; physically, DOP instances of each operator!). And there is no run time decision being made; rather, each zone is allotted the same exact number of worker threads: the query’s DOP. This is set just prior to the query actually running.
Nice use of the query profiles DMV. It’s certainly a cool toy!
That’s a good point. I didn’t want to get into the whole zones thing just due to scope and complexity, I was just trying to convey “more than just one thing can happen simultaneously for a query while it’s running”.
Language is hard.
I’m not disagreeing with Adam, that’s a losing battle, but for sake of simplicty kendra makes a great point. I was trying to wrap my head around this recently and went back in fourth with Paul W. Paul’s article on *zones* is fantastic but like most of the dbas/developers both you and he(Adam M) target, it goes deep quickly.
Paul’s reponse below help me… after I read it several times. PWs comment below:
“In SQL Server 2005 and later, a query can have many parallel branches, each with DOP threads, but only DOP of those threads can be active (i.e. running on a scheduler) at any one moment in time. If you look at the DMVs while a parallel query with more than one branch is running, you’ll see the threads are distributed over DOP schedulers in total. This is what restricts the number of CPUs used.”
This is a great article to get your feet wet with. Thanks Kendra.