Query Plans Pop Quiz: Three Simple Questions
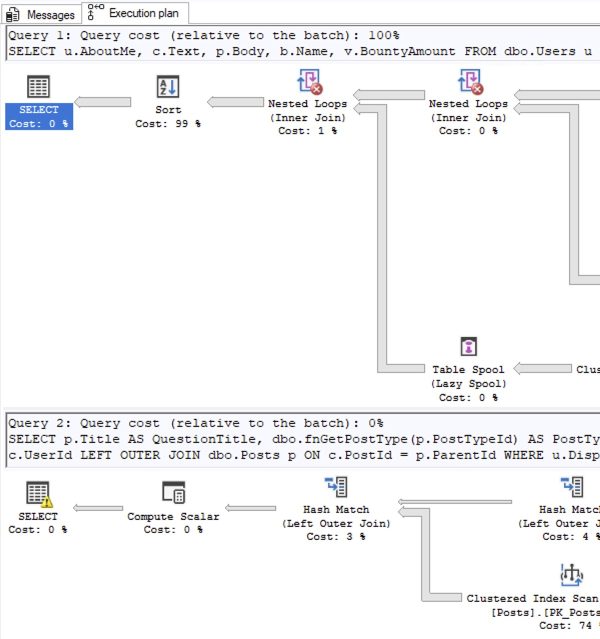
Question 1: Pick the Problematic Plan: someone hands you a pair of queries, and you get the estimated query plans. (Perhaps you get the estimated plans from SSMS, or from sp_BlitzCache, or from your monitoring tool.) Which one of these two should you focus on tuning first, Query 1 or Query 2?
Question 2: on an estimated plan, what does the thickness of the colored arrow represent?
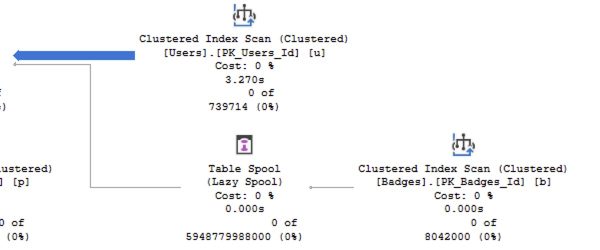
Question 3: on an actual plan, what does the thickness of the colored arrow represent?
Read the page carefully, come up with your 3 answers, and then start reading the right answers.
Related

Hi! I’m Brent Ozar.
I make Microsoft SQL Server go faster. I love teaching, travel, cars, and laughing. I’m based out of Las Vegas. He/him. I teach SQL Server training classes, or if you haven’t got time for the pain, I’m available for consulting too.
Get Free SQL Stuff
"*" indicates required fields


28 Comments. Leave new
Question 1 – Query 2
Question 2 – Estimated amount data come from Users table
Question 3 – Real amount data come from Users table
1. The second query, the one with the warning. (this was also a question at SQL Saturday Croatia 😀 )
2. In an estimate execution plan arrow size represents the number of rows OUTPUT by the operator
3. In an actual execution plan arrow size represents the number of rows READ by the operator
1. The second query. Despite that estimated “0%” relative batch cost, the plan shows a warning and the query text indicates that it uses a function – likely fouling all of the cardinality estimations and zeroing out the relative cost estimate because of hard-coded cardinality assumptions. There is also a sizable difference in the number of rows resulting from the table scan that get filtered by the hash match. Also, *a friend tells me* that “when optimizing, look for the first instance of a warning and work on that first, it’ll probably fix many other things.”
2. This arrow size kinda-sorta indicates the estimated size of the data emitted by the right-side operator
3. This arrows represents the magnitude of the data read by the source operator
1. the estimated cost is meaningless ( so I can not take into account),
then the warning, also, I don’t think so ( maybe it’s a implicit conversion in the select )
without actual execution plan is hard,
so, looking at second query, the clue , for me, will be scalar function and/or parallel operators, so i will choose second query
2. rows OUTPUT by the operator (estimated plan)
3.amount of rows read by the right operator(how much work he did)
*parallel = the absence of the parallel operators when is doing a lot of scan
Am I dumb for worrying about the Red X splats on the Nested Loops in query 1 in the first question?
Stephen – yep, the answers are out for #1, and bad news – you got it wrong! Read why: https://www.brentozar.com/archive/2025/10/query-plans-pop-quiz-answer-1-costs-are-garbage/
You got #3 wrong too, and the blog post for that one is coming next week. Stay tuned!
Just to be contrary…
1 – focus on the first one, as it’s simple and showing red X’s on 2 of the steps. Probably an index or something similar, you can put in and get a “quick win”
2 – estimated rows returned
3 – estimated cost of the right operation
First query (probably a red herring based on other responses however, I’ll bite):
Red x on nested loop indicates missing join predicate and therefore behaving as cross join. Also, the size of the errors indicate a large number of rows are being fed into both sides of the nested loop. With sufficiently large row counts on both sides, merge or hash are frequently more appropriate and performant. It also has a very expensive sort that may be remedied with an appropriate index.
2 rows output by operator
3 live query stats data flow
2 estimated rows output by operator
MMcdonald – the answers are out for #1, and bad news – you got it wrong! Read why: https://www.brentozar.com/archive/2025/10/query-plans-pop-quiz-answer-1-costs-are-garbage/
You got #3 wrong too, and the blog post for that one is coming next week. Stay tuned!
1. Query 1, since it shows sorting takes 99% of query cost, it means table has no clustered index. First thing to fix.
2. Estimated number of rows per execution.
3. Actual number of rows for all executions.
1. I would expect query number 1 first though I suspect the truncated part of the screen has the immediately obvious giveaway.
I suspect it over query 2 because of the lazy spool going into nested loop that may be going rbar, the two nested loops have the red Xs that could indicate there are no statistics available for the join so the low cost estimates don’t mean anything or it could indicate a cartesian join. I am also concerned about the high estimate for the sort but that also could be a red herring with possibly bad estimates for the two nested loop operators.
Query 2 has the bang at the end of the query that could be a spill or a cardinality warning from type conversion in a predicate or join. The join is also possibly backwards between p and c.
Overall I think the lazy spool going into the nested loop and the big sort is possibly a bigger threat. If the joins and other nonvisible predicates sufficiently reduce what is being filtered a minor spill or cardinality issue may not be a huge performance issue. If it is a type conversion causing cardinality problem, depending on what is being converted, it could be an indexing problem and not a query tuning problem, but the instruction is to tune the query, not indexes.
2. Estimated rows through the arrow
3. Query cost going through the arrow
I know 2 and 3 were covered in query tuning class, but my responses were guesses.
2 shows what it expects (forecasts) and 3 shows actual. Since actual returned more than expected could be bad/poor indexing or simply scanning too much data.
Expects what, and actual what? Be specific here – it’s trickier than it looks.
Apologies…estimated / actual number of rows being moved between operations
My third eye is open! This is an advert for Fundamentals of Query Tuning!
1. Query 1: Far too many rows going into that Sort. Cartesian Join(s), perhaps. Inadequate constraints in the Where clause?
2. Relative number of Estimated Rows, compared to other data flows in the plan.
3. Relative number of Actual Rows, compared to the other data flows in the plan.
Copilot reply:
1. Focus on the plan with:
Higher estimated cost (usually shown as a percentage).
Warnings like missing indexes, implicit conversions, or spills.
Expensive operators such as Nested Loops with high row counts, Key Lookups, or Sorts.
Even if both plans look similar, the one with more resource-intensive operations or poor cardinality estimates is likely the better candidate for tuning.
2. In an estimated execution plan, the thickness of the arrow represents the estimated number of rows flowing between operators.
Thicker arrows = higher estimated row counts.
These are based on SQL Server’s cardinality estimation, which may not always be accurate.
3. In an actual execution plan, the arrow thickness reflects the actual number of rows that flowed between operators during query execution.
This is based on real runtime data.
Comparing actual vs. estimated row counts helps identify cardinality estimation issues, which can lead to poor performance.
Ann-Lu – the answers are out for #1, and bad news – you got it wrong! Read why: https://www.brentozar.com/archive/2025/10/query-plans-pop-quiz-answer-1-costs-are-garbage/
You got #3 wrong too, and the blog post for that one is coming next week. Stay tuned!
1.Second query, can eliminate the warning and a good covering index will help.
2.Estimated number of rows per execution
3.Actual number of rows for all executions
1. Will pick the first one with a Table Spool and the query cost is high.
2. Estimated number of rows considering the statistics.
3. Actual number of rows in the plan for its first execution.
1. Query 1. The Sort operator at 99% could be a red flag. It sometimes means missing index to support ORDER BY or join conditions. Also, Nested Loops + Table Spool together can represent repeatedly executing part of the query for multiple rows.
2. Represents the estimated number of rows flowing between operators
3. Represents the actual number of rows processed between operators during execution.
1) I am going to say query 2. I suspect the query could be improved with a non clustered index on the Posts table. Furthermore, depending on how much we can change (i.e. can we rewrite code or can we just try improve performance of what we have) I would be interested to see the code of the function because I suspect based on name, though may be wrong, that it is performing a ‘hidden’ join which could be hindering performance as well.
In reality though… It depends. Always focus on the queries that are causing you the most headaches and / or the ones the business are complaining about. For example, if one is ran 100s of times per minute by an application whereas the other is ran once per day as part of an out of hours data warehouse build, then I would most likely focus on the first one as that is the one that is going to give me the most immediate benefit both for my server and my users.
2) Estimated number of rows output (based on stats) to the next operator
3) Actual number of rows read by the operator
1. 1st query as it has nested loops instead of hash match to join (and lots of rows to join estimated + sort).
2. estimated number of rows per execution
3. actual number of rows for all executions
Ndru – the answers are out for #1, and bad news – you got it wrong! Read why: https://www.brentozar.com/archive/2025/10/query-plans-pop-quiz-answer-1-costs-are-garbage/
You got #3 wrong too, and the blog post for that one is coming next week. Stay tuned!
Query 1’s red flags:
100% query cost relative to the batch – it’s consuming all available resources
Two Nested Loops joins with warning icons (the download symbols indicate issues, likely warnings about missing indexes or no join predicates)
Sort operation at 99% cost – this is extremely expensive and suggests missing indexes or poor index design
The sort is likely spilling to disk or consuming massive memory
Overall flow suggests it’s doing a lot of row-by-row operations
Thank you for teaching us! Really appreciate it.