Precisely 80.3% of you are going to learn something in this post.
Earlier this week, I asked what you thought the arrows in estimated and actual query plans meant. I asked you to just guess without doing any research, and here’s what you answered:
There are a lot of different opinions, and I can see why you’re confused. Books Online doesn’t make it clear, and Internet explanations are all over the map:
- Simple Talk: “The thickness of the arrow reflects the amount of data being passed, thicker meaning more rows.”
- TuneUpSQL.com throws column size into the mix too: “arrow thickness is based on the number of rows, not on the size of data on disc. As an example, 100 rows of bits will result in a thicker arrow than 5 rows each of which is 5000 bits.”
- SQLShack.com takes it even further, using arrow size for performance analysis: “The thickness of the arrow can also be an indication of a performance issue. For example, if the execution plan shows a thick arrows, the number of the rows that are passed through the arrows is large, at the beginning of the plan and the number of rows passed through the last arrow to the SELECT statement and returned by the query is small then a scan operation is performed incorrectly to a table or an index that should be fixed.”
- But Hugo Kornelis’s SQLServerFast.com points out a hint of the truth: “You see, the source of each execution plan is a large chunk of XML (which in turn is a representation of the internal structures SQL Server uses). And in this XML, there is nothing that represents these arrows.“
That means the entire concept of the arrow is made up by the rendering application – like SQL Server Management Studio, Azure Data Studio, SentryOne Plan Explorer, and all the third party plan-rendering tools. They get to decide arrow sizes – there’s no standard.
SSMS’s arrow size algorithm changed back in SQL Server Management Studio 17, but most folks never took notice. These days, it’s not based on rows read, columns read, total data size, or anything else about the data moving from one operator to the next.
Let’s prove how they’re built in SSMS.
To demonstrate it, let’s set up two tables, each with 100K rows – but one has a tiny string field, and the other has a large one (meaning scans will read more pages)
|
1 2 3 4 5 6 7 8 9 10 11 12 13 14 15 16 17 18 19 20 21 22 23 24 25 26 |
CREATE TABLE dbo.Narrow (Id INT IDENTITY(1,1) PRIMARY KEY CLUSTERED, String VARCHAR(8)); INSERT INTO dbo.Narrow(String) SELECT TOP 100000 'Common' FROM sys.all_columns ac1 CROSS JOIN sys.all_columns ac2; INSERT INTO dbo.Narrow(String) VALUES ('Rare'); GO CREATE STATISTICS STAT_String ON dbo.Narrow(String) WITH FULLSCAN; CREATE TABLE dbo.Wide (Id INT IDENTITY(1,1) PRIMARY KEY CLUSTERED, String VARCHAR(8000)); INSERT INTO dbo.Wide(String) SELECT TOP 100000 REPLICATE('X', 8000) FROM sys.all_columns ac1 CROSS JOIN sys.all_columns ac2; INSERT INTO dbo.Wide(String) VALUES ('Rare'); GO CREATE STATISTICS STAT_String ON dbo.Wide(String) WITH FULLSCAN; GO |
Now, let’s query the tables using a specially crafted UNION ALL that scans both tables twice, but produces different numbers of rows:
|
1 2 3 4 5 6 7 8 9 10 11 12 13 |
SELECT String FROM dbo.Narrow n /* Reads the whole tiny table, produces 100K tiny rows */ UNION ALL SELECT String FROM dbo.Wide w /* Reads the whole large table, produces 100K big rows */ UNION ALL SELECT String FROM dbo.Narrow n WHERE String = 'Rare' /* Reads the whole tiny table, produces 1 row */ UNION ALL SELECT String FROM dbo.Wide w WHERE String = 'Rare' /* Reads the whole large table, produces 1 row */ |
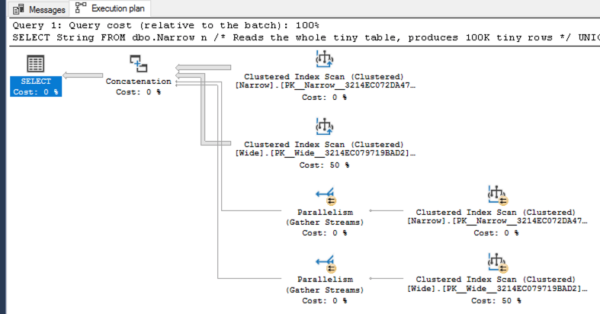
In the estimated plan, arrow size is the number of rows OUTPUT by the operator.
Good news! About half of you were right! (And half were wrong, but hey, the glass is half full around here.) Here’s the estimated query plan:
In the estimated plan, the arrow sizes are based on the number of rows coming out of the operator. The statistics we manually created mean that SQL Server accurately estimates just 1 row will come out when we filter for String = ‘Rare’.
The arrow sizes here for the estimated plans have nothing to do with the data size – note that the top two arrows are equal in size, even though one produces 100K wide rows and one produces 100K tiny ones.
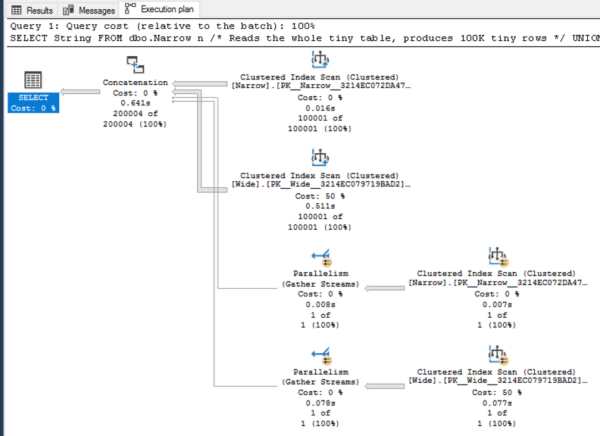
In the actual plan, it’s the number of rows READ by the operator.
Good news: 20% of you are staying current with your SSMS knowledge!
Great news: 80% of you needed this blog post, so my instincts for what to write about are still bang on. Thank you, dear 80% of readers, for confirming my knowledge about your skills. You’re doing me a favor. I love you just the way you are. Now, let’s do this:
Note that the arrows coming directly out of each clustered index scan are the same size – even though they produce different numbers of rows – because in an actual plan, arrow sizes are based on the number of rows read by that operator. (That’s also why the parallelism gather streams operator output arrows are so tiny – that operator only has to handle 1 row.)
That’s counterintuitive, because you would think the arrow size coming out of an operator would represent data coming out of that operator – but it’s not. The arrow size is based on the work done by that operator.
The documentation on this is pretty thin – the closest to official documentation that I’ve found is this SSMS 17.4 bug report where Microsoft wrote:
Hello Hugo, the thickness now takes into account the actual rows read by the operator, if available, which as per previous user community feedback, is a more accurate measure of the operator weight in the plan, and it makes it easier to pinpoint problem areas. In some cases, the problem operator had the narrowest line as actual rows is zero, but actual rows read was > 0.
This is also why I love Plan Explorer.
SentryOne Plan Explorer is a free execution plan visualization & analysis tool that lets you configure all kinds of things – including the sizes of the arrows. When you’re viewing a plan, right-click on it and choose your line width preferences (and your costs, too, like if you want the cost % to be CPU or reads):
Which one is “right”, SSMS or Plan Explorer? Well, I’d say they’re both right – as long as you understand the metric they’re measuring.
And don’t feel bad if you were wrong, by the way. I wasn’t sure if estimated plans were doing the same thing (rows read) as actuals, thus the research, and then the blog post. Strikes me as odd that they’re not consistent, though.
This is one of those posts where I know I’m going to get a bunch of questions in the comments asking me for more clarifications. By all means, grab the demo code out of the post – I wanted to make it as easy as possible to let you get started answering your own questions by building your own demos. That’s the best way to learn more about SQL Server – roll up your sleeves and get started. I’m looking forward to seeing what you find!


12 Comments. Leave new
I actually had never even paid attention to the arrows being different size and never noticed. I’d just mouse over a step to look at the record count if I needed to know the size of a read.
I don’t know if I think it is a useful feature. Typically when I use an execution plan, its in a large query and would rather have the little bit of extra space used by the arrows back when the execution plan is the size of something that would fill a big screen TV
Thank you! I just had that ballpark sense of bigger = more work, but hadn’t thought about what specifically was being represented. And since it is not consistent in SSMS, it makes me wonder what the size means in other tools I use such as SQL Monitor.
“Yes on one – no on two” Buckaroo Banzi
As an 80%’er I learned something. Line thickness is work done reading rows, not rows returned. I had it backwards.
Thanks.
I love SentryOne’s Plan Explorer too. I guess that was why I didn’t realize SSMS changed their way recently! Thanks for keeping me up to date Brent!
I actually put the wrong answers in there to help give Brent the satisfaction of confirming 80% needed the blog post!! Also, I have a bridge for sale… any takers? Yeah, I needed the post too. Thanks Brent!
Lee – thanks for your diligent efforts! 😉
Facepalm
And yes, SentryOne Plan Explorer is awesome
It’d be more intuitive if estimated & actual were consistent: actual rows read & estimated rows read, or actual rows returned & estimated rows returned.
Still, at least MS didn’t decide to have median rows read + square root of the current date raised to the power of average rainfall in mm the previous day, just to keep us on our toes.
Thanks for doing the research.
You’re welcome, my pleasure! And yeah, the inconsistency makes it kinda tricky.
Thanks for pointing out this gotcha. FYI, I’m using SSMS 17.3, and the arrows represent # of rows output. My coworker is on v18.0 and his behavior is just like you mention in the article. I’m guessing they changed it sometime after 17.3?
I’ve tried your example on my Azure SQL DB. My Execution Plan showed that I got a serial plan, instead of a parallel plan (without the Parallelism (Gather Streams) operator) when running on databases running S0 and S3. On a S4 database, the query went parallel. Otherwise it looks the same (for a change).
[…] Studio execution plan, they also represent the relative size of the data at that step. Brent Ozar recently wrote a detailed post demoing the differences between arrow sizes between estimated and actual execution plans. In […]