T-SQL & Development
How to Reduce the CPU Overhead of Dynamic SQL
Dynamic SQL is a good choice for catch-all type queries, but you have to be careful how you execute the dynamic string.
For frequently executed queries, “EXEC sp_executesql @sql”is a good choice but at the risk of encountering parameter sniffing issues.
For queries that aren’t executed very often, “EXEC (@sql)” can be used, but you could end up with a bloated plan cache with lots of single-use execution plans.
Let’s compare the performance difference between “EXEC (@sql)” and “EXEC sp_executesql @sql” for a frequently executed query.
|
1 2 3 4 5 6 7 |
SELECT COUNT(*) FROM Posts WHERE PostTypeId NOT IN (2, 3, 4) AND CreationDate BETWEEN @d AND DATEADD(dd, 5, @d) AND CommentCount IN (0, 1) AND OwnerUserId = 0; |
The query is very fast: takes less than a millisecond to compile and execute.

I usually use SQLQueryStress to load test a query, but it couldn’t deliver what I needed. It maxes out at 200 threads for a single instance. You can run multiple instances of it to get past 200 threads, but each was using a lot of CPU for this load test. Erik pointed me to Microsoft’s ostress utility instead. He blogged about ostress last year.
EXEC (@sql)
Let’s look at the most common way to execute dynamic queries first: EXEC (@sql). The fact that it’s the most common doesn’t mean it’s the right way or the wrong way.
|
1 2 3 4 5 6 7 8 9 10 11 12 13 14 15 16 17 18 19 20 21 22 |
CREATE PROC Test1 AS SET NOCOUNT ON; DECLARE @sql nvarchar(1000), @d datetime; --get a random date, 2017-12-03 is the newest date in this version of the database SET @d = DATEADD(mi, -CAST(RAND() * 1440 AS INT), DATEADD(dd, -CAST(RAND() * 500 AS INT), '2017-12-03 05:01:10.747')); --PRINT @d; SET @sql = ' SELECT COUNT(*) FROM Posts WHERE PostTypeId NOT IN (2, 3, 4) AND CreationDate BETWEEN ''' + CAST(@d AS varchar(20)) + ''' AND ''' + CAST(DATEADD(dd, 5, @d) AS varchar(20)) + ''' AND CommentCount IN (0, 1) AND OwnerUserId = 0; ' --PRINT @sql; EXEC (@sql); |
You may wonder why I’m calculating @d inside the proc and not just sending in a value to an input parameter. It was just to make the calls to ostress easy. I could have used a script file via the -i parameter rather than executing a single batch via the -Q parameter. Besides, this is my blog post. I’ll do what I want.
Before starting the test, I cleared out the plan cache so that when I show you the plan cache bloat you won’t wonder what was already in there.
|
1 |
DBCC FREEPROCCACHE; |
Time to run the load test. I decided on 50 threads with 15000 iterations after running a bunch of tests. I wanted enough threads to cause high CPU utilization and enough iterations to run sp_BlitzFirst with a 30-second sample.
|
1 2 |
ostress.exe -SServer1\SQL2017 -dStackOverflow -Utest -Ppassword1 -n50 -r15000 -q -Q"EXEC Test1" -oC:\temp\ostress |
After a minute, I ran sp_BlitzFirst to see what was going on in SQL Server.
|
1 |
EXEC sp_BlitzFirst @ExpertMode = 1, @Seconds = 30; |
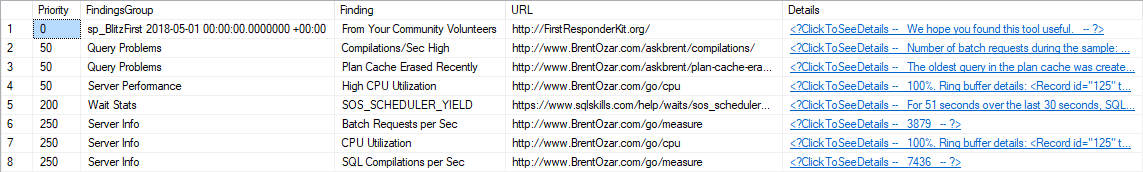
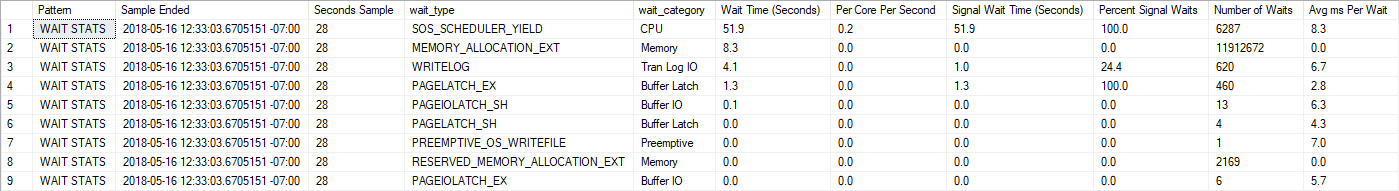
Though not horrible waiting time, SOS_SCHEDULER_YIELD is the primary wait here.

CPU was pegged at 100% during this load test.
After the test completed, I examined the plan cache using Kimberly‘s handy plan cache query.
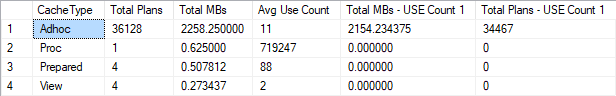
The plan cache totaled 2.3GB, which isn’t that big. But it’s big when you consider that each of the adhoc plans are tiny. Most of the 36,000 adhoc plans were only used once. Why bother storing them in memory if they aren’t going to be reused?
EXEC sp_executesql @sql
Now let’s look at the other way to execute dynamic queries: EXEC sp_executesql @sql.
|
1 2 3 4 5 6 7 8 9 10 11 12 13 14 15 16 17 18 19 20 21 22 23 |
CREATE PROC Test2 AS SET NOCOUNT ON; DECLARE @sql nvarchar(1000), @d datetime, @paramdef nvarchar(100); --get a random date, 2017-12-03 is the newest date in this version of the database SET @d = DATEADD(mi, -CAST(RAND() * 1440 AS INT), DATEADD(dd, -CAST(RAND() * 500 AS INT), '2017-12-03 05:01:10.747')); --PRINT @d; SET @sql = N' SELECT COUNT(*) FROM Posts WHERE PostTypeId NOT IN (2, 3, 4) AND CreationDate BETWEEN @d AND DATEADD(dd, 5, @d) AND CommentCount IN (0, 1) AND OwnerUserId = 0; ' SET @paramdef = N'@d datetime'; --PRINT @sql; EXEC sp_executesql @sql, @paramdef, @d = @d; |
I again cleared out the plan cache, but this time so that we can see the difference between the two load tests.
|
1 |
DBCC FREEPROCCACHE; |
I then ran the load test again but calling Test2 this time.
|
1 2 |
ostress.exe -SServer1\SQL2017 -dStackOverflow -Utest -Ppassword1 -n50 -r15000 -q -Q"EXEC Test2" -oC:\temp\ostress |
|
1 |
EXEC sp_BlitzFirst @ExpertMode = 1, @Seconds = 30; |


SQL Server was pretty bored with this workload even though it was running more queries per second than the previous test – not much waiting time on anything really.

CPU averaged around 45% during this load test.

Look at that tiny plan cache!
The roundup
ostress settings: threads=50, iterations=15000

Should you just use sp_executesql always?
If you have high CPU utilization and run frequently-executed dynamic queries with “EXEC (@sql)”, consider using “EXEC sp_executesql @sql” instead. You’ll need to be aware of parameter sniffing issues, but you should see a drop in CPU utilization and plan cache size.
Parameter sniffing issues are no joke. I have lost hundreds of hours troubleshooting parameter sniffing issues over the past 15 years. Know how to identify if parameter sniffing is the problem and how to troubleshoot it.
Don’t default to using sp_executesql though. If a query is not executed frequently, “EXEC (@sql)” can work just fine. Just be sure to monitor the adhoc plans in the plan cache.
Free, 3× a week
Get my new posts by email
Three posts a week, plus a Monday roundup of the best database news from around the web.
Wow. I did not know there could be such a massive difference between the two. I might use Kim’s query to sniff out any servers that are bloated like that! Thanks for the informative post, as always!
With sp_executesql + option(recompile) It is the same as exec()?
It’d have the same CPU effect due to the compilations. If you were going to use OPTION (RECOMPILE), then just don’t use Dynamic SQL if it’s a catch-all query (https://sqlinthewild.co.za/index.php/2018/03/13/revisiting-catch-all-queries/).
Would sp_executesql with option(recompile) be the safer option to have an extra layer of protection against SQL injection?
Yes because it’s parameterized. This is a good article on it: https://www.mssqltips.com/sqlservertip/3637/protecting-yourself-from-sql-injection-in-sql-server–part-1/
I’ve worked at a place where they used sp_executesql for many years. It’s pretty good for sending hundreds of thousands of similar commands in a short amount of time where milliseconds can mean a big difference in job execution times.
Thank you!
I suspect that turning on “optimize for ad hoc workloads” would reduce the plan cache size.
Of course it does, but that’s not the point of the post. The high CPU utilization issue would still exist.
Can you compare on more complex queries?
The problem gets even worse for more complex queries if they are frequently executed. You’ll hit 100% CPU faster and have less throughput.
I believe that complex queries on many data they are more likely to cause the reuse of a bad execution plans, so the IO becomes the bottleneck instead of CPU. Even more if they are frequently executed.
Well, it’s good to believe in something.
Sure, mostly if you believe right things.