
Party Up
When someone says “this query is slow”, and you can rule out contextual stuff like blocking, odd server load, or just an underpowered server, what’s the first thing you look at? There’s a lot of potential culprits, and they could be hiding in lots of different places.
After several minutes of thinking about it, I decided to call my method QTIP, because I like to look at the:
- Query Plan
- Text of the query
- Indexes used
- Parameters used
Query Plan
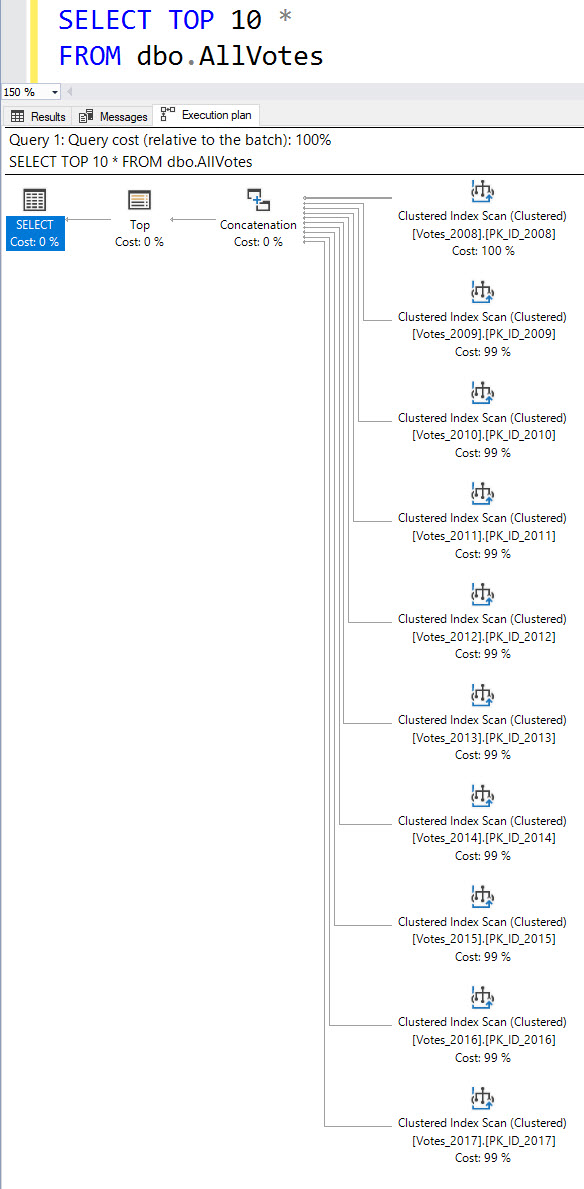
I really like to understand the scope of what I’m dealing with. Queries can hide a lot of complexity from you, and if someone is working on a stored procedure with many statements in it, knowing where to start can be daunting.
Even though costs are estimates, they can often be a pretty good starting place to direct your tuning efforts.
There may also be something very obvious hiding in the query plan that looking at the query wouldn’t give you any insight into, like a spill, spool, expensive optional operators, or operators with many executions.
Text of the query
If I see something in the query plan I don’t like, or if something related to the query text gets flagged in sp_BlitzCache then my next step is to look at the text of the query.
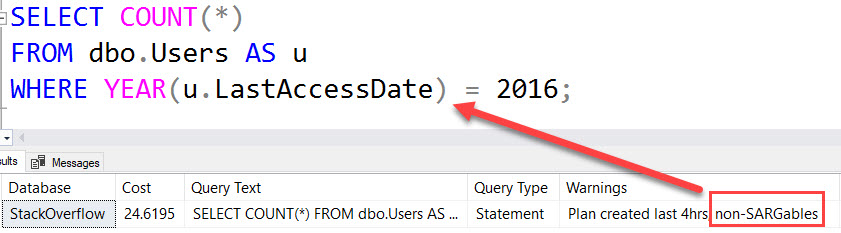
As a simple example, non-SARGable predicates were flagged here, because we have a column wrapped in a function.
Granted, you could spot this by hovering over tool tips in the query plan, but in a complicated enough plan, it would be easy to miss.
Indexes used by the query
Looking at the indexes generally makes sense to do after poking around the plan and the text.
You may spot something suspicious in the plan, like a heap, or no nonclustered indexes being used — this goes out the window if you’re using a data warehouse, of course — or you may just want to see what indexes are available.
We see a lot of apps that were produced with an initial set of indexes that helped the initial set of queries, but many releases and code changes later, they’re far less useful than they used to be.
Index tuning is a lot like losing weight: The longer you wait to do it, the harder it is. You’ll have to sift through a lot of deduplicating, ditching unused indexes, fixing heaps, and evaluating missing index requests before you start to see those spray tanned abs.
Parameters used by the query
Anyone who has dealt with parameter sniffing issues knows how much different values can change query plans and execution times.
You have to dig up the parameters the plan was cached with, executed with when it was slow, and client connection settings.
I tried to make this a little easier with sp_BlitzCache, by adding the cached execution plan parameters column:

If you click on it, you’ll get something like this:
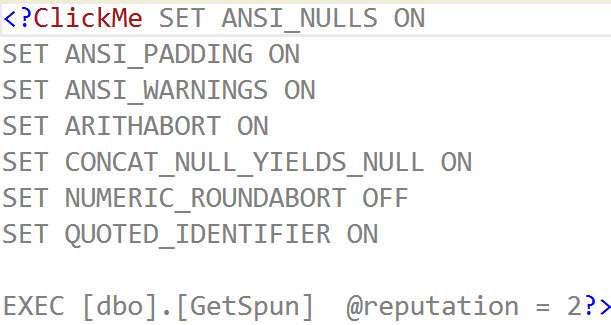
This doesn’t help you with what parameters were used when the plan was executed most recently — nothing like that will aside from a dedicated monitoring tool — but it’s a pretty good start.
Party On
I know this post is going to frustrate some people — it’s a big outline without much detail. It would be really difficult to go into necessary detail on each of these here, but it’s a good starting place.
And besides, maybe I’m planning on turning it into a presentation.
Thanks for reading!
Brent says: I love the QTIP approach because it reminds me not to get bogged-down in one thing. It’s so easy to just focus on the query plan without looking at the indexes, or to focus too much on getting exactly the right parameters. You’ve gotta use all the parts of the QTIP.

7 Comments. Leave new
Just don’t get it stuck in your ear.
You wouldn’t believe how much stuff is in there already.
[…] fact, Brent Ozar, a highly respected SQL Server MVP and expert, has a recent blog titled “Do I Have A Query Problem Or An Index Problem?” where he proposes following his “QTIP” method once these obvious issues are […]
Great post, Bre…rik!
Thanks, OZ 😉
Many years ago a very wise gentleman advised me that the only thing that you should put in your ear is your elbow! 🙂
Bad news, Russell: he wasn’t saying “your ear”. You’re one R short.