
First Responder Kit Power BI Dashboard (Discontinued)
As of May 2020, I’m no longer supporting this tool. Absolutely nothing against Power BI – I love it – but the Power BI support questions were kicking my butt. Most of my audience just isn’t Power BI savvy yet, and they ran into a lot of problems trying to work with this new tool. I have a lot of hope for it for the future, but for right now, I need to focus on tools that are easier for me to support with the limited time that I have. You’re still welcome to download the file and use it, but I don’t do any support for it. It’s open source, so someone else is welcome to pick it up and run with it.
The First Responder Kit’s free Power BI Dashboard gives you a fast overview of how your SQL Server is performing. You can trend your throughput by time, see how hard SQL Server was working during those times, and see what sp_BlitzFirst recorded about various performance issues like blocking, backups, and poison waits.
To use it, we need to:
- Install & configure sp_BlitzFirst to collect data
- Point the First Responder Kit Power BI file at your SQL Server
- Analyze your SQL Server’s performance bottlenecks
- Drill down into a single query’s history
- Learn more advanced tips & tricks
Let’s get started.
1. Install & configure sp_BlitzFirst to collect data.
Download our free First Responder Kit for SQL Server, then install the scripts. Open “Install-Core-Blitz-No-Query-Store.sql” and run it – that’ll install sp_Blitz, sp_BlitzFirst, sp_BlitzCache, and friends. They’ll install in whatever database you’re in – master is fine, or you can pick another database if you like. (Be aware that if you install them in another database, you’ll need to fully qualify ’em when you run ’em.)
Create a database to hold your First Responder Kit data, like say FirstResponderKit or DBAtools.
Then, set up a SQL Server Agent job to run sp_BlitzFirst every 15 minutes, like this:
|
1 2 3 4 5 6 7 8 9 |
EXEC sp_BlitzFirst @OutputDatabaseName = 'DBAtools', @OutputSchemaName = 'dbo', @OutputTableName = 'BlitzFirst', @OutputTableNameFileStats = 'BlitzFirst_FileStats', @OutputTableNamePerfmonStats = 'BlitzFirst_PerfmonStats', @OutputTableNameWaitStats = 'BlitzFirst_WaitStats', @OutputTableNameBlitzCache = 'BlitzCache', @OutputTableNameBlitzWho = 'BlitzWho'; |
By default, we keep the last 7 days of history. Once you’re comfortable with the amount of data getting generated on your servers, you can use the @OutputTableRetentionDays parameter to override that to a higher number if you want.
2. Point the First Responder Kit Power BI file at your SQL Server.
Install Microsoft’s Power BI Desktop, which is totally free for Windows users. (No love for Mac or Linux folks, sadly.) Go get you some of that.
Then open the FirstResponderKit Power BI file from your First Responder Kit download. (It’s in the Power BI folder.) When you open it, it’ll default to a set of training data, which is cool when you’re learning how to use it.
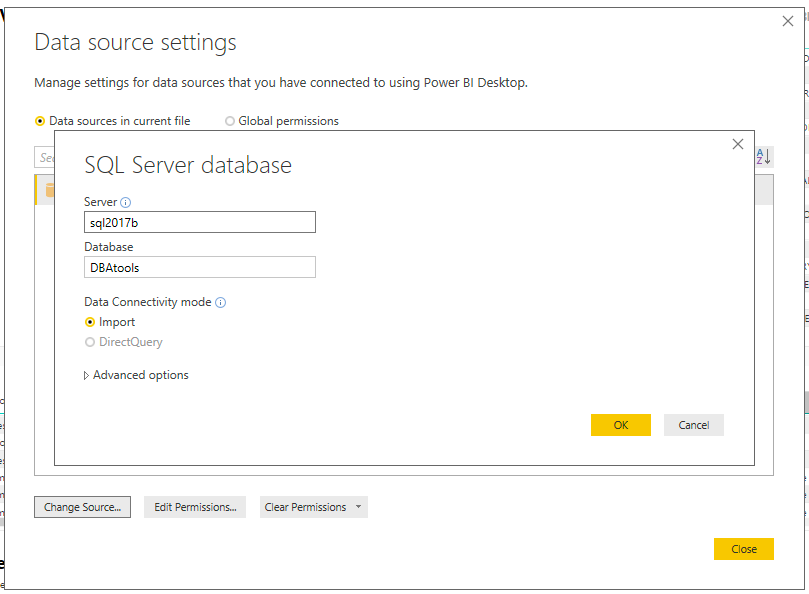
In the toolbar, click the down arrow under Edit Queries, then Data Source Settings, then Change Source. Point it at your own SQL Server – in this case, SQL2017A:
Click OK, Close, and then the Refresh button in your toolbar. The Refresh tells Power BI to go fetch the data from your newly configured SQL Server.
3. Analyze your SQL Server’s performance bottlenecks.
At the top left, use the CheckDate and CheckDateHour to zoom in on performance statistics for a specific time range:
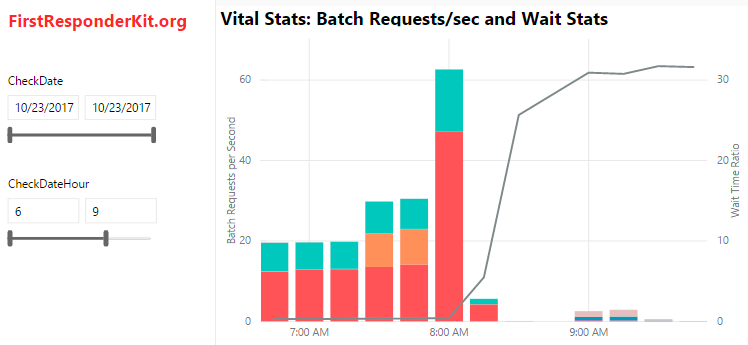
(Yes, that’s actually how Power BI wants you to pick time ranges. Yes, I’m surprised too. No, I’m not happy about that. Yes, I’ll switch it to something better as soon as Microsoft offers it.)
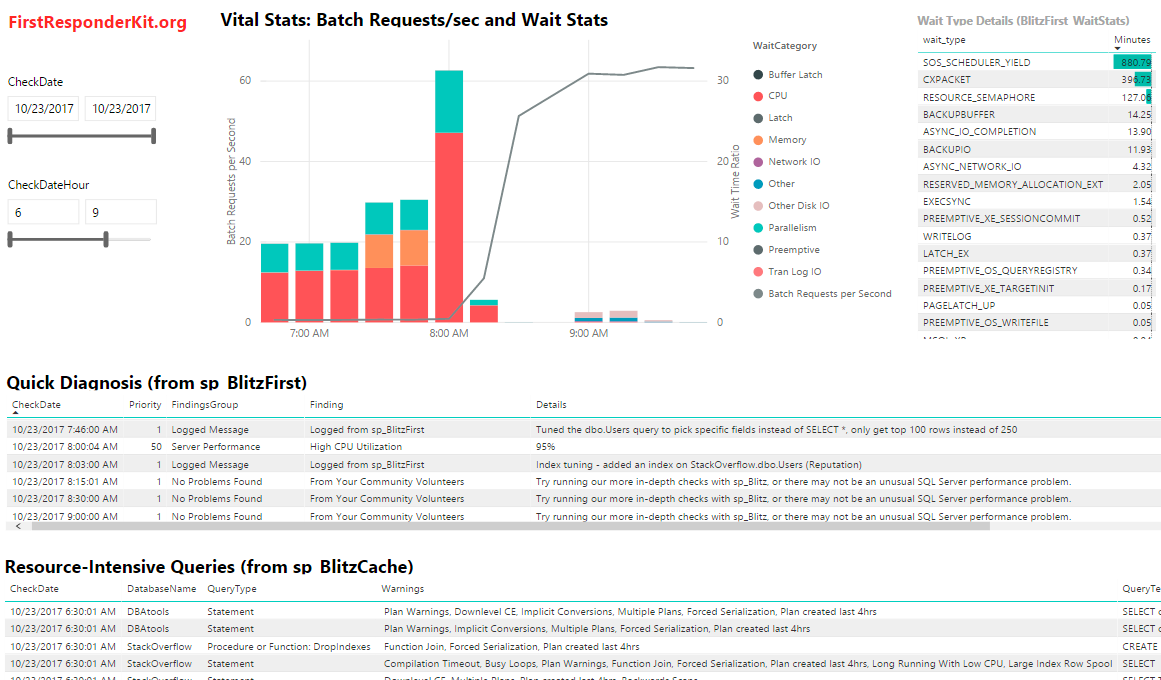
In the graph shown above:
- The line = Batch Requests per Second. This is like your SQL Server’s speedometer showing how many queries it’s handling.
- The bars = Wait Time Ratio. For every minute on the clock, how many minutes does SQL Server spend waiting on stuff? If Wait Time Ratio = 10, that means SQL Server spent 10 minutes of time waiting on stuff in every minute. The lower, the better/faster. When this ratio is under 1, that means your SQL Server isn’t really waiting on anything, and it’s just not working all that hard.
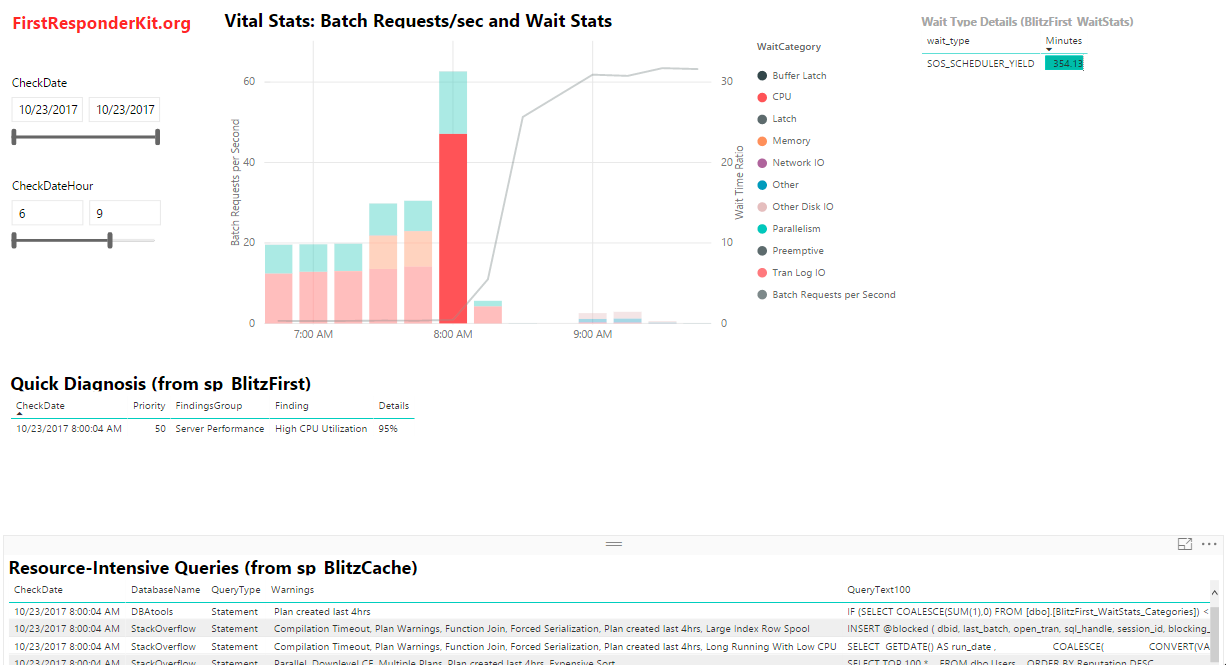
You can click on a single wait category bar as shown at right.
When you click on a single bar, the top right table shows the wait types in that wait category – in this case, just SOS_SCHEDULER_YIELD.
The rest of the page filters by time (not wait type):
- The Quick Diagnosis section shows only the warnings at that time
- The Resource-Intensive Queries section shows only the queries at that time (although not just for that wait type – it shows all of the queries logged at that time)
4. Drill down into a single query’s history.

After a few collections, once you’ve got some query data, refresh your Power BI data. In the Resource-Intensive Queries section, right-click on a query of interest, and click Drillthrough, Query Details.
The “Query Details” tab of the Power BI doc will open showing the query’s performance over time, with the time filters honoring the same ones you used for the overview page.
From top to bottom:
- sp_BlitzCache commands to show you more details about the query right now in your own plan cache. (Man, I really wish Power BI made it easy to copy/paste this command out into SSMS.)
- Query Performance Over Time – check to see if reads/CPU/duration suddenly dropped, indicating that you’ve got a better plan in the cache.
The full query & query plan data are also available inside the data, but we don’t show that in Power BI because it’s just not a great experience to view query plans there. Your best bet is to query the underlying tables to get that data.