A while back, we talked you through a public whitepaper about how Microsoft was working on making user-defined functions go faster. Now that the preview of SQL Server 2019 is out, you can start getting your hands on Froid, the performance-boosting feature. Here’s the documentation on it – let’s see how it works.
Using the StackOverflow2010 database, say our company has a scalar user-defined function that we use to calculate how many badges a user has earned:
|
1 2 3 4 5 6 7 8 9 10 11 12 13 |
CREATE OR ALTER FUNCTION dbo.ScalarFunction ( @uid INT ) RETURNS BIGINT WITH RETURNS NULL ON NULL INPUT, SCHEMABINDING AS BEGIN DECLARE @BCount BIGINT; SELECT @BCount = COUNT_BIG(*) FROM dbo.Badges AS b WHERE b.UserId = @uid GROUP BY b.UserId; RETURN @BCount; END; GO |
In this past, performance for this has really sucked. If I grab 1,000 users, and call the function to get their badge counts:
|
1 2 3 4 5 |
SELECT TOP 1000 u.DisplayName, dbo.ScalarFunction(u.Id) FROM dbo.Users AS u GO |
The execution plan looks simple:

But it’s actually terrible:
- It doesn’t show all the stuff the scalar function does
- It wildly underestimates the work involved (scalars have fixed tiny costs regardless of the work they do)
- It doesn’t show the logical reads performed by the function
- And of course, it calls that function 1,000 times – once for each user we return
Metrics:
- Runtime: 17 seconds
- CPU time: 56 seconds
- Logical reads: 6,643,089
Now let’s try in SQL Server 2019.
My database has to be in 2019 compat mode to enable Froid, the function-inlining magic. Run the same query again, and the metrics are wildly different:
- Runtime: 4 seconds
- CPU time: 4 seconds
- Logical reads: 3,247,991 (which still sounds bad, but bear with me)
The execution plan looks worse:

Your first thought is probably, “Mother Nature, that plan looks like more work,” but the point is that it’s now showing the work involved in the function. Before, you had to use tools like sp_BlitzCache to figure out which functions were getting called, and how often.
Now, you can see that SQL Server is building a spool, or as Erik likes to say, passively-aggressively building its own missing index on the fly without bothering to tell you that it needs one (note that there’s no missing index request on the plan):

That’s great! That means I can easily fix that just by doing index tuning myself. Granted, I have to know how to do that level of index tuning – but that’s a piece of cake when suddenly the plan makes it more obvious as to what it’s really doing.
How to find out if your functions will go faster
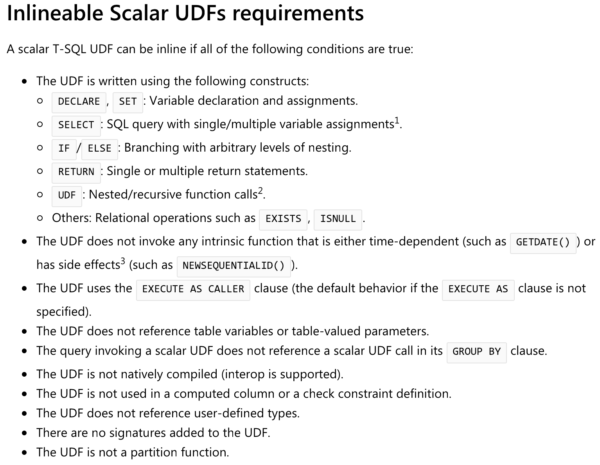
The documentation lists a lot of T-SQL constructs that will or won’t go inline:

But reading that would require you to open the code in your user-defined functions, too, and that’s one of the top causes for data professional suicide. I need all the readers I can get.
So instead, just go download the SQL Server 2019 preview, install it on a test VM, restore your database into it, and run:
|
1 |
SELECT * FROM sys.sql_modules; |
There’s a new is_inlineable column that tells you which of your functions can be inlined:

Then to find out which of your functions are actually getting called the most often in production today, use sp_BlitzCache:
|
1 |
sp_BlitzCache @SortOrder = 'executions'; |
Make an inventory of those, and while you’re in there looking at functions, try CPU, Reads, or Memory Grant as different sort orders. Keep an eye out for table variables, high memory grants, or low grants that lead to spills, because SQL Server 2019 improves those too:
- What’s New in SQL Server 2019: Faster Table Variables
- What’s New in SQL Server 2019: Adaptive Memory Grants
That’ll help you build a business case to management. You’ll be able to explain which of your queries are going to magically run faster as soon as you upgrade, and how much of an impact that’ll have on your SQL Server overall – all without changing code. That’s especially powerful for third party apps where you can’t change the code, and you need a performance boost.
Wanna see examples of code that actually gets slower in SQL Server 2019?


9 Comments. Leave new
Great article!
Damn, this new release is getting really interesting really fast!
You can even do it faster for a milisecond using window function, no need to write a function and bug the serve with it
The problem with SQL Server was that everything was faster by just writing it in the query itself instead of using a function. Great for performance. Bad for code reuse. It kind of sucks that you had to write every piece of logic multiple times (once for every query that needs it). Fixing a bug could really take some time.
If you can change the code, then code reuse is easy: Don’t use scalar functions, use inline table-valued functions (which return 1 row in this case). They are transparent to SQL Server and will be integrated in the execution plan.
Agree. Refactored all my scalar fns to table valued direct cte return functions instead 10 years ago. No reason to go back to scalar garbages.
Looks like we be skipping 2017 and go straight to the 2019.
[…] Brent Ozar looks at improvements the SQL Server team has made to scalar functions in 2019: […]
[…] What’s New in SQL Server 2019 CTP 2.1: Faster Functions A small piece of code where Brent [T] shows how a scalar function works under 2019. […]