
Where have you been all my life?
Whenever I’m teaching people about query tuning, two things come up almost without fail: parameter sniffing and tempdb spills.
They’re not mutually exclusive — some queries will seemingly always spill to tempdb, whether parameter sniffing is present of not, and some queries experiencing issues with parameter sniffing will never spill to tempdb.
The tough part is that catching parameter sniffing in action is difficult. It’s sort of like looking for it makes it disappear, and some evidence of it still disappears.
This has improved both with the addition of Query Store in general, and memory grants in DMVs.
Now with tempdb spills added, your job gets even easier. Sort of.
The finding problems part is easier.
You still have to solve them. Or send an email to the Automation department.
They’ll get back to you in a jiffy.
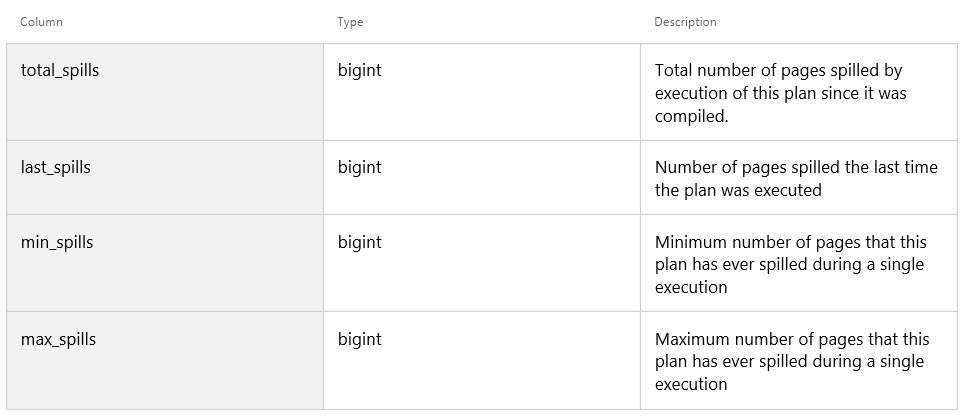
Adds the following columns to the sys.dm_exec_query_stats, sys.dm_exec_procedure_stats, and sys.dm_exec_trigger_stats DMVs.
Okay, cool, but… remember what I just said about Query Store?
These columns aren’t in there. Yet. Maybe?
This makes things a little awkward
Especially for someone building tooling for Query Store.
- Do I need to hit DMVs outside of Query Store now to get spill info?
- Should I wait to find out?
I don’t know!

So what’s the good part?
Well, tempdb spills aren’t available in cached plans.
If I have this procedure…
|
1 2 3 4 5 6 7 8 9 10 11 |
CREATE PROCEDURE dbo.spillage AS BEGIN SELECT p.OwnerUserId, p.Id, DENSE_RANK() OVER ( PARTITION BY p.OwnerUserId ORDER BY p.Score DESC ) FROM dbo.Posts AS p WHERE p.CreationDate >= DATEADD(YEAR, -1, GETDATE()) ORDER BY p.LastActivityDate; END; |
Without any helpful indexes we end up spilling to tempdb.

But if I’m digging through the plan cache, I won’t know that.
|
1 |
EXEC sp_BlitzCache @StoredProcName = 'spillage' |

Nothing in the plan warns me that a Sort spilled.
But now I can query the new DMVs to find spills! I’ll be adding this to sp_BlitzCache for the next release.
|
1 2 3 4 5 6 7 8 9 10 11 12 13 14 15 16 17 18 19 20 |
WITH spills AS ( SELECT deps.plan_handle, SUM(deps.execution_count) AS execution_count, SUM(deps.total_spills) / 128. AS total_spills_mb, SUM(deps.last_spills) / 128. AS last_spills_mb, SUM(deps.min_spills) / 128. AS min_spills_mb, SUM(deps.max_spills) / 128. AS max_spills_mb, (SUM(deps.total_spills) / SUM(deps.execution_count)) / 128. AS avg_spills_mb FROM sys.dm_exec_procedure_stats AS deps WHERE deps.total_spills > 0 GROUP BY deps.plan_handle ) SELECT s.execution_count, s.total_spills_mb, s.last_spills_mb, s.min_spills_mb, s.max_spills_mb, s.avg_spills_mb, deqp.query_plan FROM spills AS s CROSS APPLY sys.dm_exec_query_plan(s.plan_handle) AS deqp; |
Weeee

Is there a downside?
Well… There are a few things that can spill; Sorts and Hashes being the most common.
If you’ve got multiple operators that can spill, you don’t know which ones did spill.
- Did one spill?
- Did more than one spill?
- Did they all spill?
- Which one spilled the most?
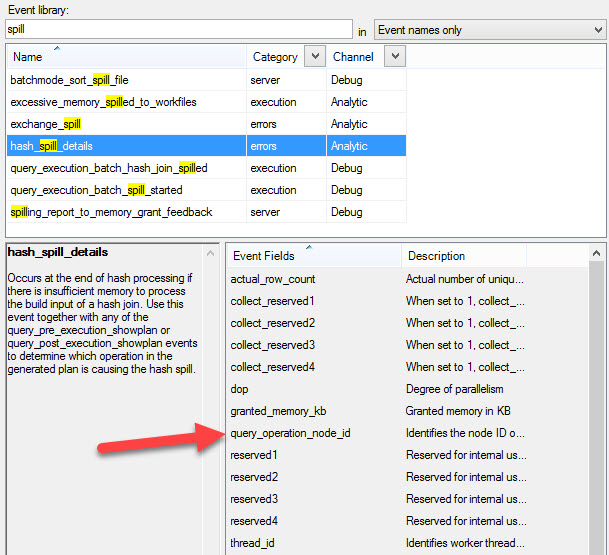
I only bring this up because Microsoft already knows it.
There are a number of XE sessions geared towards capturing spills, and many of them collect the node id in the query plan of the operator that spilled.
Is this the end of the world?
No, not by a long shot. it’s just something for you to be aware of.
Are spills even a problem?
No, not always. But they’re a good thing to be aware of.
They tend to manifest in wait stats as IO_COMPLETION.
If you’ve got queries that are both spilling to disk and have long average waits on that wait type, it’s probably time to take a closer look.
Thanks, Microsoft
I’m very happy to see this stuff surfaced! Microsoft is slowly getting away from the “catch me if you can” approach to performance issues.
In many scenarios, you still really do have to catch problems while they’re happening to capture meaning information, but those scenarios are dwindling with every release.
I really hope this information comes to Query Store soon!
Thanks for reading!
Brent says: I am so loving the age of automated performance tuning. No, seriously, hear me out, this isn’t a joke. If you’re gonna build a robot to fix performance issues in Azure SQL DB, then the robot needs metrics just like humans do. Is this fix gonna be backported to 2016, 2014, or 2012? Who knows? Who cares? I’m at the point where I say if you need speed, you need to be on 2017 – not just for today’s speed, but to get the fastest releases of the fastest performance troubleshooting tools.

4 Comments. Leave new
This was an obvious miss. Should be online by tomorrow. May I suggest you ping me when you find such issues? Thanks Erik
Er… Which part?
Hi Brent! Can you explain why can the total_spills in sys.dm_exec_query_stats differ from the sum total_spills in sys.dm_exec_query_stats by the same plan_handle?
Felix – for questions, head on over to https://dba.stackexchange.com.