
Update
This seems to finally be fixed as of CU12 for SQL Server 2017. If you’re not already patched up, head over to the link to get there.
Estimated Plans Need Not Apply
This is, of course, only available in actual plans.
All together now:
If a query uses one or more user-defined scalar functions (such as T-SQL functions or CLR functions), a significant portion of query execution time may be spent inside those functions, depending on the function definition. This may be not immediately obvious by looking at the query execution plan. This update adds two new attributes to QueryTimeStats: UdfCpuTime and UdfElapsedTime. These provide the total CPU and elapsed time that is spent inside all scalar user-defined functions (in milliseconds) during the execution of a query.
This sounds cool, right? It doesn’t help you if you’re not on SQL Server 2017 and looking at:
- Estimated plans
- Live query plans
- Cached plans
- Query Store plans
Why this is good for you: There will be no bugs for this feature in sp_BlitzCache or sp_BlitzQueryStore!
Why this is bad for you: You have to run the query and collect the actual plan.
If the UDF is buried in a query that’s buried in a nested view that’s buried in stored procedure that’s called by another stored procedure, this could still be time consuming to track down. You can either ctrl+f through the XML, or look at the properties of every select operator. Fun, right?
Note: This is not automated, nor corrected automatically. Yet. God save the DBA.
Where can you see it?
It’s in the plan XML, and in at least v17.4 of SSMS. If you hit f4 and highlight the select operator in your plan, you can drill down to the QueryTimeStats node.

But uh. Those numbers look weird to me.
Do they look weird to you?
Now, look, I’m not a math guy, but…
This is messed up
Stick with me, here.
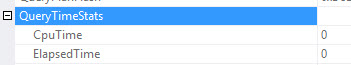
If I run this query, QueryTimeStats registers 0 CPU and Elapsed time.
|
1 2 |
SELECT TOP 10 u.Id FROM dbo.Users AS u; |
If I run this query…
|
1 2 |
SELECT TOP 10 u.Id, dbo.ScalarFunction(u.Id) FROM dbo.Users AS u; |
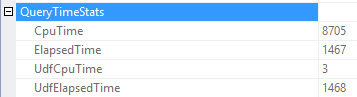
Our query that previously used 0 CPU time is now using about 9 seconds of CPU time, but the UDF is only responsible for about 3 milliseconds of it.
Ooooookayyyyyy
What’s the function doing?
Something that uses a whole lot more than 3 ms of CPU time.
|
1 2 3 4 5 6 7 8 9 10 11 12 13 14 15 |
CREATE FUNCTION dbo.ScalarFunction ( @uid INT ) RETURNS BIGINT WITH RETURNS NULL ON NULL INPUT, SCHEMABINDING AS BEGIN DECLARE @BCount BIGINT; SELECT @BCount = COUNT_BIG(*) FROM dbo.Badges AS b WHERE b.UserId = @uid GROUP BY b.UserId; RETURN @BCount; END; |
Here’s the query plan for it.

Isolation
What if we only run the function?
|
1 |
SELECT dbo.ScalarFunction(1) |
What if we take the table access out of the picture?
|
1 2 |
SELECT u.Id, dbo.ScalarFunction(u.Id) FROM ( VALUES ( -1 ), ( 1 ), ( 2 ), ( 3 ), ( 4 ), ( 5 ), ( 8 ), ( 9 ), ( 10 ), ( 11 )) AS u ( Id ); |
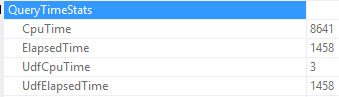
Now, look, selecting 10 integers from a values clause doesn’t generate 8.5 seconds of CPU time on its own.
If it does, I don’t think you’re on a version of SQL Server that even supports the values clause.
What if we just run the query that’s in the function?
|
1 2 3 4 5 |
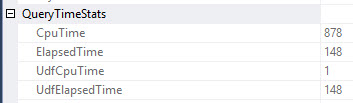
DECLARE @BCount BIGINT; SELECT @BCount = COUNT_BIG(*) FROM dbo.Badges AS b WHERE b.UserId = 1 GROUP BY b.UserId; |
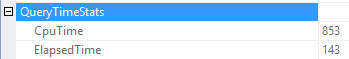
Pattern Forming
The query inside the function takes ~853ms of CPU time. The elapsed time is 143ms. The disparity here is due to parallelism. The plan uses a DOP of 6, which increases the CPU time to decrease the elapsed time. Hopefully. Usually.
When scalar valued functions run, they do so per-row returned by the query. Whether we use the Users table, or the values construct, our top 10 query invokes the function 10 times.
If you multiply the number of function executions by the CPU and elapsed time stats for the query inside the function (853 and 143, respectively), you’ll get about to where the CPU and elapsed times land for both the values clause and the query against the Users table.
I don’t expect millisecond timing to be perfect. Threads are weird, as a wise man once said.
But showing the UDF with a value of 3ms is wildly incorrect.
Thanks for reading!
Brent says: I’m not mad. I’m not even disappointed. I’m happy that plans are continuing to get additional investment from Microsoft, and I know this bug is gonna get fixed because whoever wanted this feature bad enough to get it coded is also going to be bummed out about the implementation. It’ll get there eventually, just like wait stats in execution plans – more on that in tomorrow’s post.

4 Comments. Leave new
Oops, Microsoft did it again. Thanks Erik!
As a guy who has shipped broken features, I’m not terribly upset. I just didn’t want anyone to start using it and think their functions were functioning.
Hey Erik, thanks for finding the bug. Sorry about this.
Can you please send me a repro? (which DB was this in?)
We’ll get this sorted ASAP.
And again, appreciate if you ping me on these things. Reason I found it is I was told to look here. 🙂