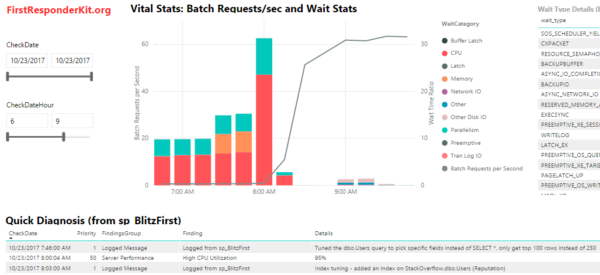
In the First Responder Kit’s Power BI Dashboard, there’s a Quick Diagnosis results area where sp_BlitzFirst takes a guess at why your SQL Server was slow – or in this case, why it suddenly got faster:

In this case, wait times were bad, and then all of a sudden the wait times just disappeared, and the line graph for Batch Requests/sec takes off. We’re doing way more queries, but waiting less times. Why?
The answer is shown in the Quick Diagnosis area – look closely at the bottom of that screenshot. Our DBA has been hard at work tuning queries and indexes:

Logging messages directly into the monitoring tables means it’s way easier to understand cause-and-effect changes in performance. This helps you track your effectiveness doing performance tuning.
How to Log SQL Server Changes
First, start logging sp_BlitzFirst data to table to track your performance metrics over time.
Then, whenever you do something that might affect performance, call sp_BlitzFirst with the message you want to log:
|
1 |
sp_BlitzFirst 'Index tuning - added an index on StackOverflow.dbo.Users (Reputation)'; |
sp_BlitzFirst assumes that you’re logging data in a DBAtools.dbo.BlitzFirst table, or in a dbo.BlitzFirst table in the current database. If you’re using a different database/schema/table name, you’ll need to fully qualify it like this:
|
1 2 3 4 |
sp_BlitzFirst @LogMessage = 'I did something awesome!', @OutputDatabaseName = 'DBAtools', @OutputSchemaName = 'dbo', @OutputTableName = 'BlitzFirst'; |
You can run this manually, but of course you can also call it from your own utility scripts & tools like:
- A new version deployment tool that tracks when code changes
- A DDL trigger that tracks changes to tables
- A nightly load process that adds a lot of new data to a table
- Stats update jobs that change execution plans
- SQL Server startup scripts that track when an AG failed over or was moved to a faster VM or instance type
Advanced Parameters for Custom Logging
Behold! Magic Extensibility!
- @LogMessagePriority: defaults to 1, but you can use lower priorities like 100-200 if you want to just put in low-priority informational notes, like a data warehouse load finished.
- @LogMessageFindingsGroup: defaults to “Logged Message”
- @LogMessageFinding: defaults to “Logged from sp_BlitzFirst” – but with these two parameters, you could define other sources like your ETL processes
- @LogMessageURL: defaults to “https://www.brentozar.com”, but if the message relates to a deployment, issue, help desk ticket, etc, you can link it here. Same with more info links to Sharepoint.
- @LogMessageCheckDate: defaults to now, but if you need to retroactively log something, you can.
You can start to see where I’m going with this: I wanna give you a framework that we can use together to build a better understanding of what’s happening to our SQL Servers, and let everyone from development to sysadmins to DBAs understand why performance got better or worse.
For help:
- Talk with us in the #FirstResponderKit Slack channel (if you need a free invite, hit SQLslack.com)
- To make code improvements or report a bug, visit the Github issues list and read the Contributing Guide


6 Comments. Leave new
Hi,
This is really great. We have a number of non-production testing SQL Servers for which it is deemed too expensive for commerical monitoring tools. I’ve been using Opserver to keep an eye on them, and have been planning to look at Bosun as well. However, this is also a really nice visual way of seeing what’s going on.
I have noticed however, that the BatchRequests/Sec perfmon counter resets at around 2 billion (i assume other counters do too), which results in a delta of -2billion for the next check. This obviously throws the scale of the graph out of whack if you need to view that period.
As ours are non-prod environments, they’re very quiet so it’ll take quite a long while for us to reach the 2 billion mark again, however, i suspect that other people may hit that mark comparatively quickly.
Steve – thanks, glad you like it! Can you follow the instructions at the end of the post to report a bug, though? I’m afraid we don’t compile ’em from the comments (we just have too many blog posts all over the place, and we keep our bugs in a central place.) Thanks!
Hi Brent, let me express my admiration for your great job developing and making available the FirstResponderKit to the DBA community. This is a real Art Work! And I like your style too 🙂
Using this opportunity I would like to contribute my finding regarding and suggest an important functionality extension for sp_BlitzFirst. Today I had a production database in the Suspect Mode. Before I ran DBCC repairing command I ran sp_BlitzFirst and unfortunately it did not capture this problem. If I am still correct with my finding I believe this would be a great idea to add this check with suggested resolution to sp_BlitzFirst.
Thank you!
Stav
Stav – thanks for the kind words. If you’d like to make a contribution to sp_BlitzFirst, sure, just start by reading the readme (which explains where to go for code contributions) and read the code contributions guide there. Thanks!
Hi Brent,
Thanks for sharing this excellent work.
Is there any tool/script available to merge results from all database servers into one central database? So results of all servers can be analyzed by pointing one PowerBI version to a central database? By looks of it, PowerBI pbix seems supporting multiple DB servers and filtering capabilities are there.
Kindly confirm if something is already available on Git? before I start writing merge queries using the linked servers or similar techniques?
thanks
Muhammad – sure, check out the readme file on where to get help with it. That way you can talk with other users who are contributing, too, not just me. Thanks!