sp_BlitzWho is our open source replacement for sp_who and sp_who2. It has all kinds of really neat-o outputs like how many degrees of parallelism the query is using, how much memory it’s been granted, how long it’s been waiting for memory grants, and much more.
If you’re on SQL Server 2016 SP1 or newer, it can show you a query’s live execution plan from sys.dm_exec_query_statistics_xml.

Live plans add all kinds of cool stuff:
- Which query in the batch is currently executing
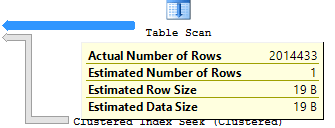
- Actual properties for each operator – with details like how many reads have been done so far, how much time has elapsed on that operator, and how many rows have returned
- Actual properties for each arrow in the plan, very helpful for estimated vs actual row counts

Now, these plans aren’t quite as cool as the ultra-cool animated plans showing continuous movement and completion percentages, but rather they’re just a point-in-time snapshot of the live plan’s actual-vs-estimated rows (as of the moment you query that DMF.) This means you may want to run sp_BlitzWho a few times, clicking on the query’s live_query_plan field each time, and comparing the differences between passes to get a rough idea of what kind of progress it’s making. (And yes, this sounds like a great opportunity for someone to build something to show query plans as they’re moving through the engine.)
To enable live query plans, you need:
- The latest sp_BlitzWho from our First Responder Kit
- SQL Server 2016 SP1 or newer
Plus either one of these two turned on:
- Slow, painful, set at session level: SET STATISTICS XML ON or SET STATISTICS PROFILE ON, both of which have to be enabled before the query starts. That’s cool if you’re doing tuning on a particular query, but not-so-good if you’re in the middle of a troubleshooting emergency. Plus, this adds a pretty big overhead to that query.
- Fast, easy, set globally: Trace flag 7412. This uses the new lightweight stats infrastructure, which Microsoft says only adds a 1-2% overhead to your queries overall. This doesn’t capture CPU metrics, but that’s usually okay for me – I’d rather just have the operator numbers to get me started. To learn more about this, watch Pedro Lopes’ GroupBy session on 2016 SP1’s enhancements.
Examples of how to use it:
|
1 2 3 4 5 |
/* Turn it on: */ DBCC TRACEON(7412, -1); /* Turn it off (only affects new queries from here on out) */ DBCC TRACEOFF(7412, -1); |
This improvement is such a great example of why Erik and I are teaching our Expert Performance Tuning for 2016 & 2017 class (and I’m demoing this very feature onstage this afternoon). So many things have improved lately, and if you haven’t been to a performance tuning class in the last year or two, you’re gonna be stunned at how many more tools you’ve got at your disposal these days.


2 Comments. Leave new
This is a new amazing opportunity! Thank you!
But when I tried to check it – an error occurred:
Msg 10054, Level 20, State 0, Line 0
A transport-level error has occurred when receiving results from the server.
SQL 2019 fyi… Just noticed this in the trace flag docs re: 7412 trace flag:
“Note: This trace flag applies to SQL Server 2016 (13.x) SP1 and higher builds. Starting with SQL Server 2019 (15.x) this trace flag has no effect because lightweight profiling is enabled by default.”
https://docs.microsoft.com/en-us/sql/t-sql/database-console-commands/dbcc-traceon-trace-flags-transact-sql?view=sql-server-ver15
However, further up they show trace flag 2451:
“2451 Enables the equivalent of the last actual execution plan in sys.dm_exec_query_plan_stats.”